How do I establish what constitutes an important finding and how many participants do I need to detect it?
The following slides accompanied a presentation delivered at ASHA’s Clinical Practice Research Institute.
Overview of Group Studies of Treatment
Adapted from Gallin & Ognibene (2007).
A straightforward challenge in logical conclusion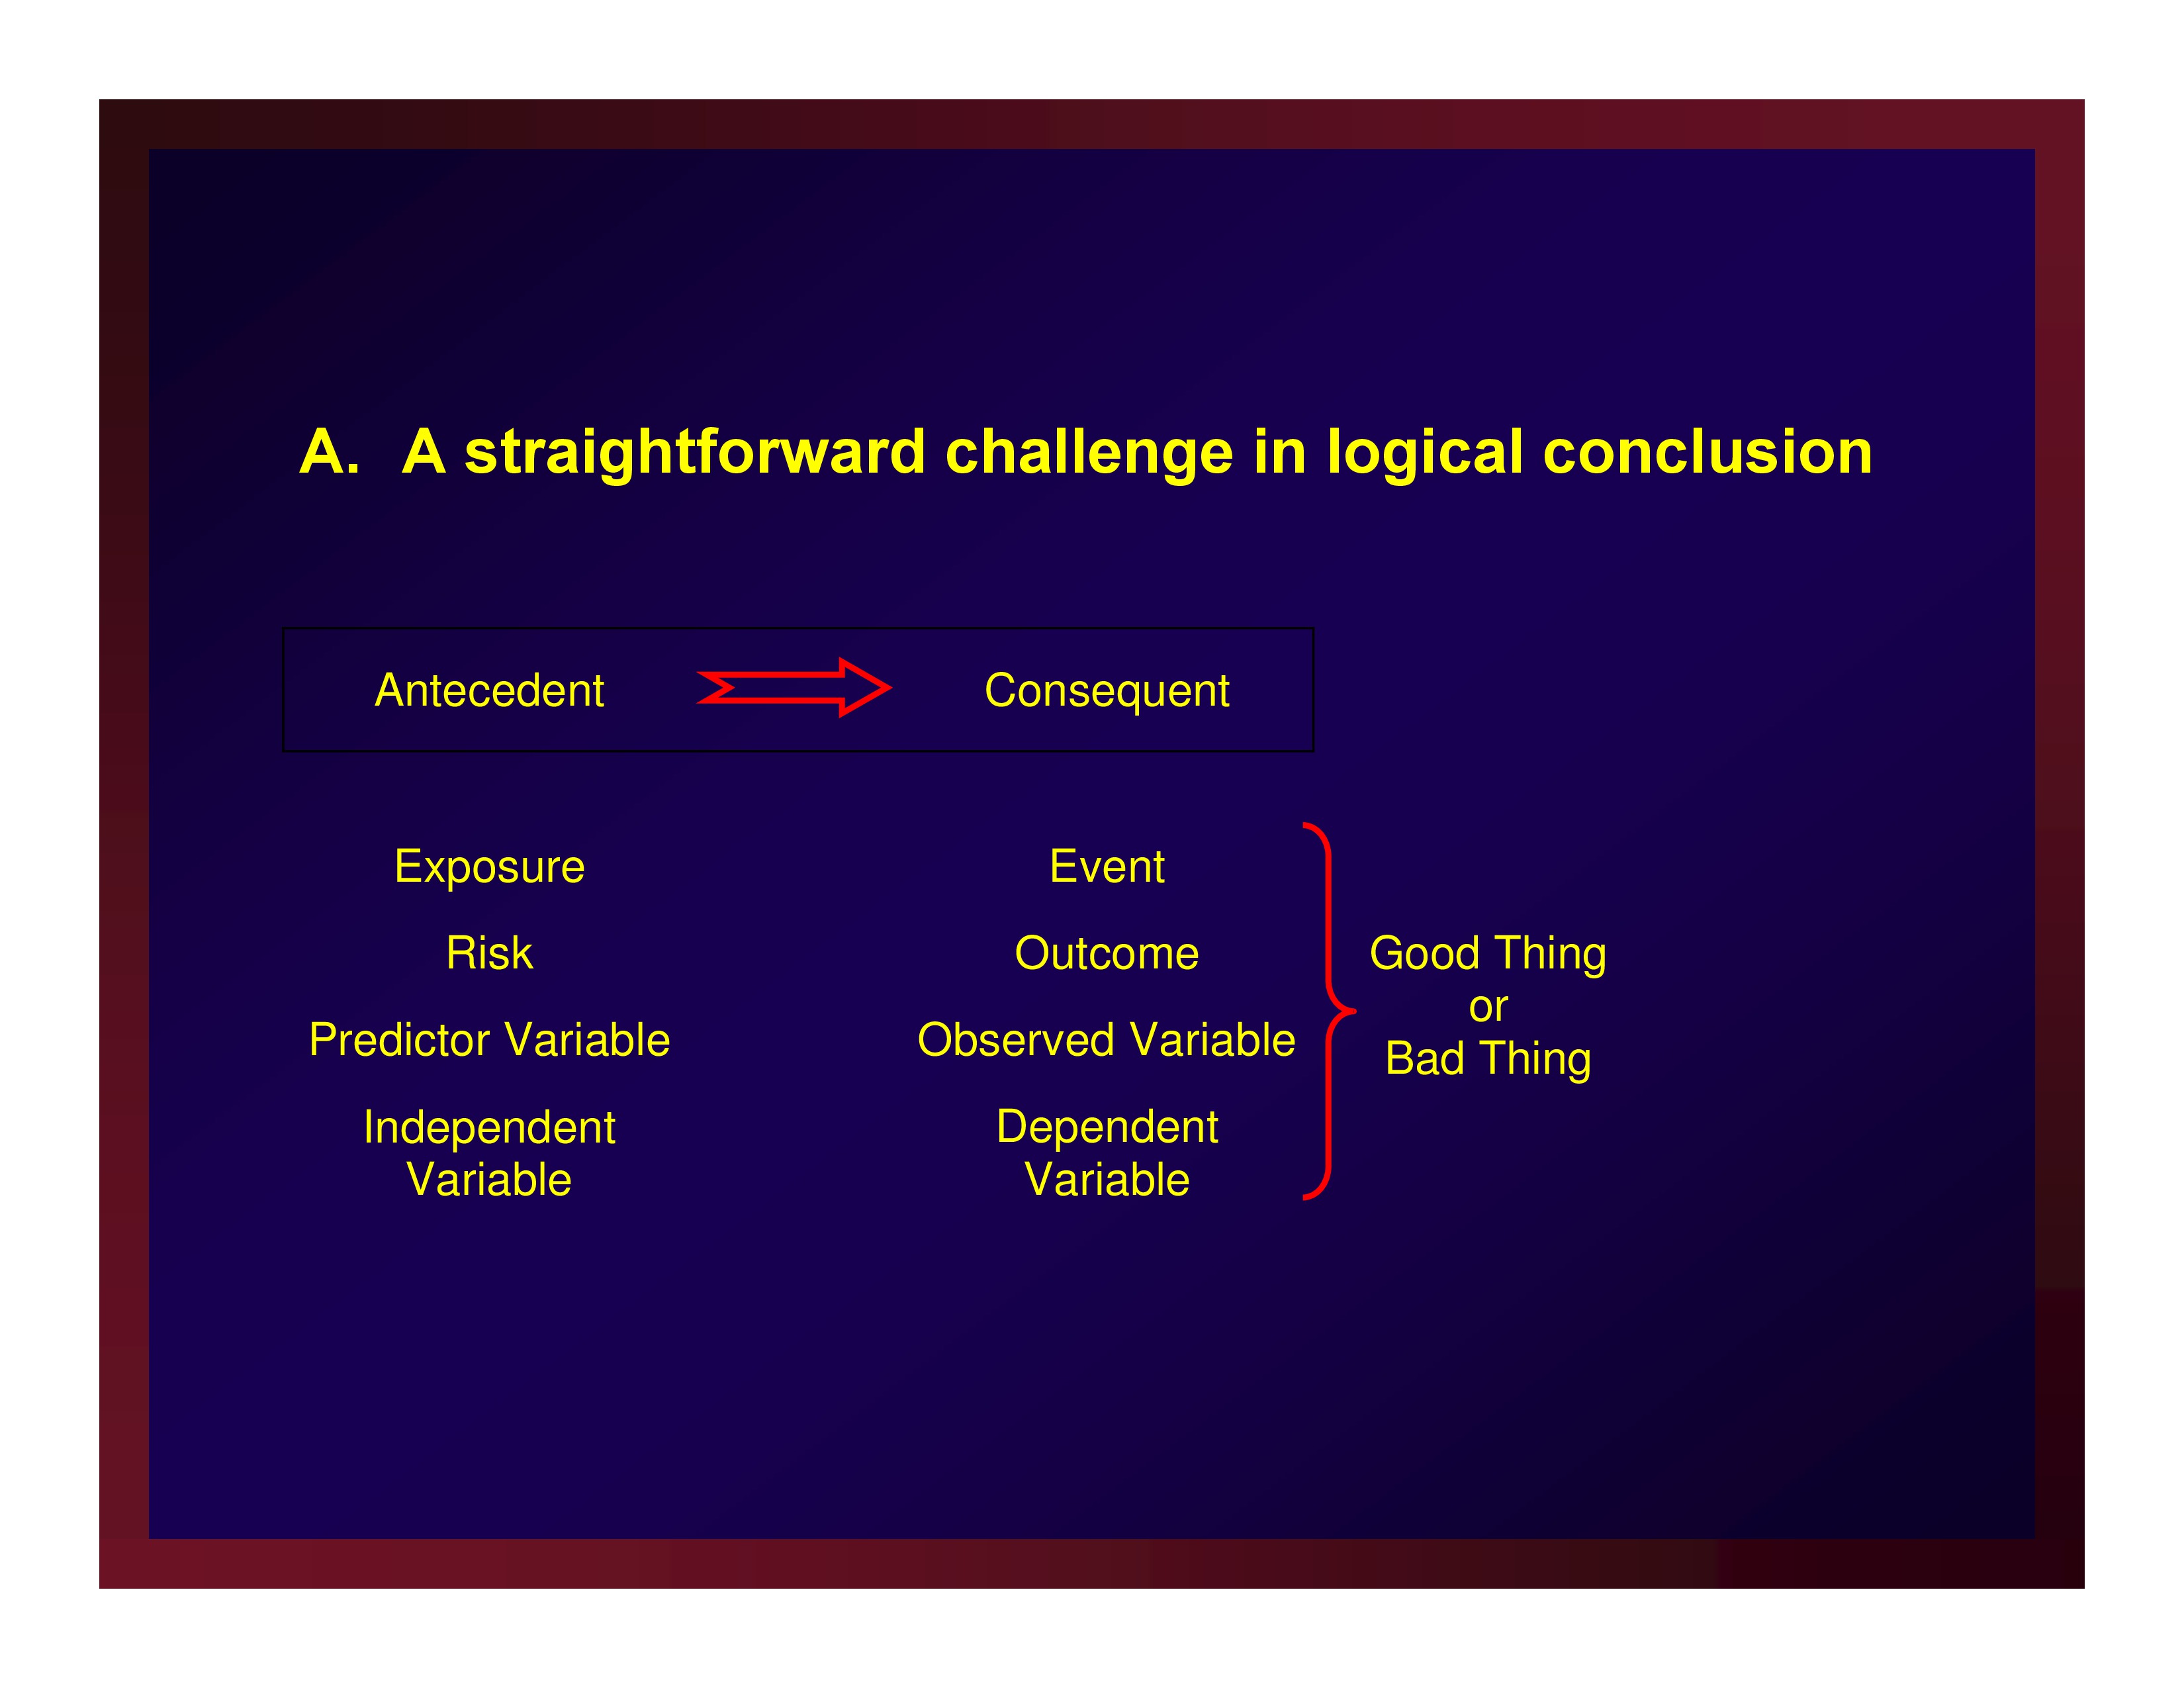

Events, e.g.,
- Death
- Disease state
- Successful treatment outcome
- Return to work
- Discharge to independent living
Ecological or correlational designs
The units of measure are population values (not observations of individuals)
Observational designs
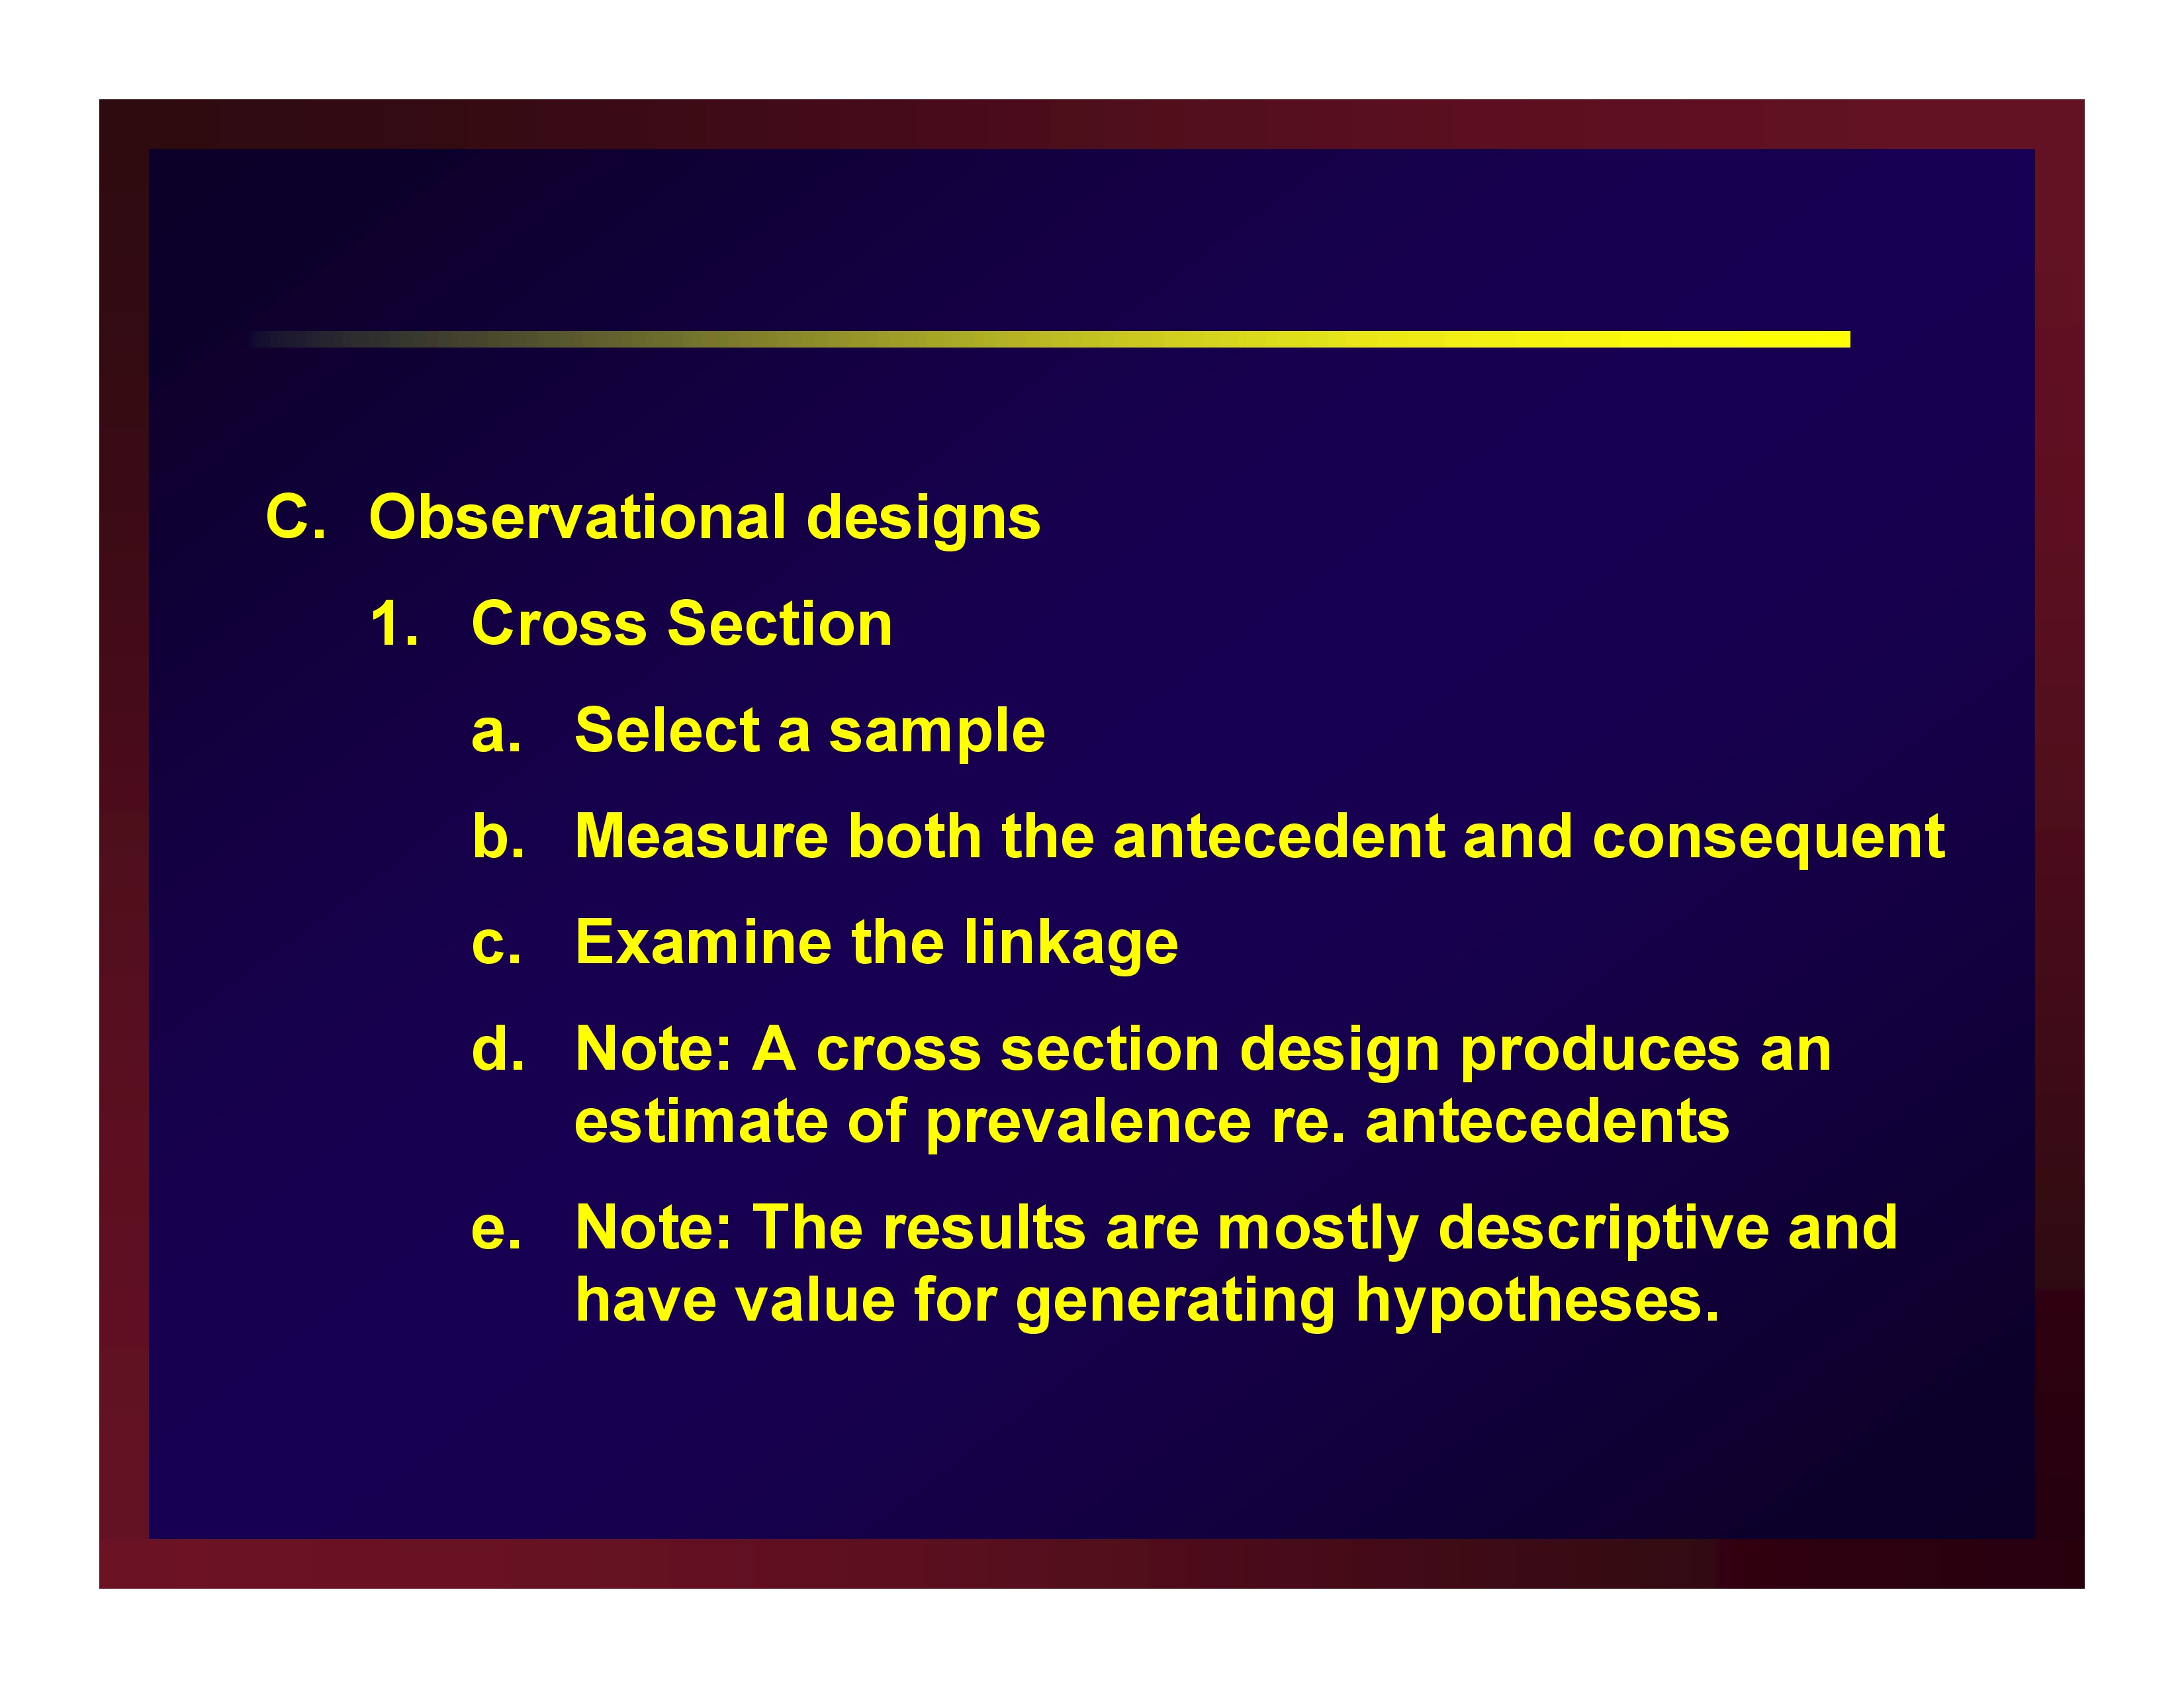
Cross Section
- Select a sample
- Examine the linkage
- Note: A cross section design produces an estimate of prevalence re. antecedents
- Note: The results are mostly descriptive and have value for generating hypotheses.
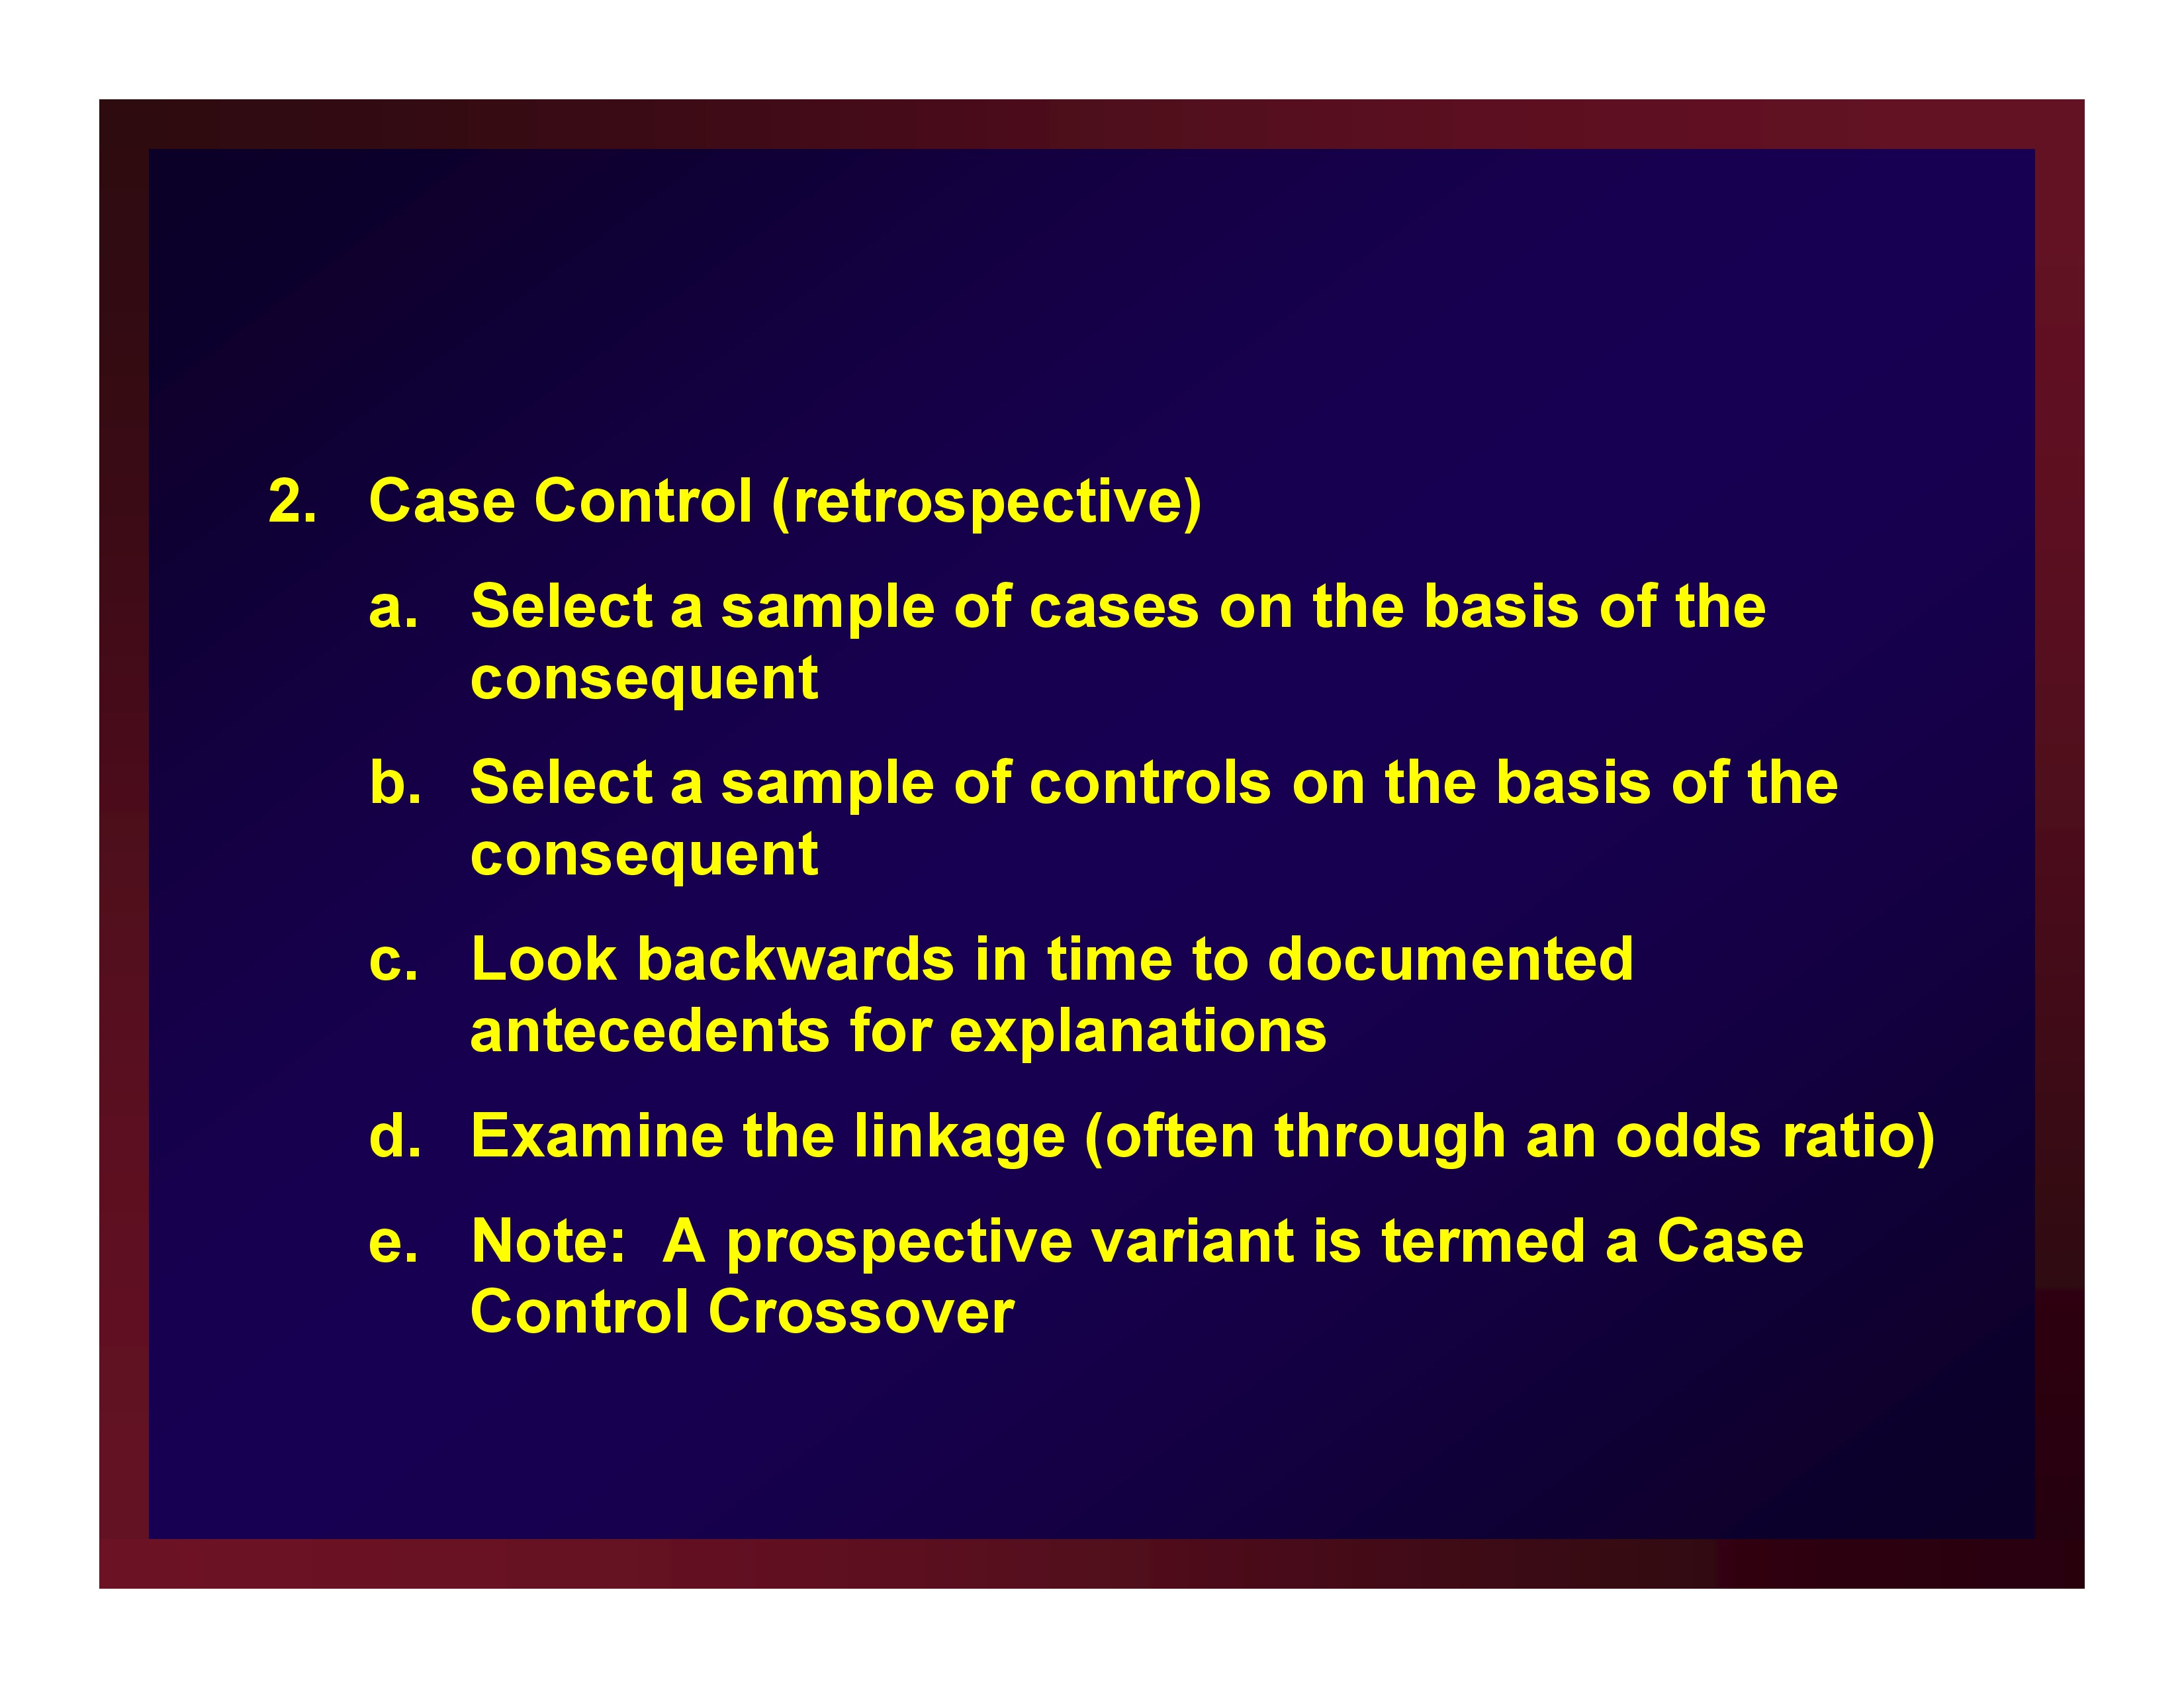
Case Control (retrospective)
- Select a sample of cases on the basis of the consequent
- Select a sample of controls on the basis of the consequent
- Look backwards in time to documented antecedents for explanations
- Examine the linkage (often through an odds ratio)
- Note: A prospective variant is termed a Case Control Crossover
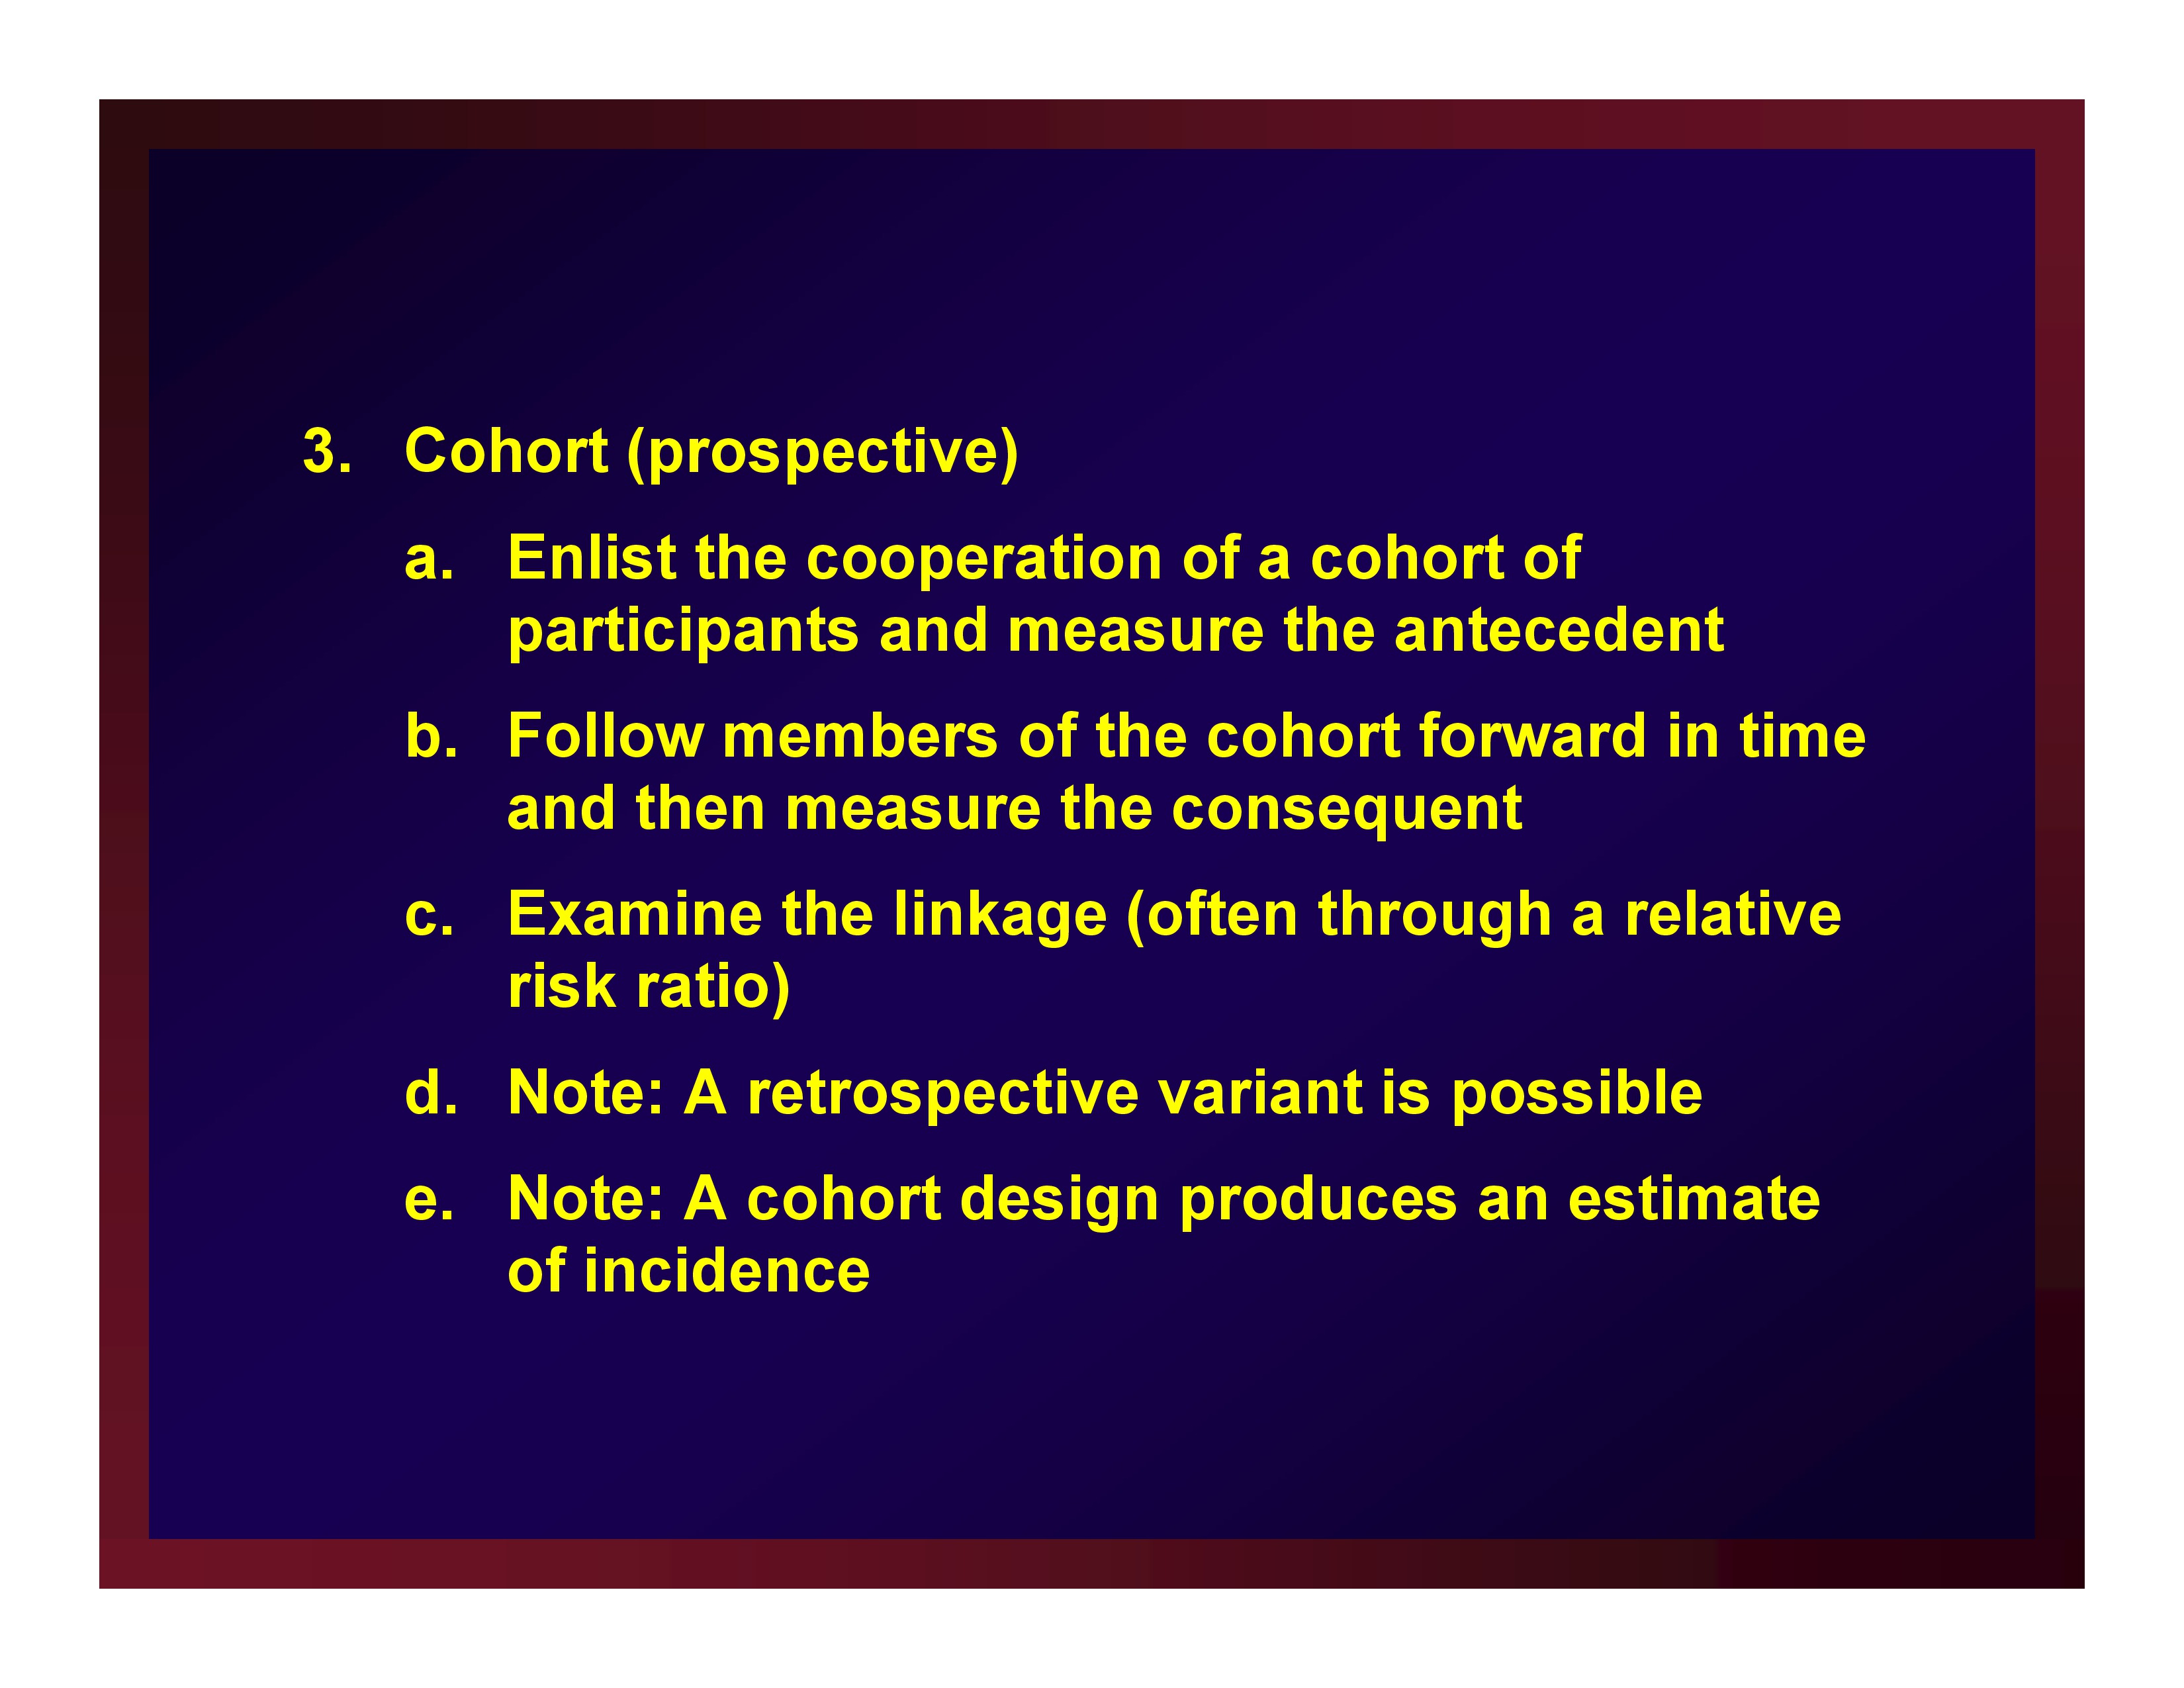
Cohort (prospective)
- Enlist the cooperation of a cohort of participants and measure the antecedent
- Follow members of the cohort forward in time and then measure the consequent
- Examine the linkage (often through a relative risk ratio)
- Note: A retrospective variant is possible
- Note: A cohort design produces an estimate of incidence
Causal Inference Studies: Controlled Trials
Parallel groups
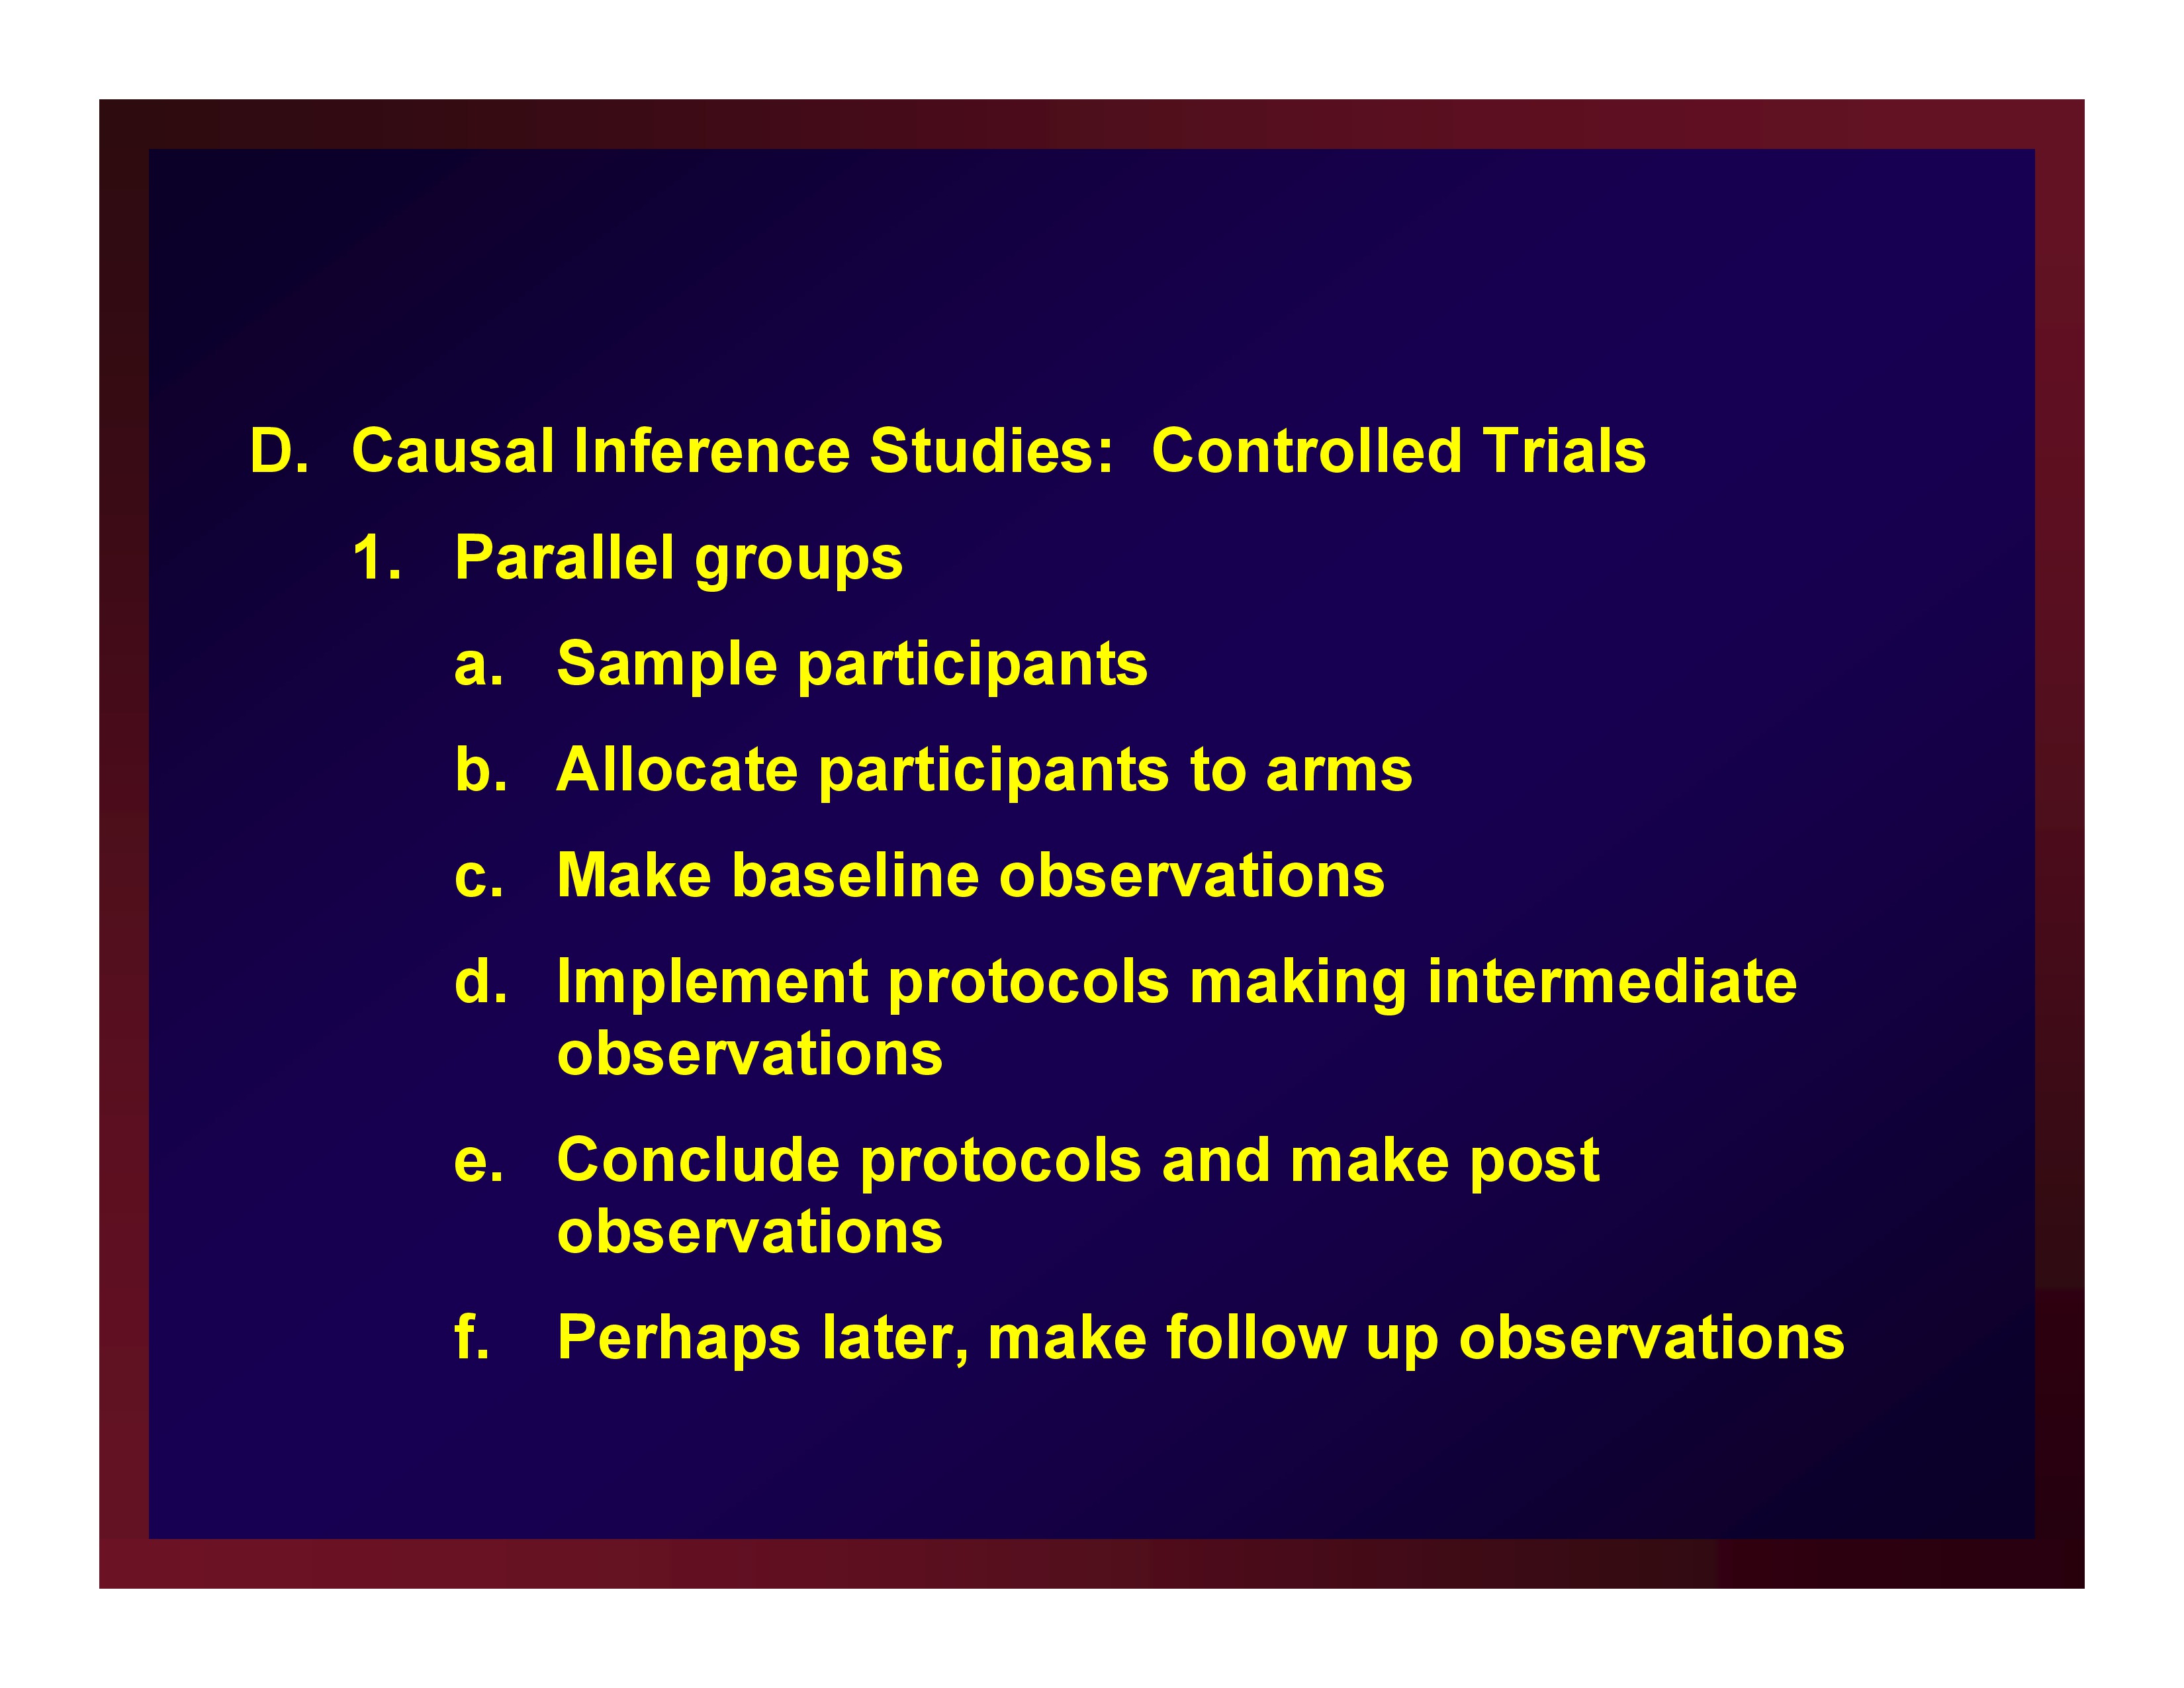
Parallel groups
- Sample participants
- Allocate participants to arms
- Make baseline observations
- Implement protocols making intermediate observations
- Conclude protocols and make post observations
- Perhaps later, make follow up observations
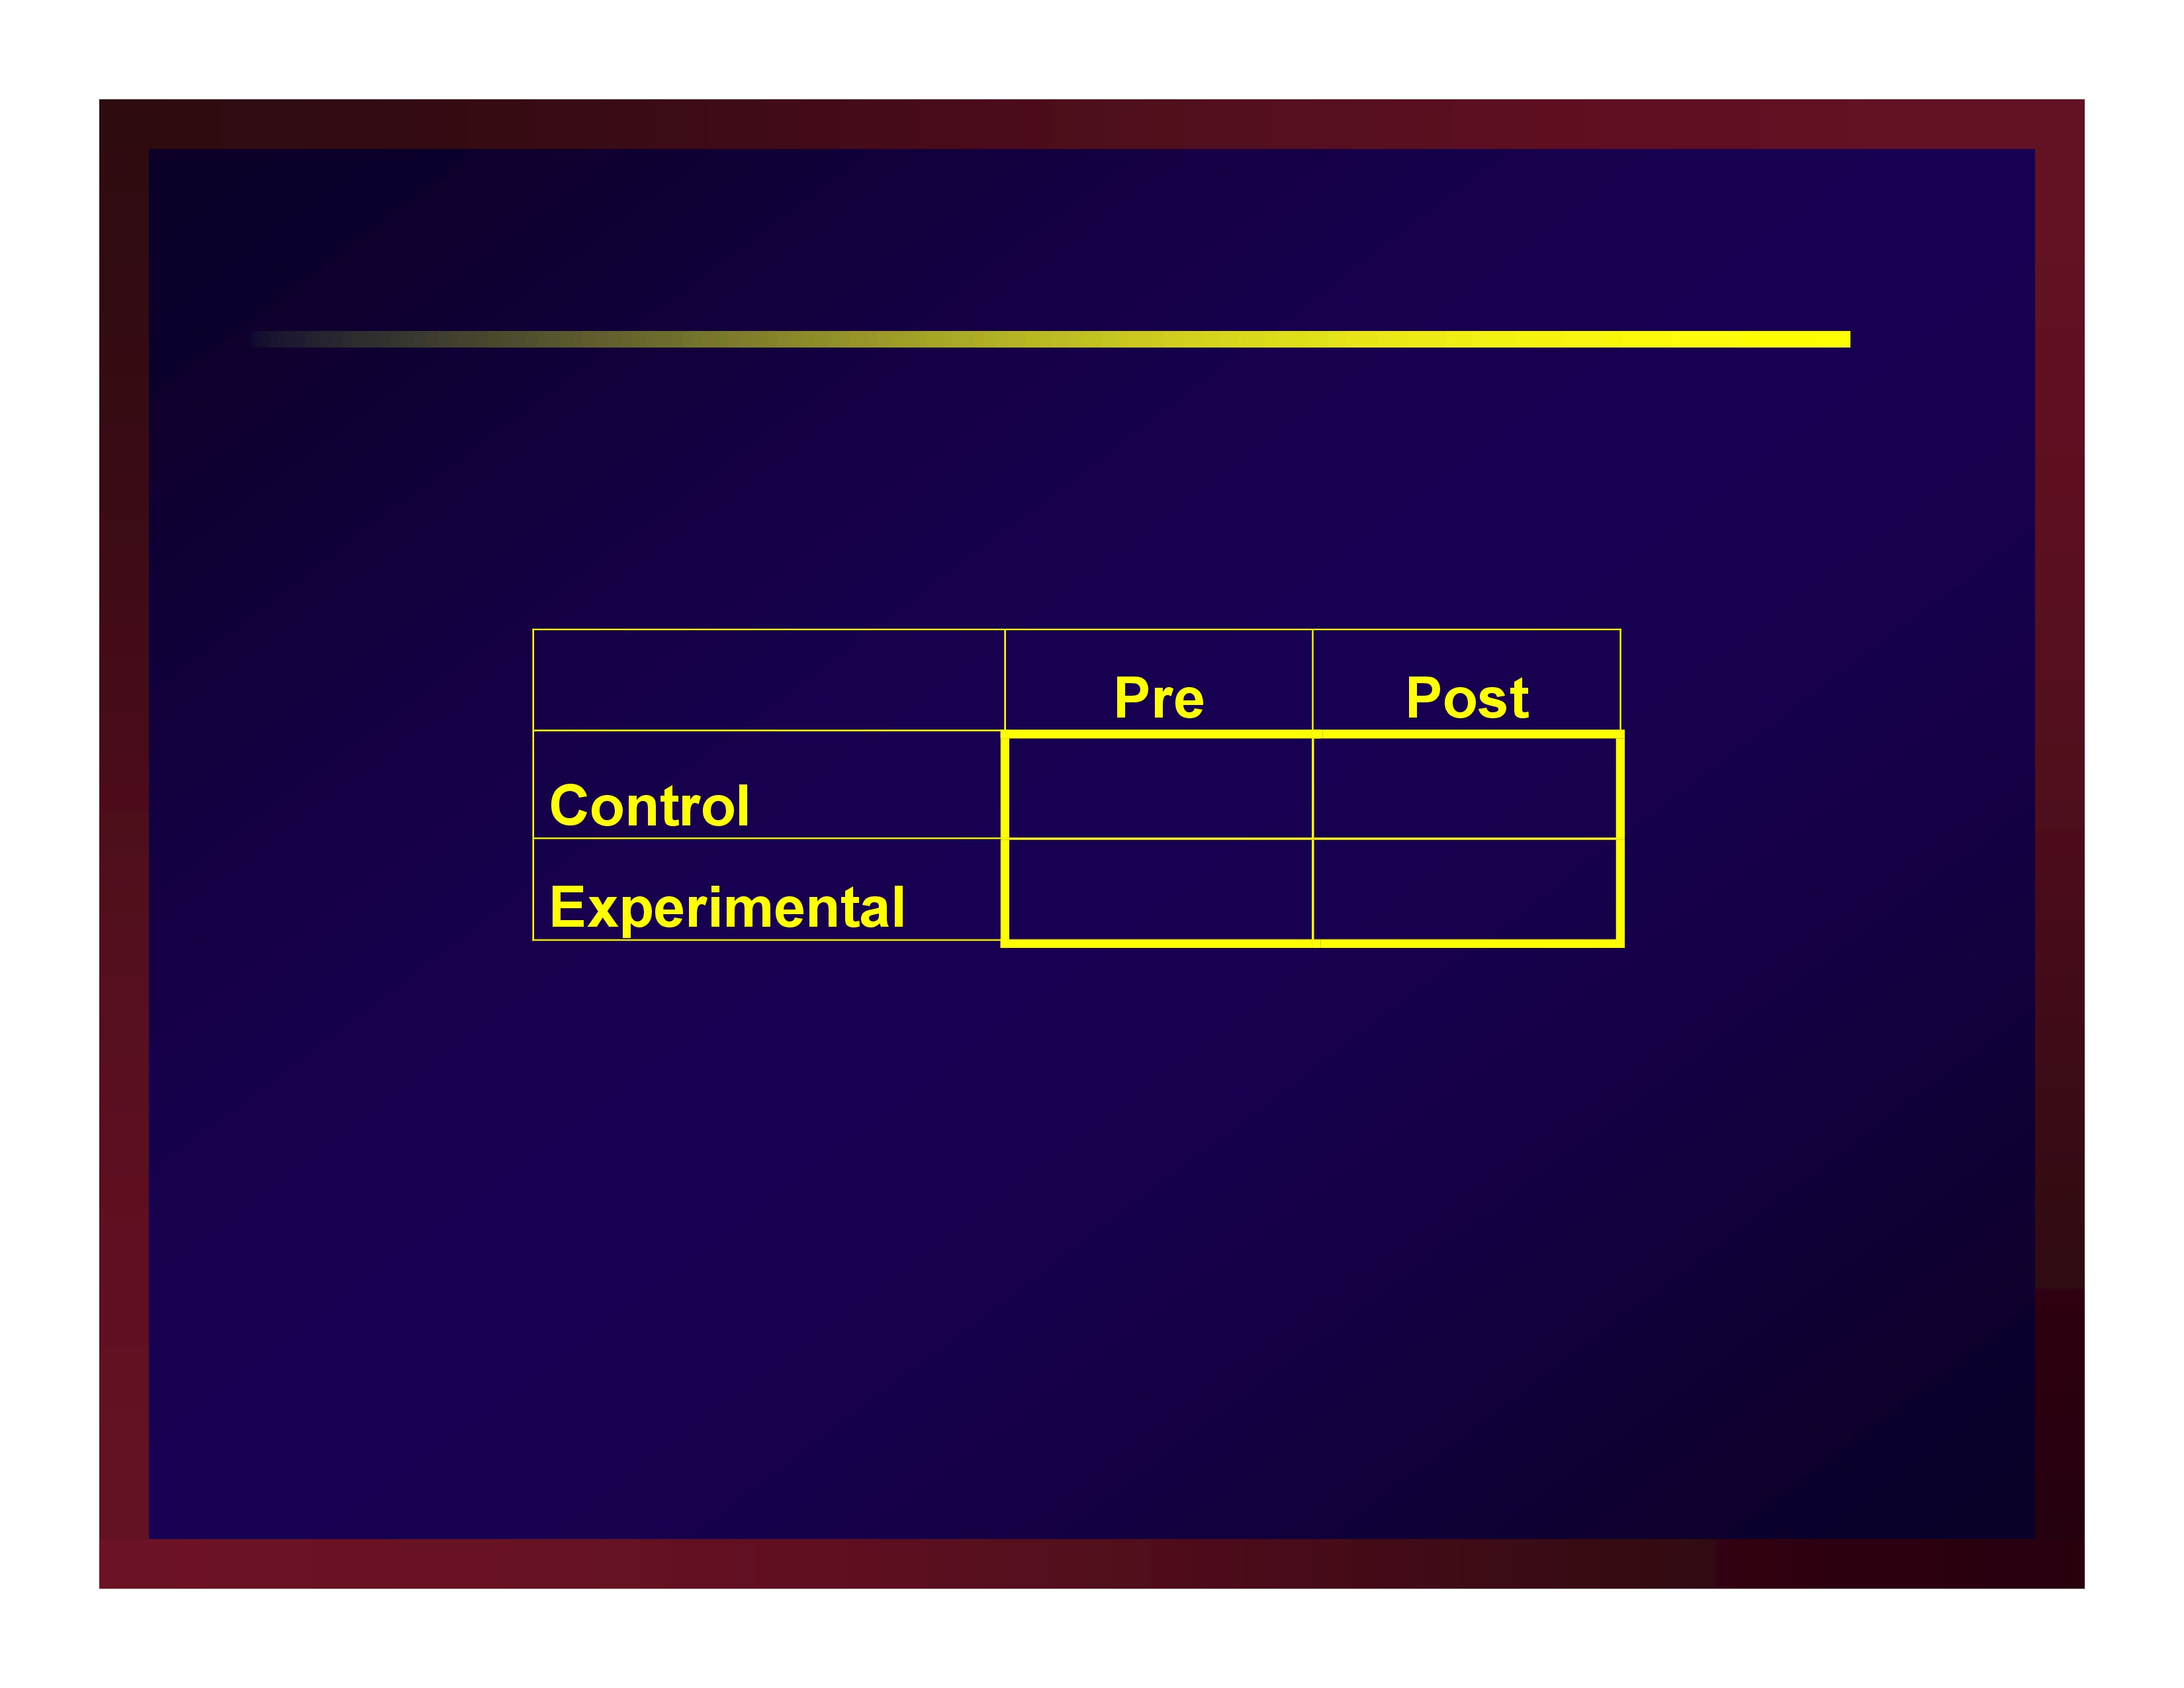
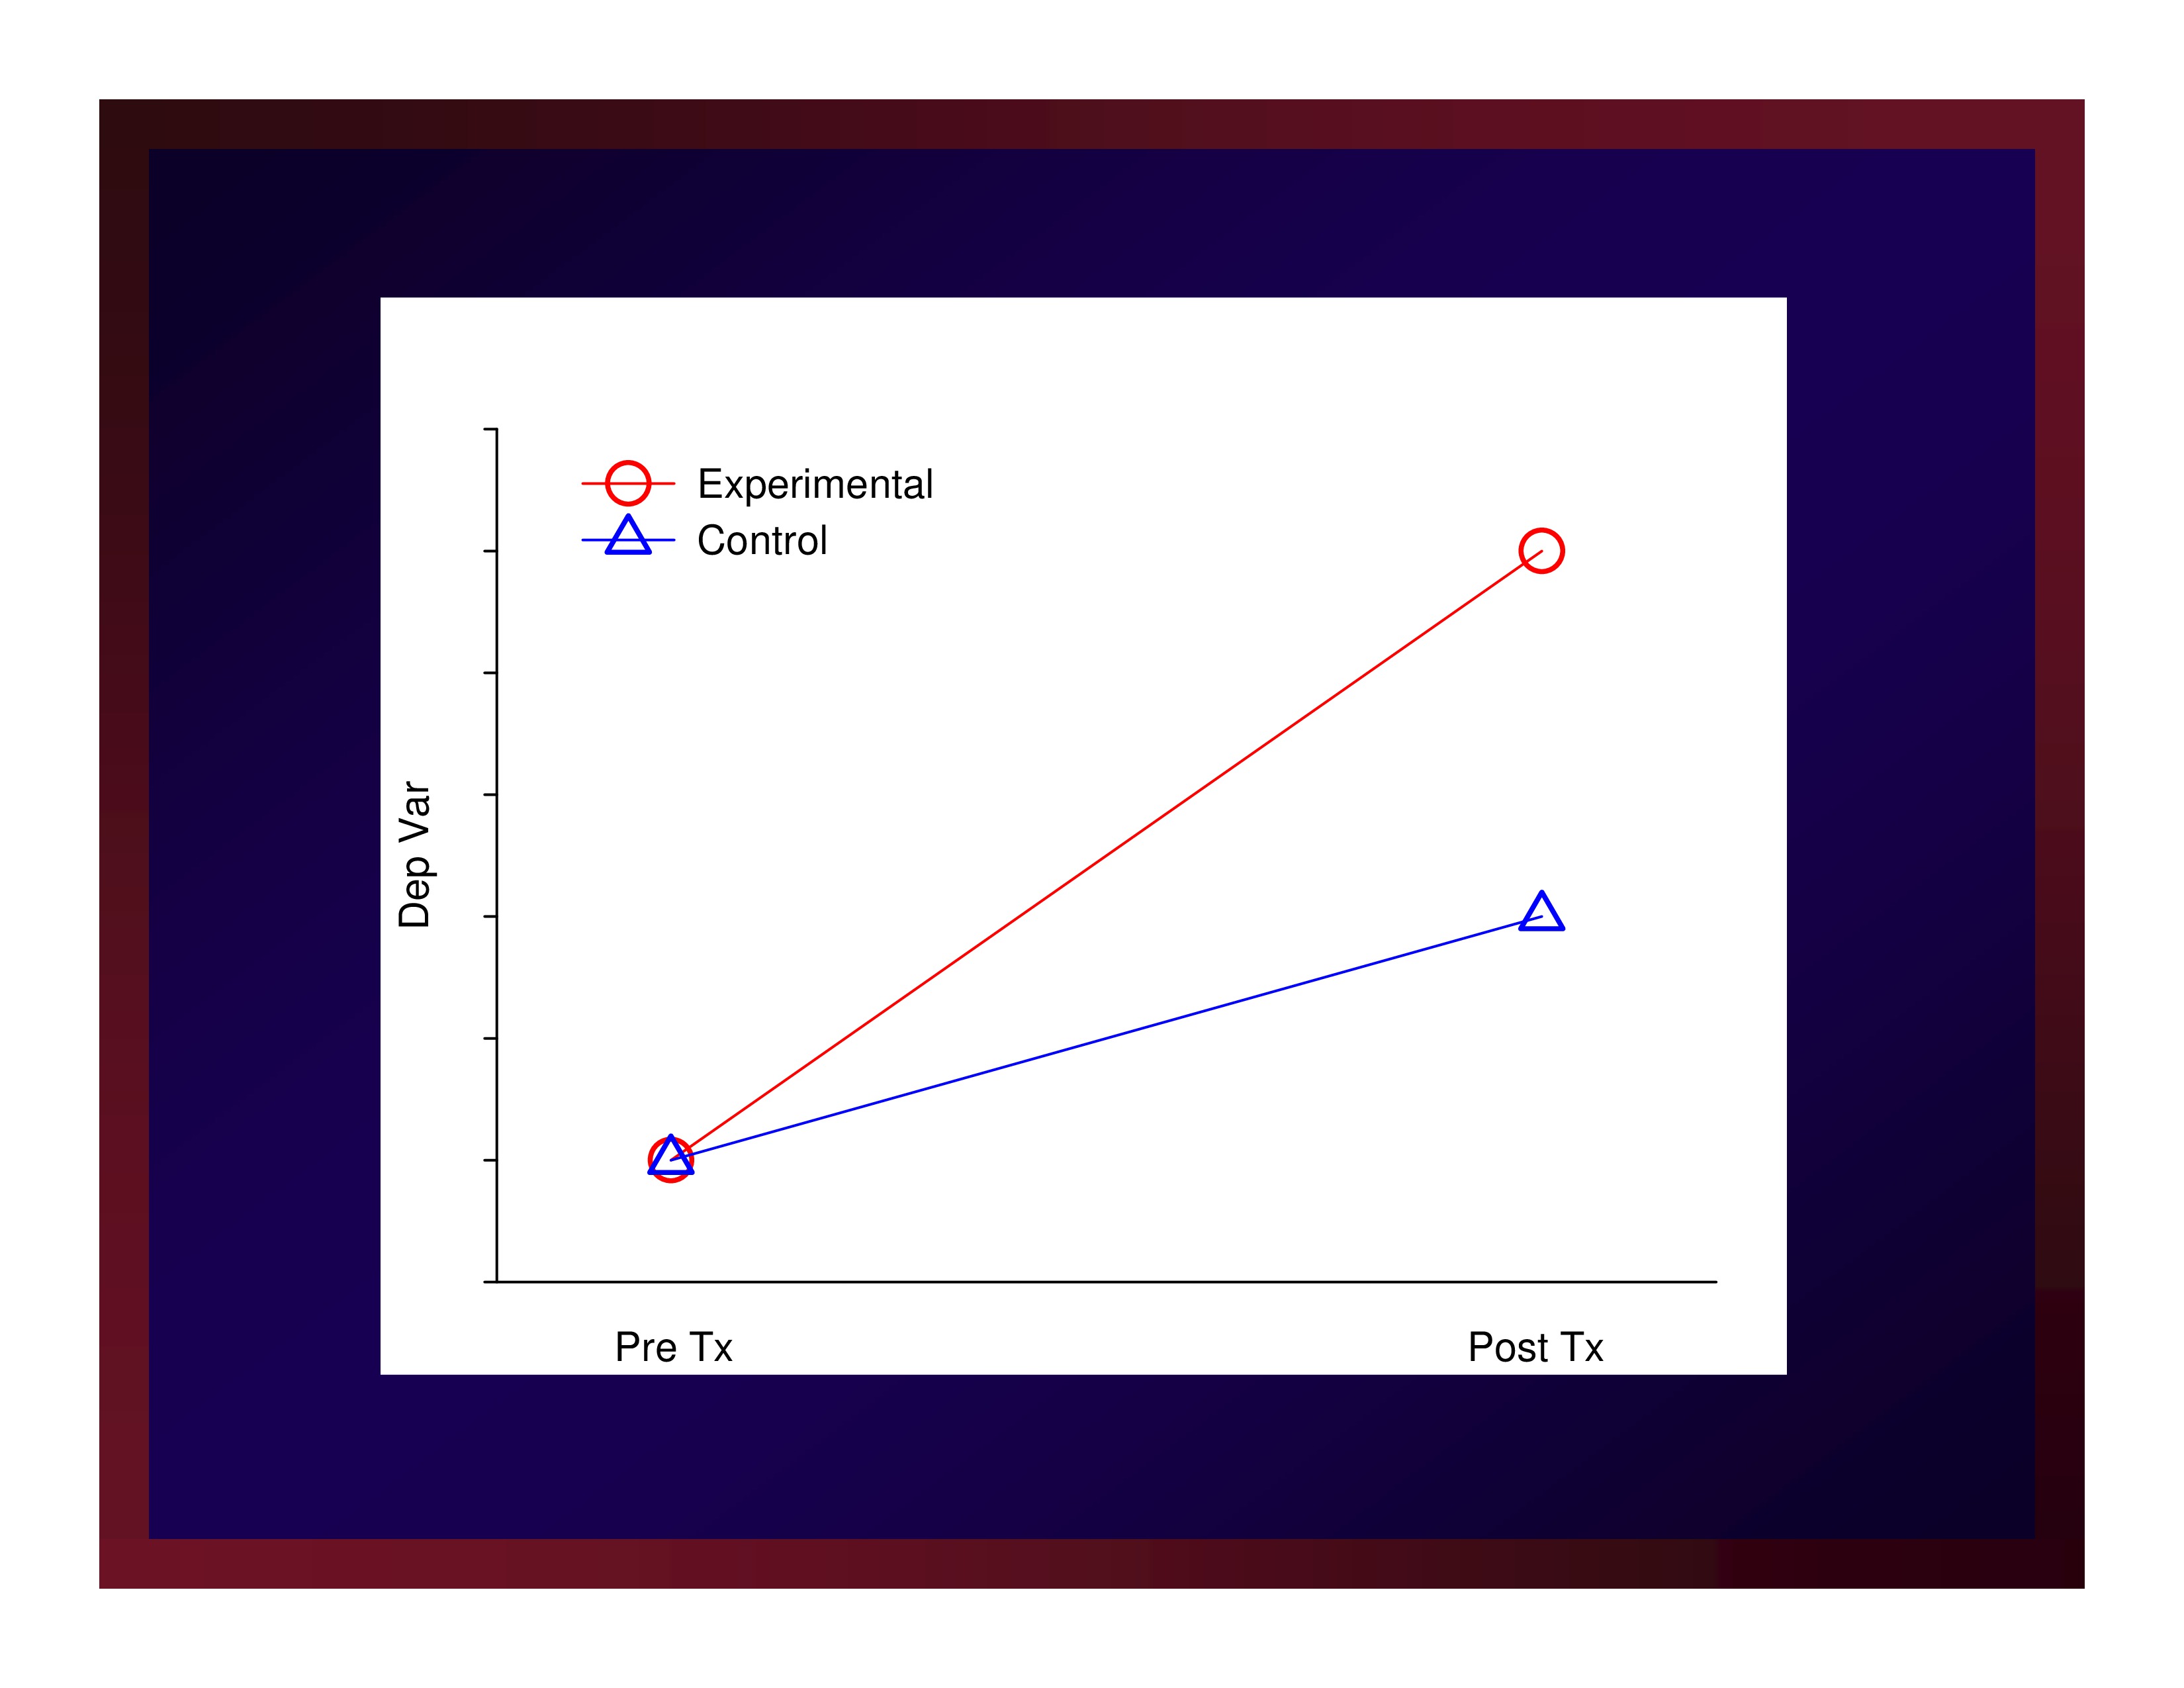

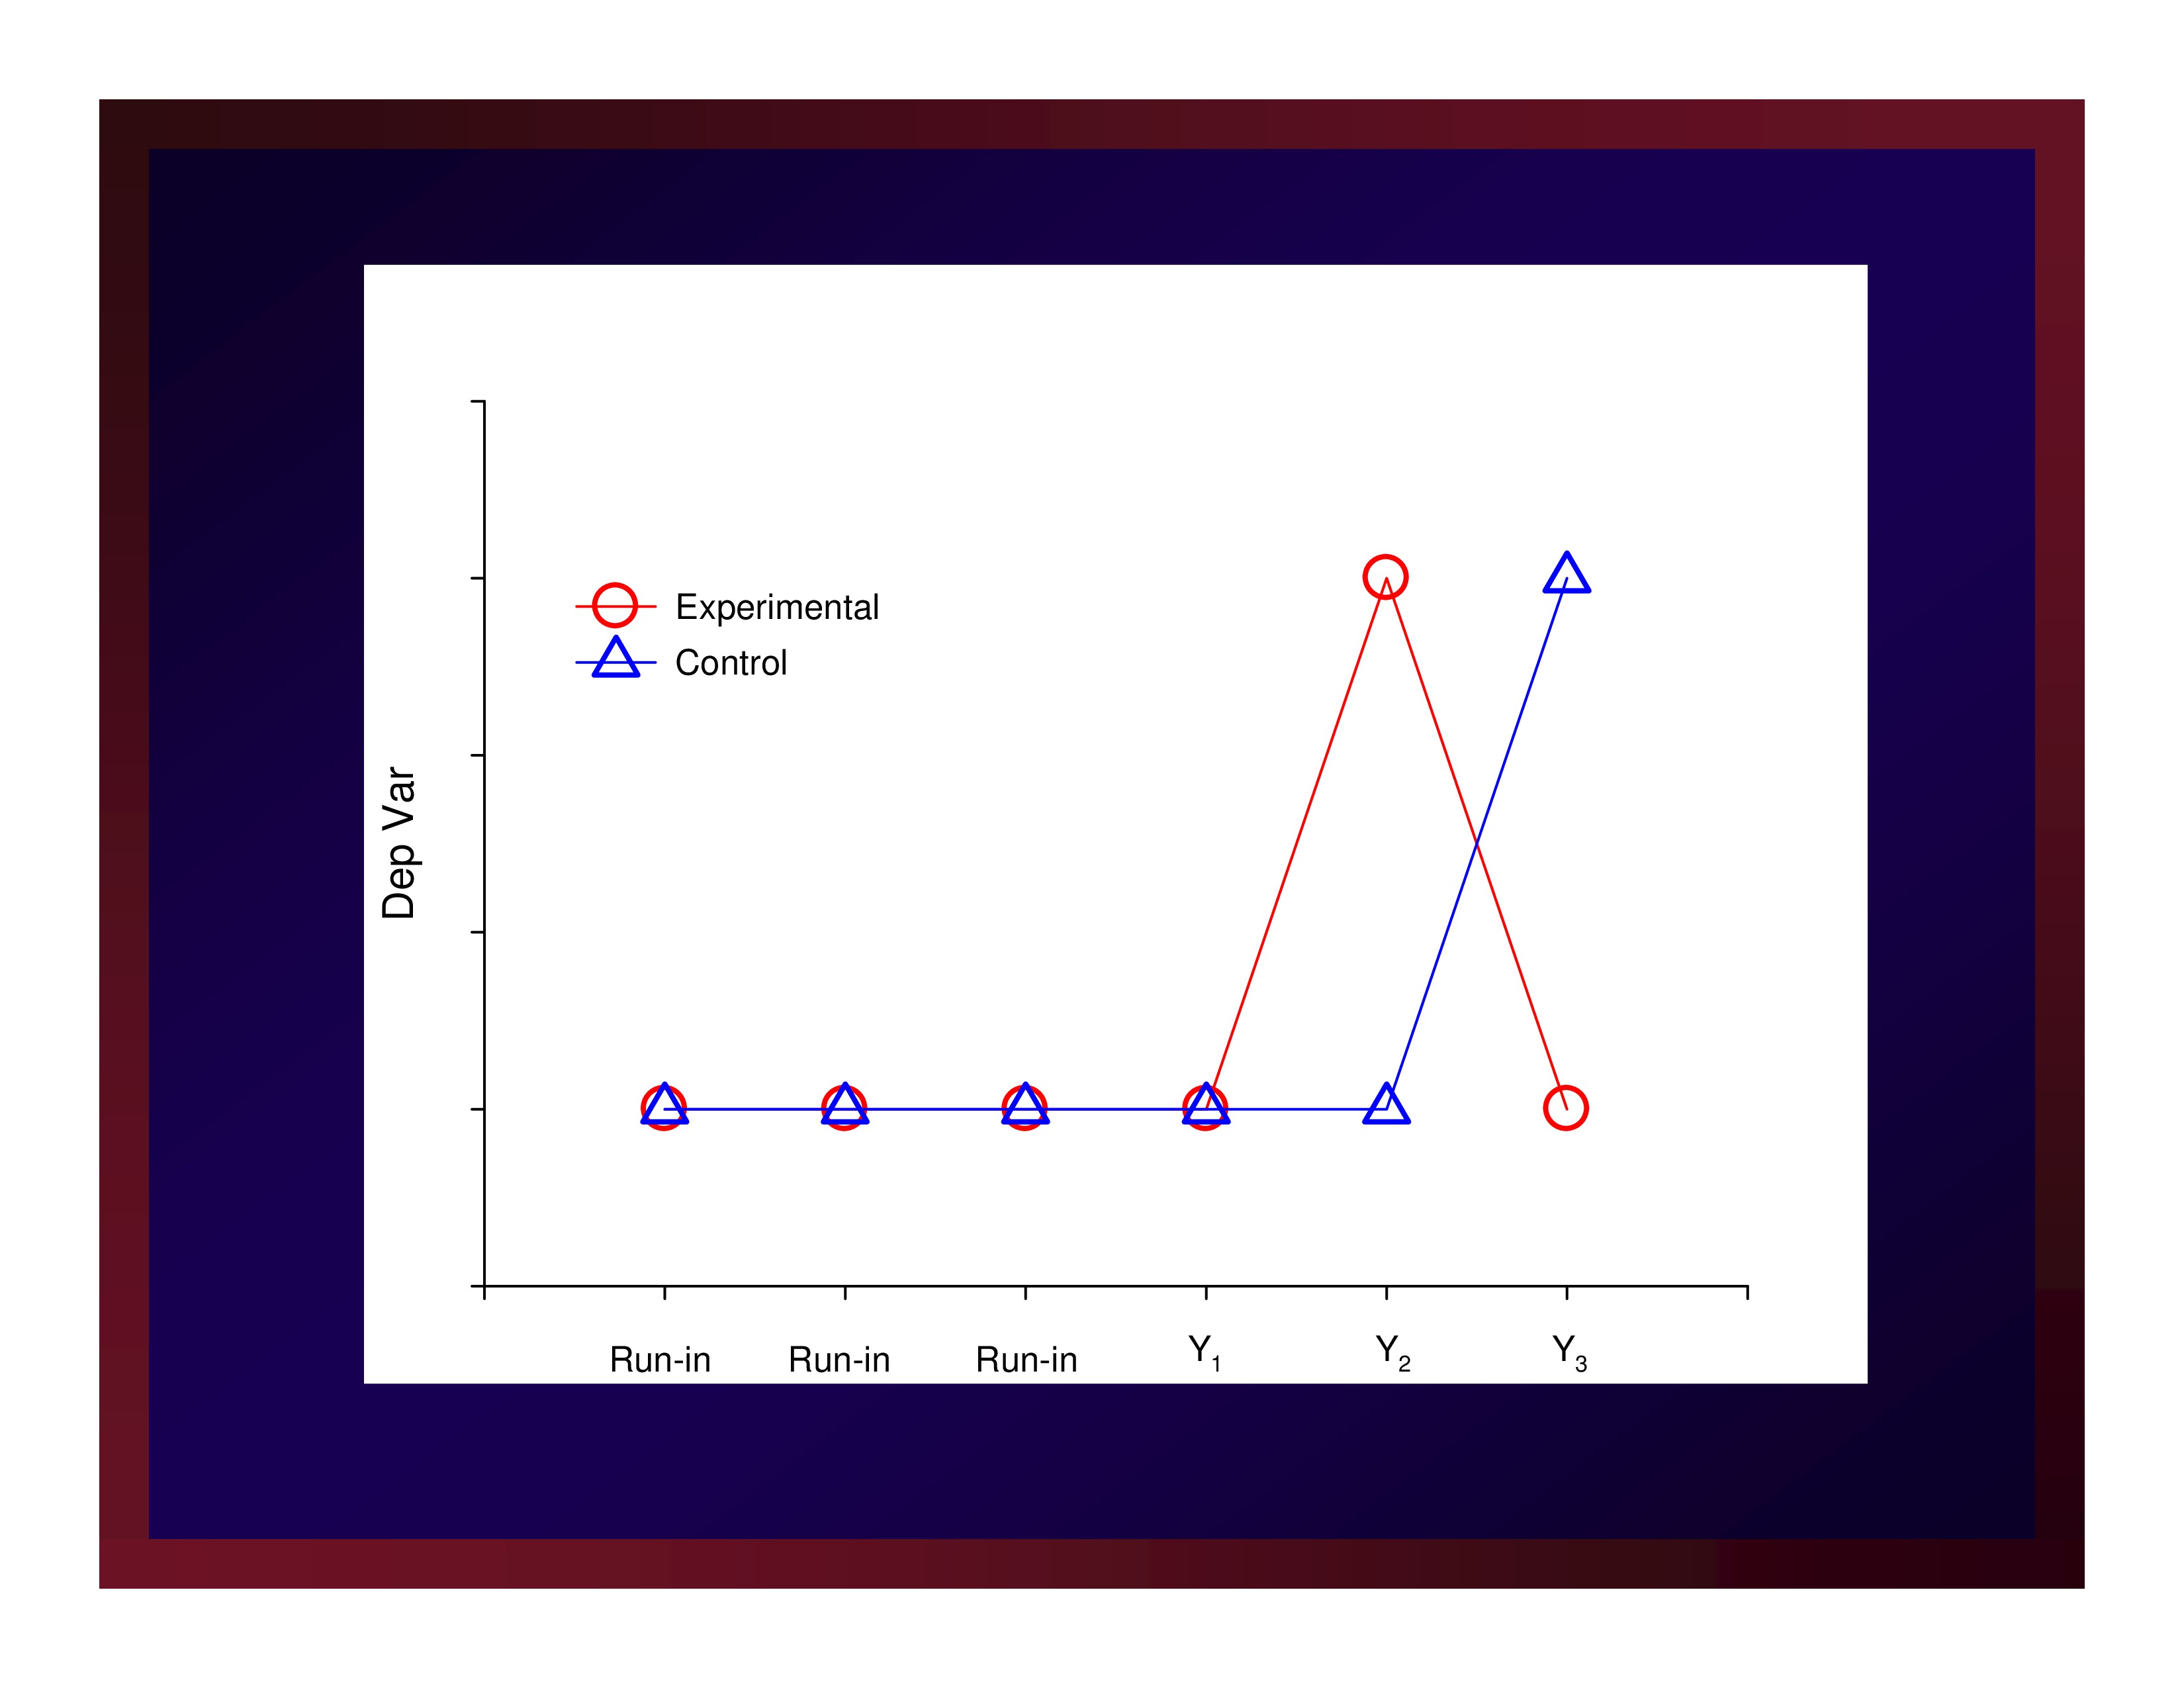
Cross Over
- Sample participants
- Allocate participants to arms
- Make run-in observations
- Make pre-period-1 observations
- Make period-1/period-2 cross-over observations
- Make post-period-2 observations
Detecting and Establishing “Importance”
Premise

The role of the binary choice between [ p ≤ α ] and [ p > α ], is necessary for deciding the tenability of a null hypothesis (statistical significance).

Rejecting a false null hypothesis is wholly insufficient for deciding the meaningfulness of an outcome (clinical significance).
Setting α=0.05 is a choice based largely in a rigid ritual rather than critical thought. However, a long history has brought us to this point.
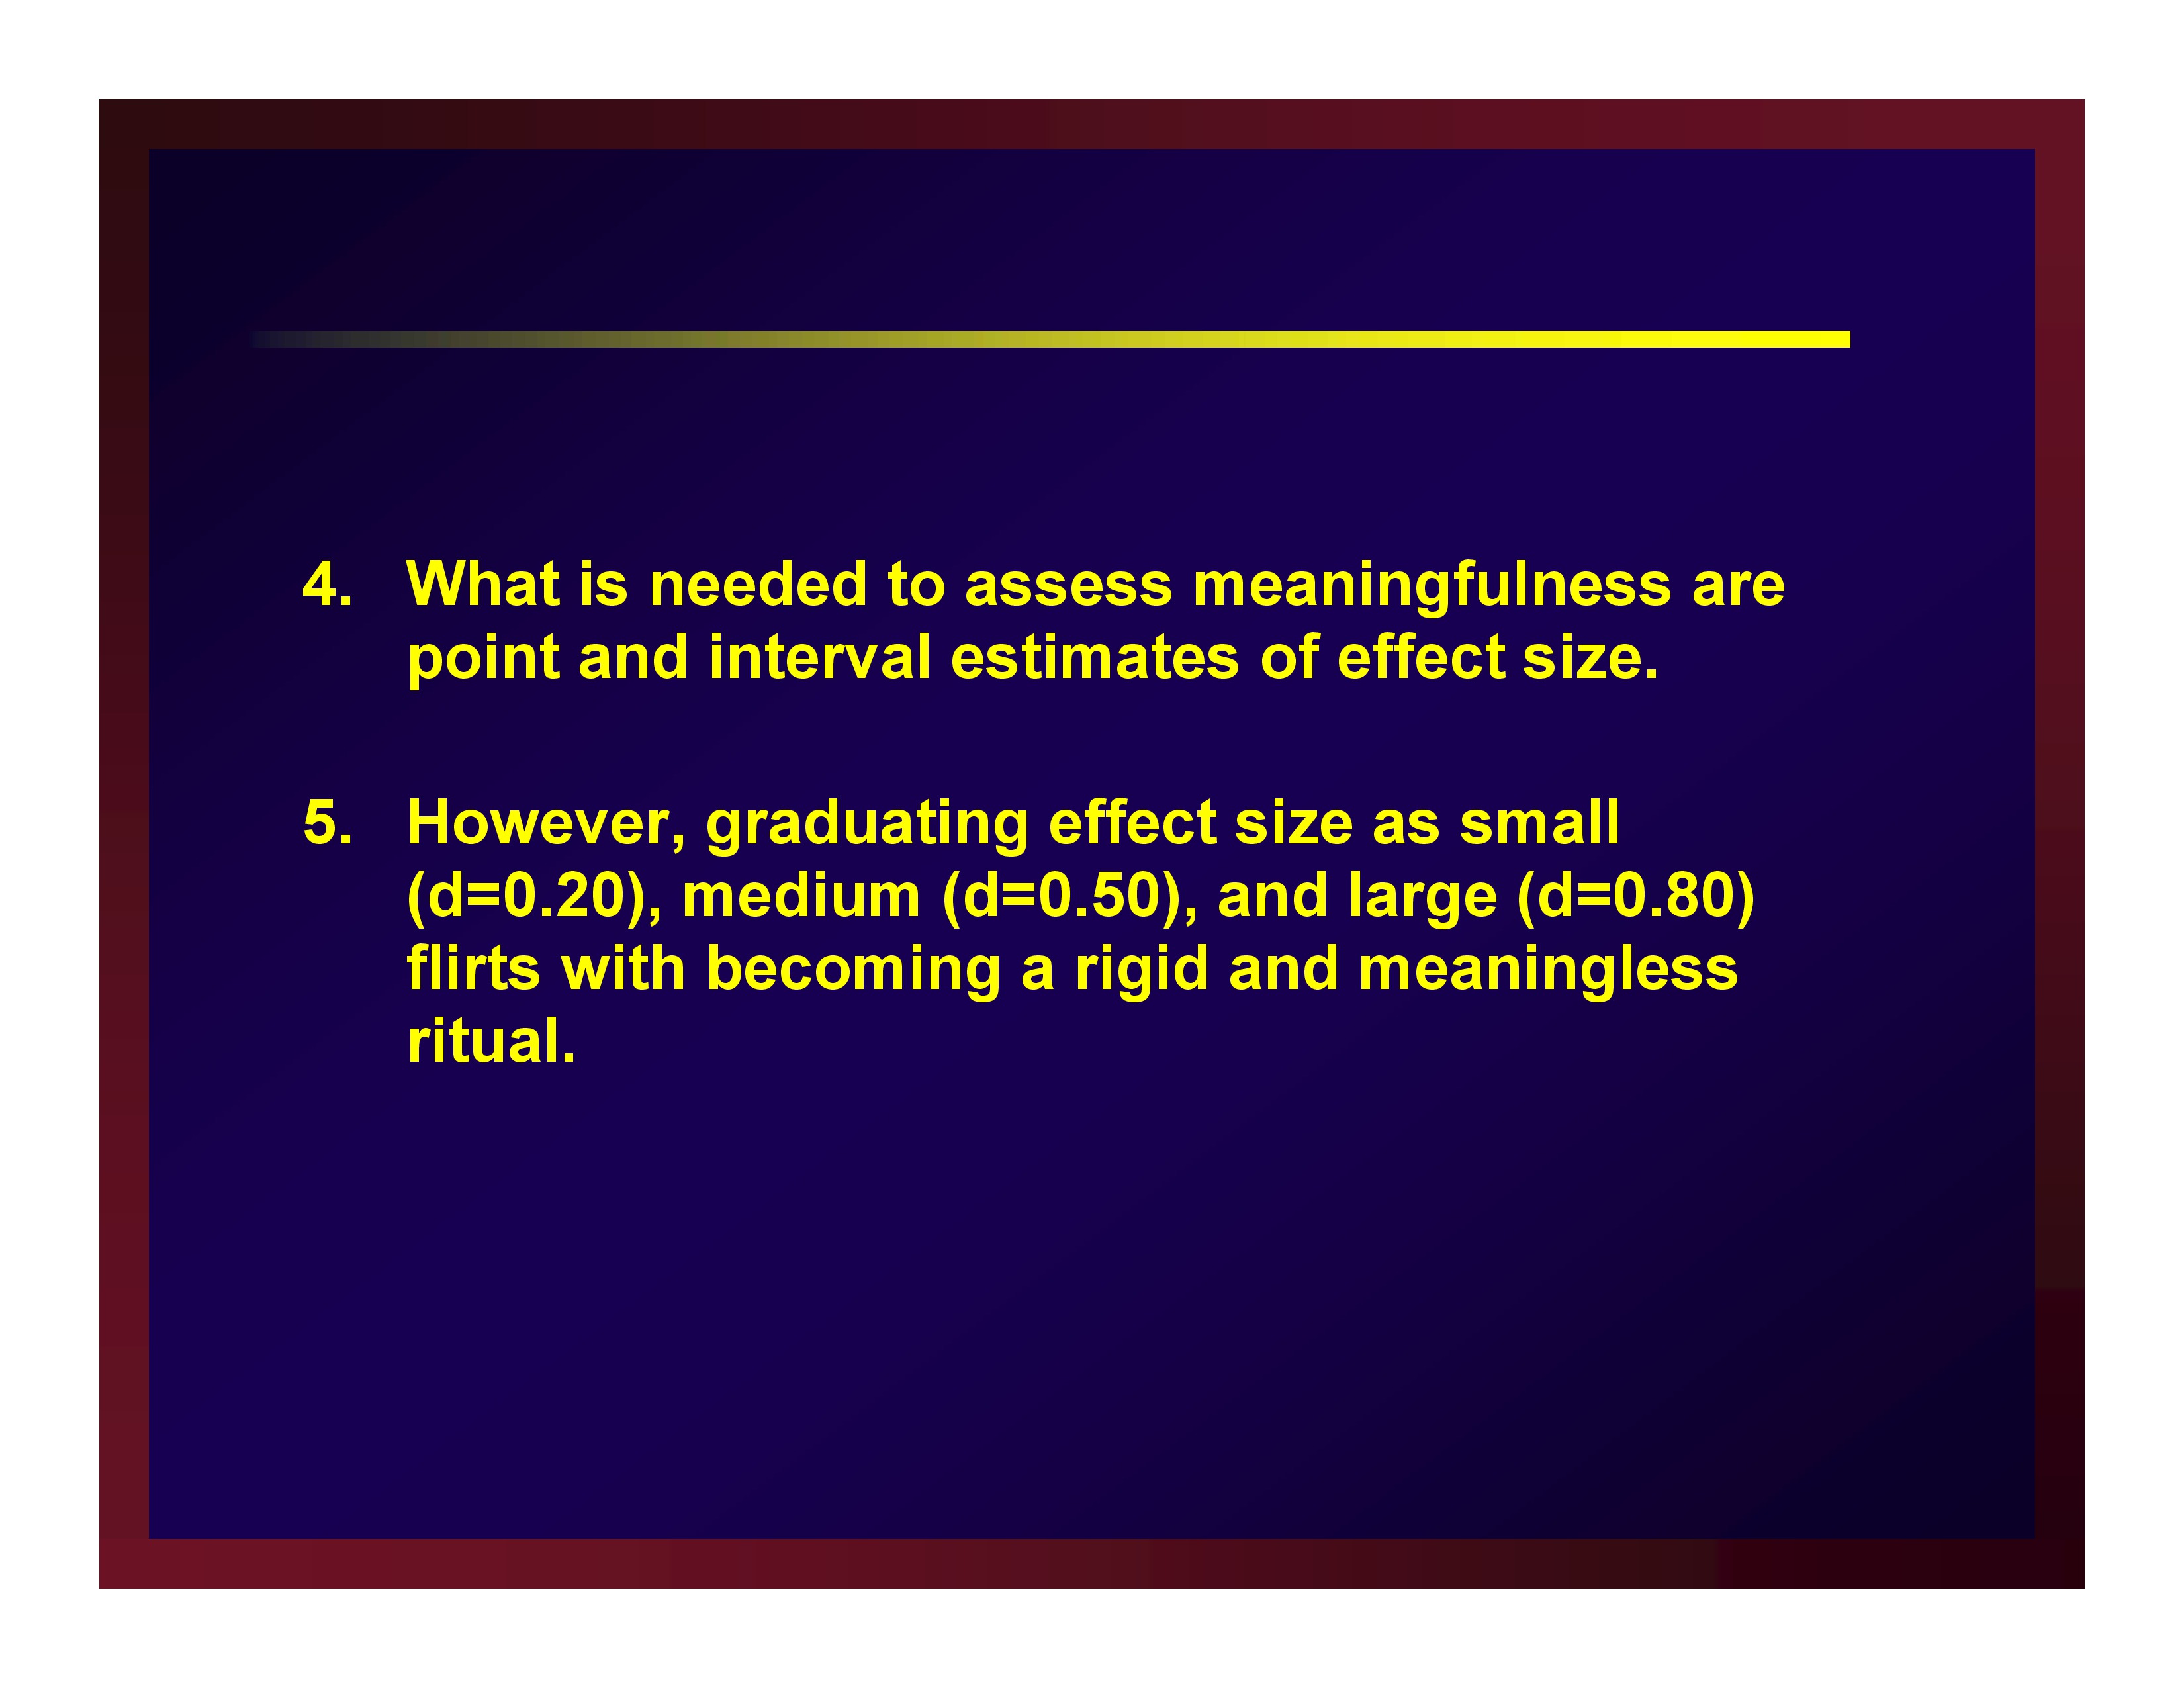
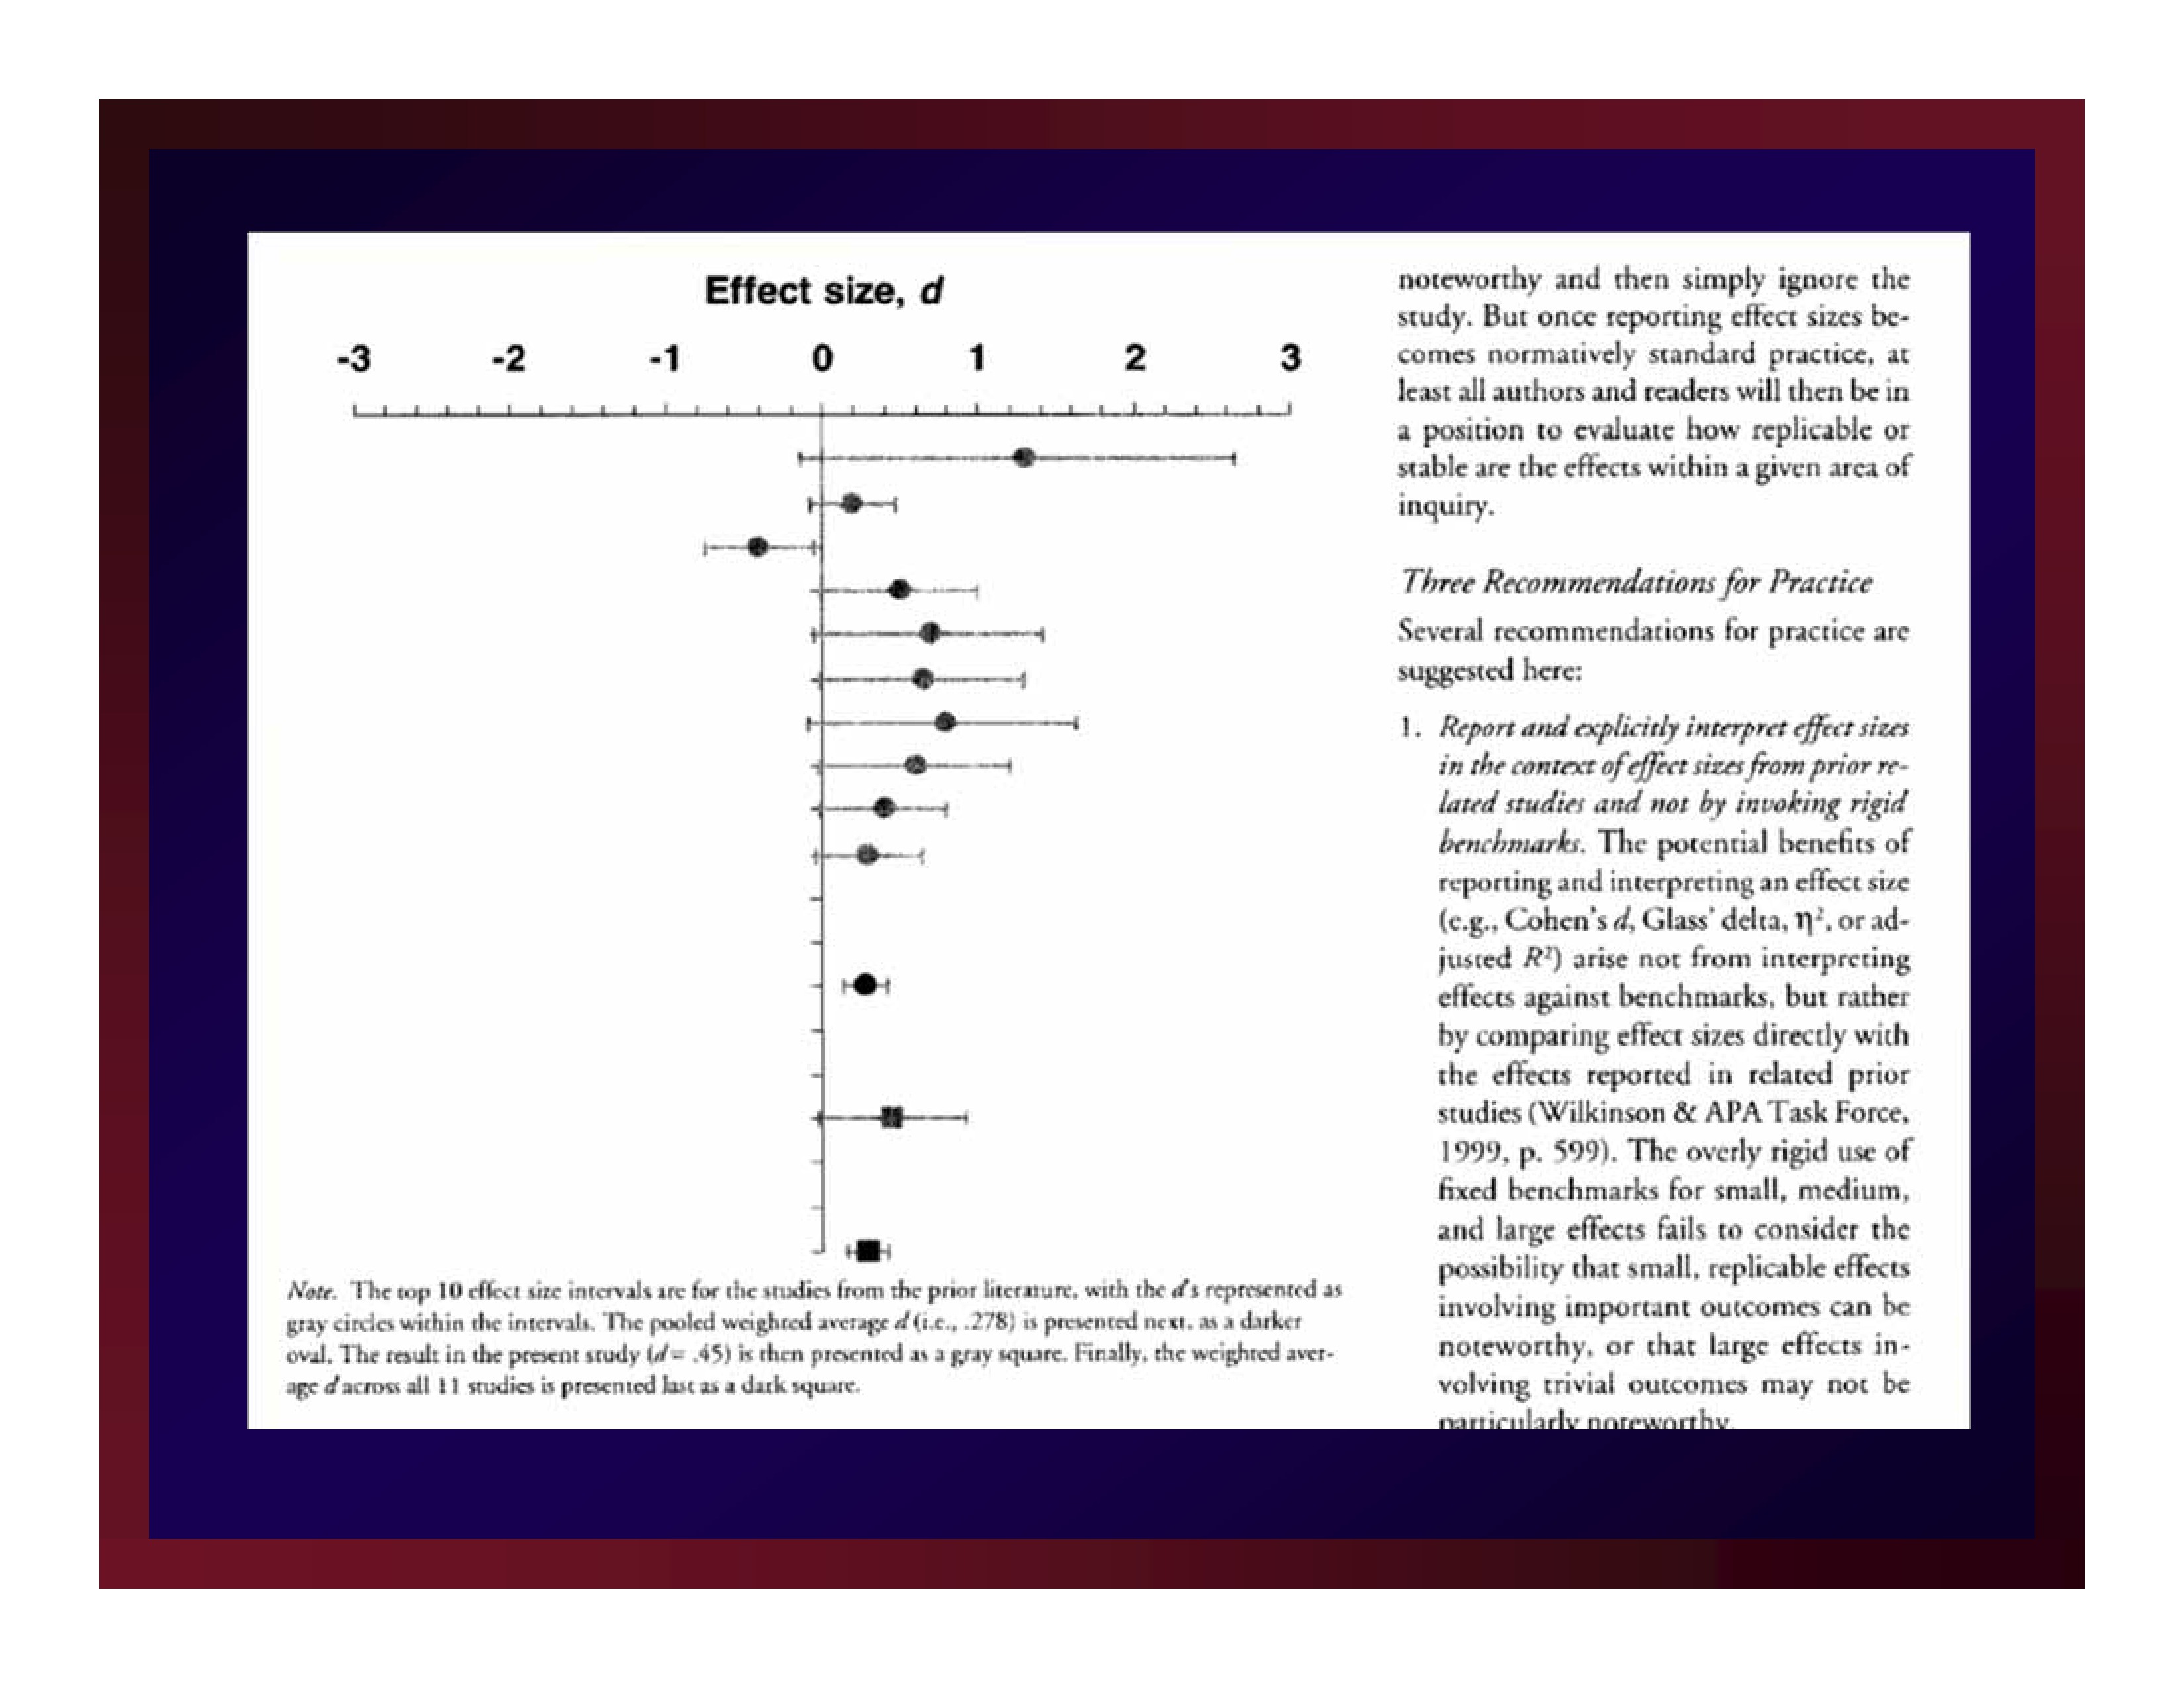
What is needed to assess meaningfulness are point and interval estimates of effect size.
However, graduating effect size as small (d=0.20), medium (d=0.50), and large (d=0.80) flirts with becoming a rigid and meaningless ritual.

The value of an estimate of effect size produced through a new experiment is found in its relationship to the estimates of effect size produced in the studies that justified the new experiment.
That is, just as the justification of an experiment is found in a focused set of existing studies, so too is the meaning of a new result uncovered in its relationship to the corresponding body of existing results.
All interpretations of effect size are local.
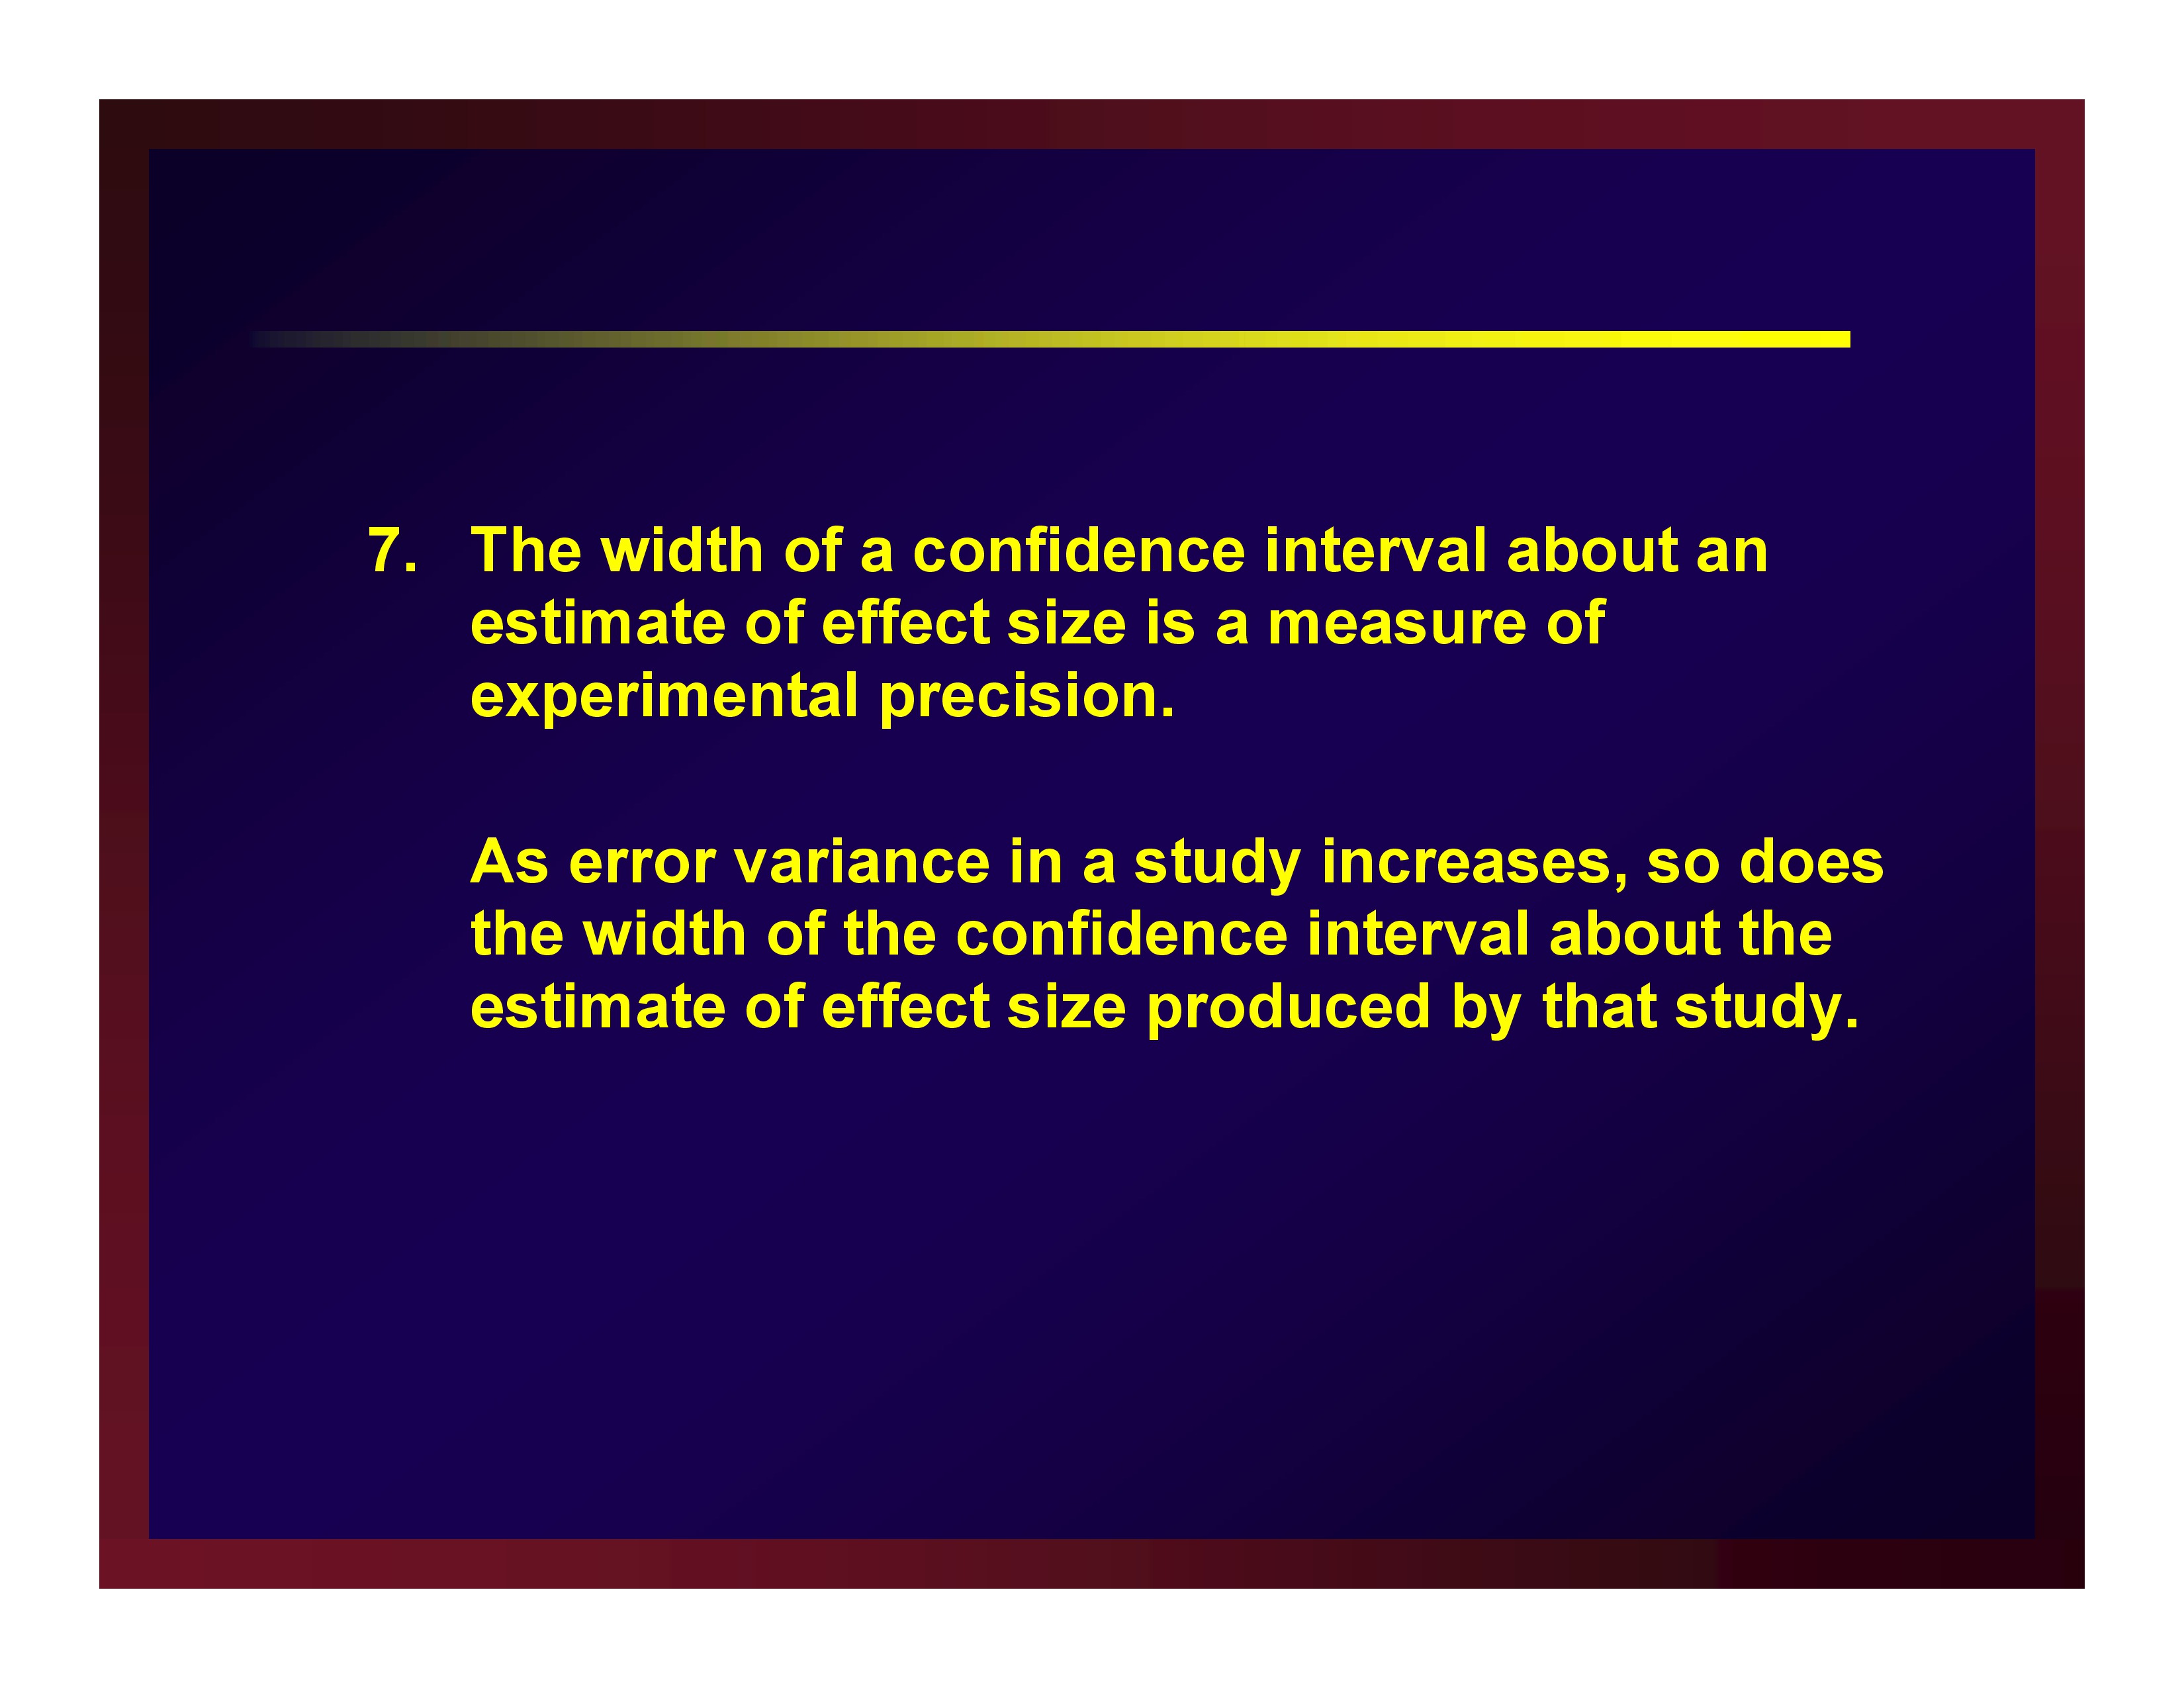
The width of a confidence interval about an estimate of effect size is a measure of experimental precision.
As error variance in a study increases, so does the width of the confidence interval about the estimate of effect size produced by that study.

Bruce Thompson (2002) figured this out quite a while ago.
Minimal Clinically Important Difference (MCID)
Man-Son-Hing, et al. (2002) advanced the notion that not every statistically significant difference (proportion, correlation, etc.) is important.
Although the units-of-measure for Man-Son-Hing, et al. were descriptive statistics (rather than estimates of effect size), they also understood that all interpretations of experimental results are local.

On the basis of existing literature, a researcher must determine a criterion that a new result must exceed to be considered clinically significant: MCID
Adapting Man-Son-Hing, et al. by making the leap from mean differences to differences in effect sizes renders MCID practicable.


Three different examples of MCID
- No intervention is available for a certain debilitating condition.Any improvement, no matter how small relative to a no-treatment control, represents an important advancement in managing the condition. In this case, obtaining a value of say d ≥ .10 could very well constitute an important difference.
- An intervention protocol is broadly recognized as a clinical standard for care and is known to effect a level of change corresponding to an average effect size of d = .80 (i.e., an average effect size in comparison with no-treatment control studies).A new technology is introduced as an alternate form of care but only at substantial cost in making the change from one technology to another. The cost is deemed worthwhile if the new technology improves outcomes by at least 25%. All other things remaining constant, an outcome of d ≥ .20 is an important one in an ANCOVA of data obtained through a parallel-groups design contrasting the new technology and the old technology.
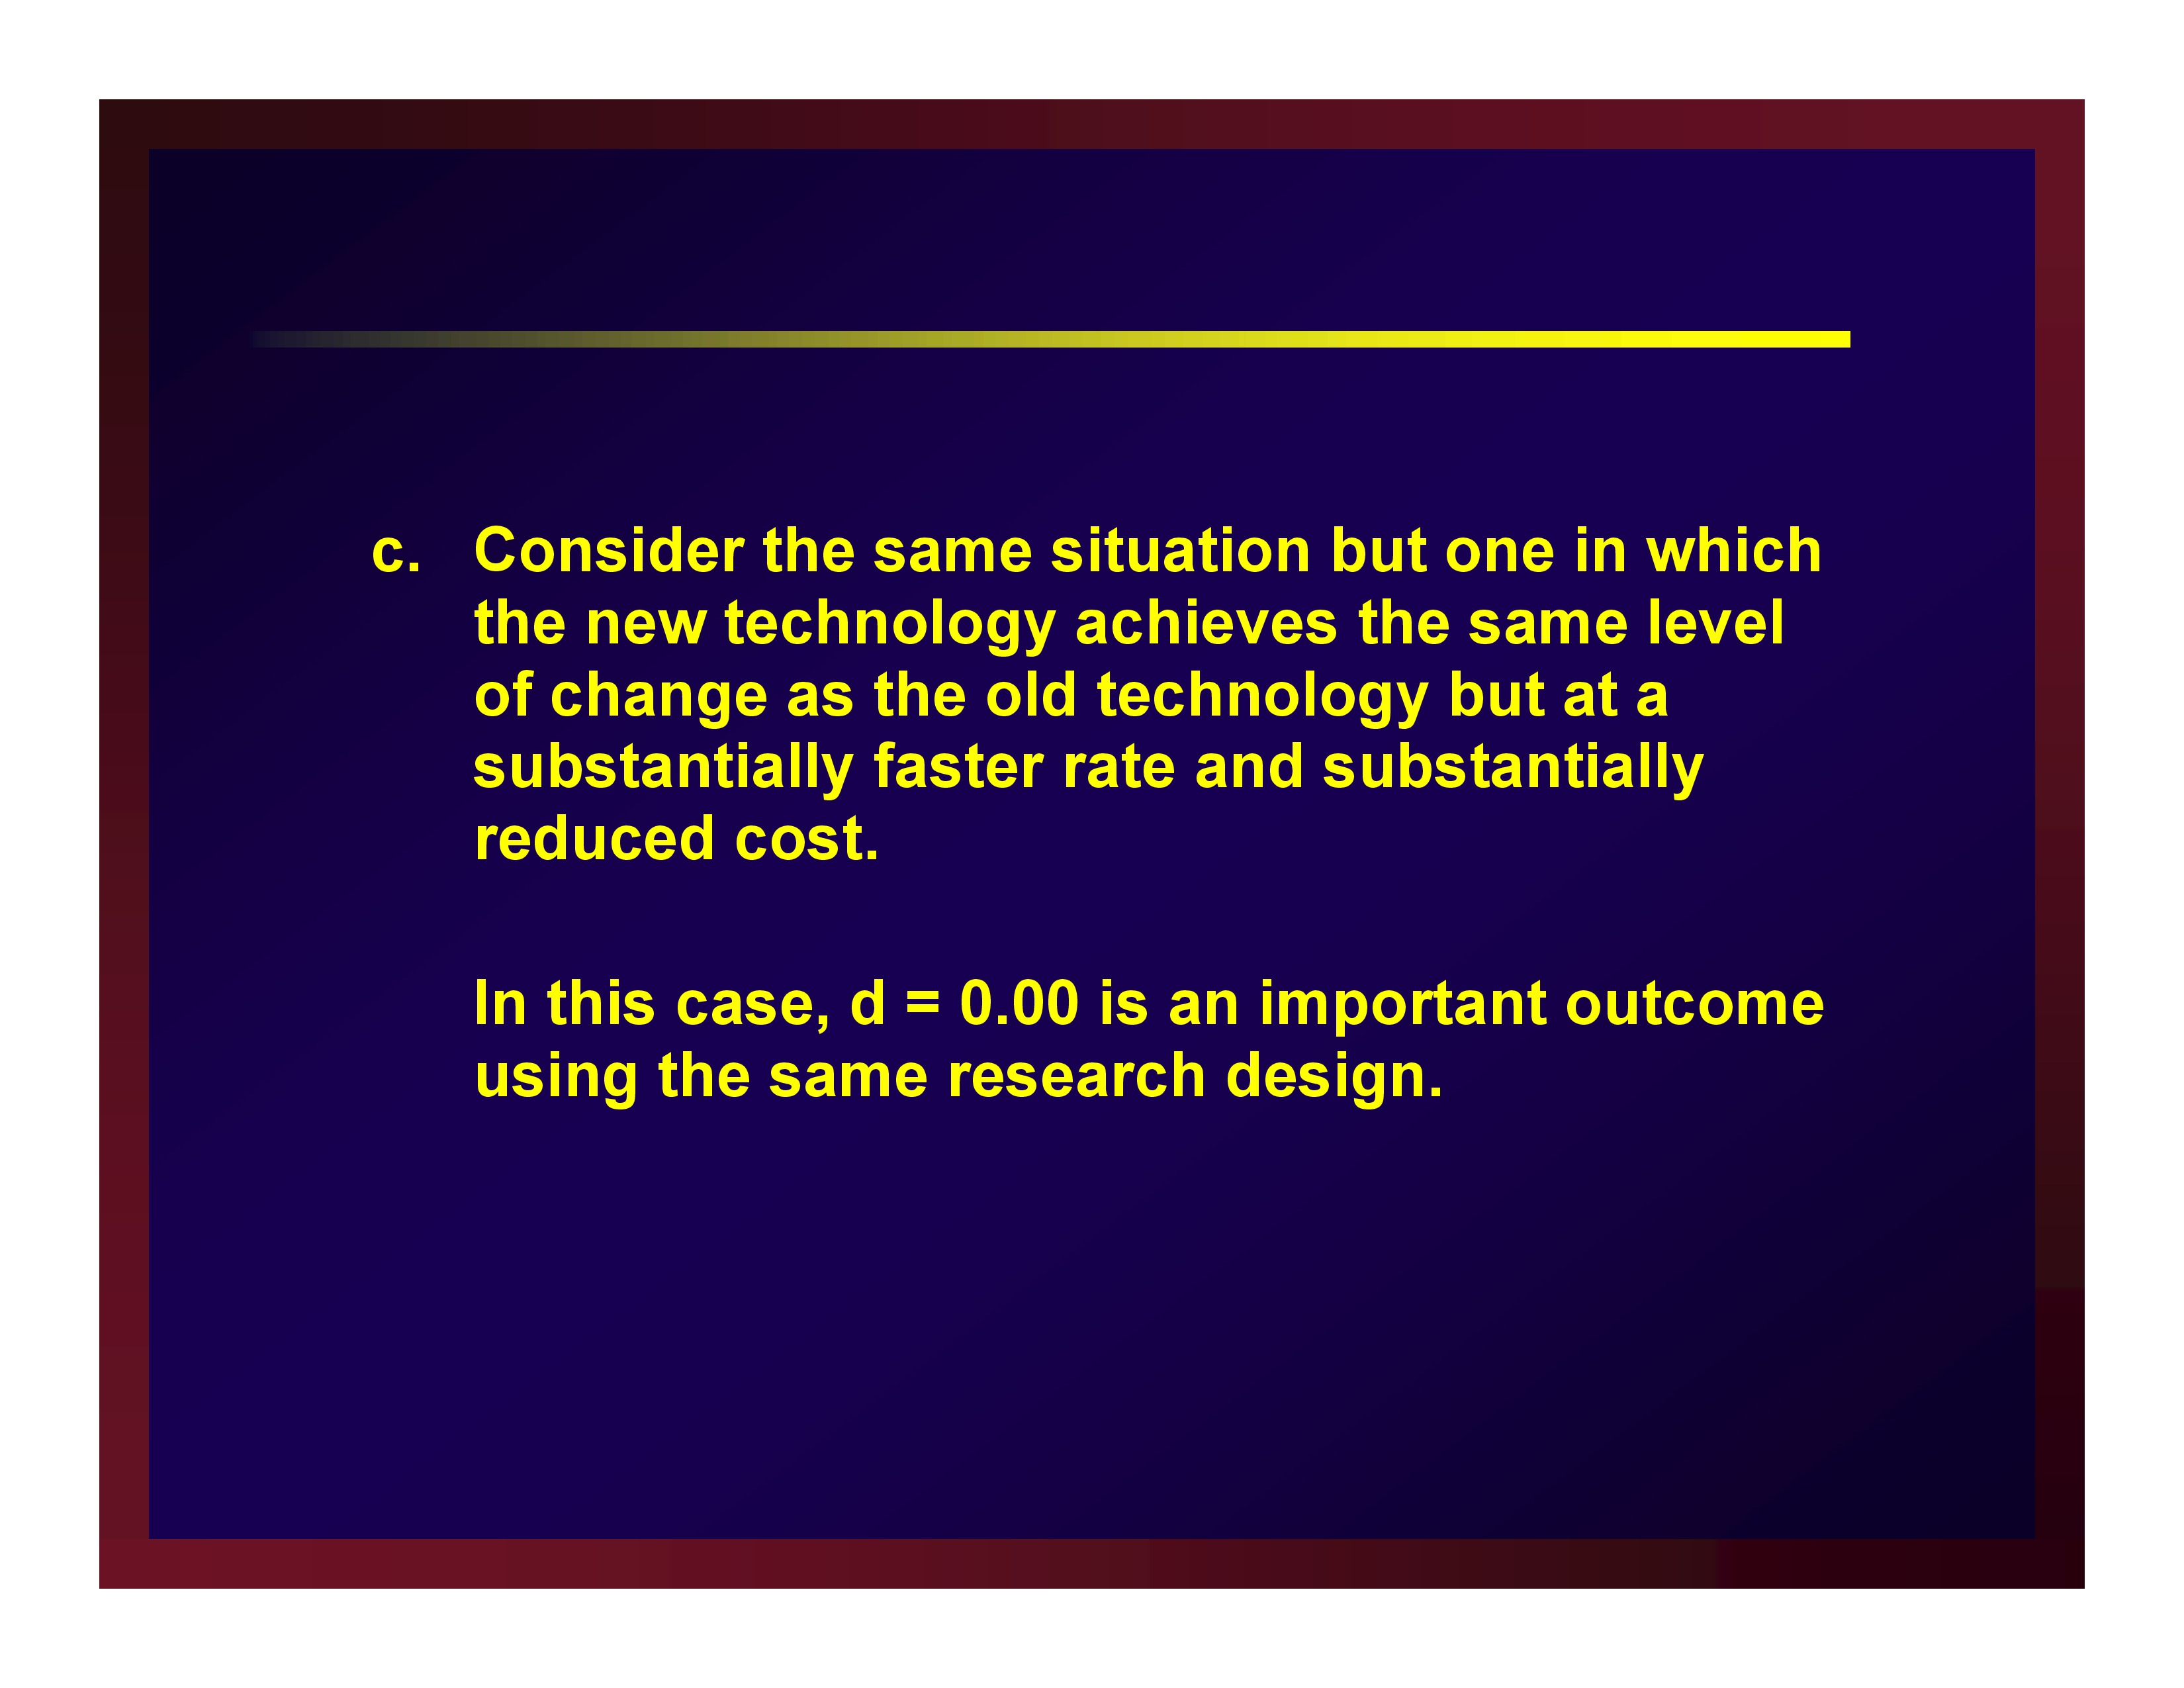
- Consider the same situation but one in which the new technology achieves the same level of change as the old technology but at a substantially faster rate and substantially reduced cost.In this case, d = 0.00 is an important outcome using the same research design. That is, the new technology achieves the same outcome as the standard but in less time and at less cost. The analysis in this case would be supplemented with equivalency testing.
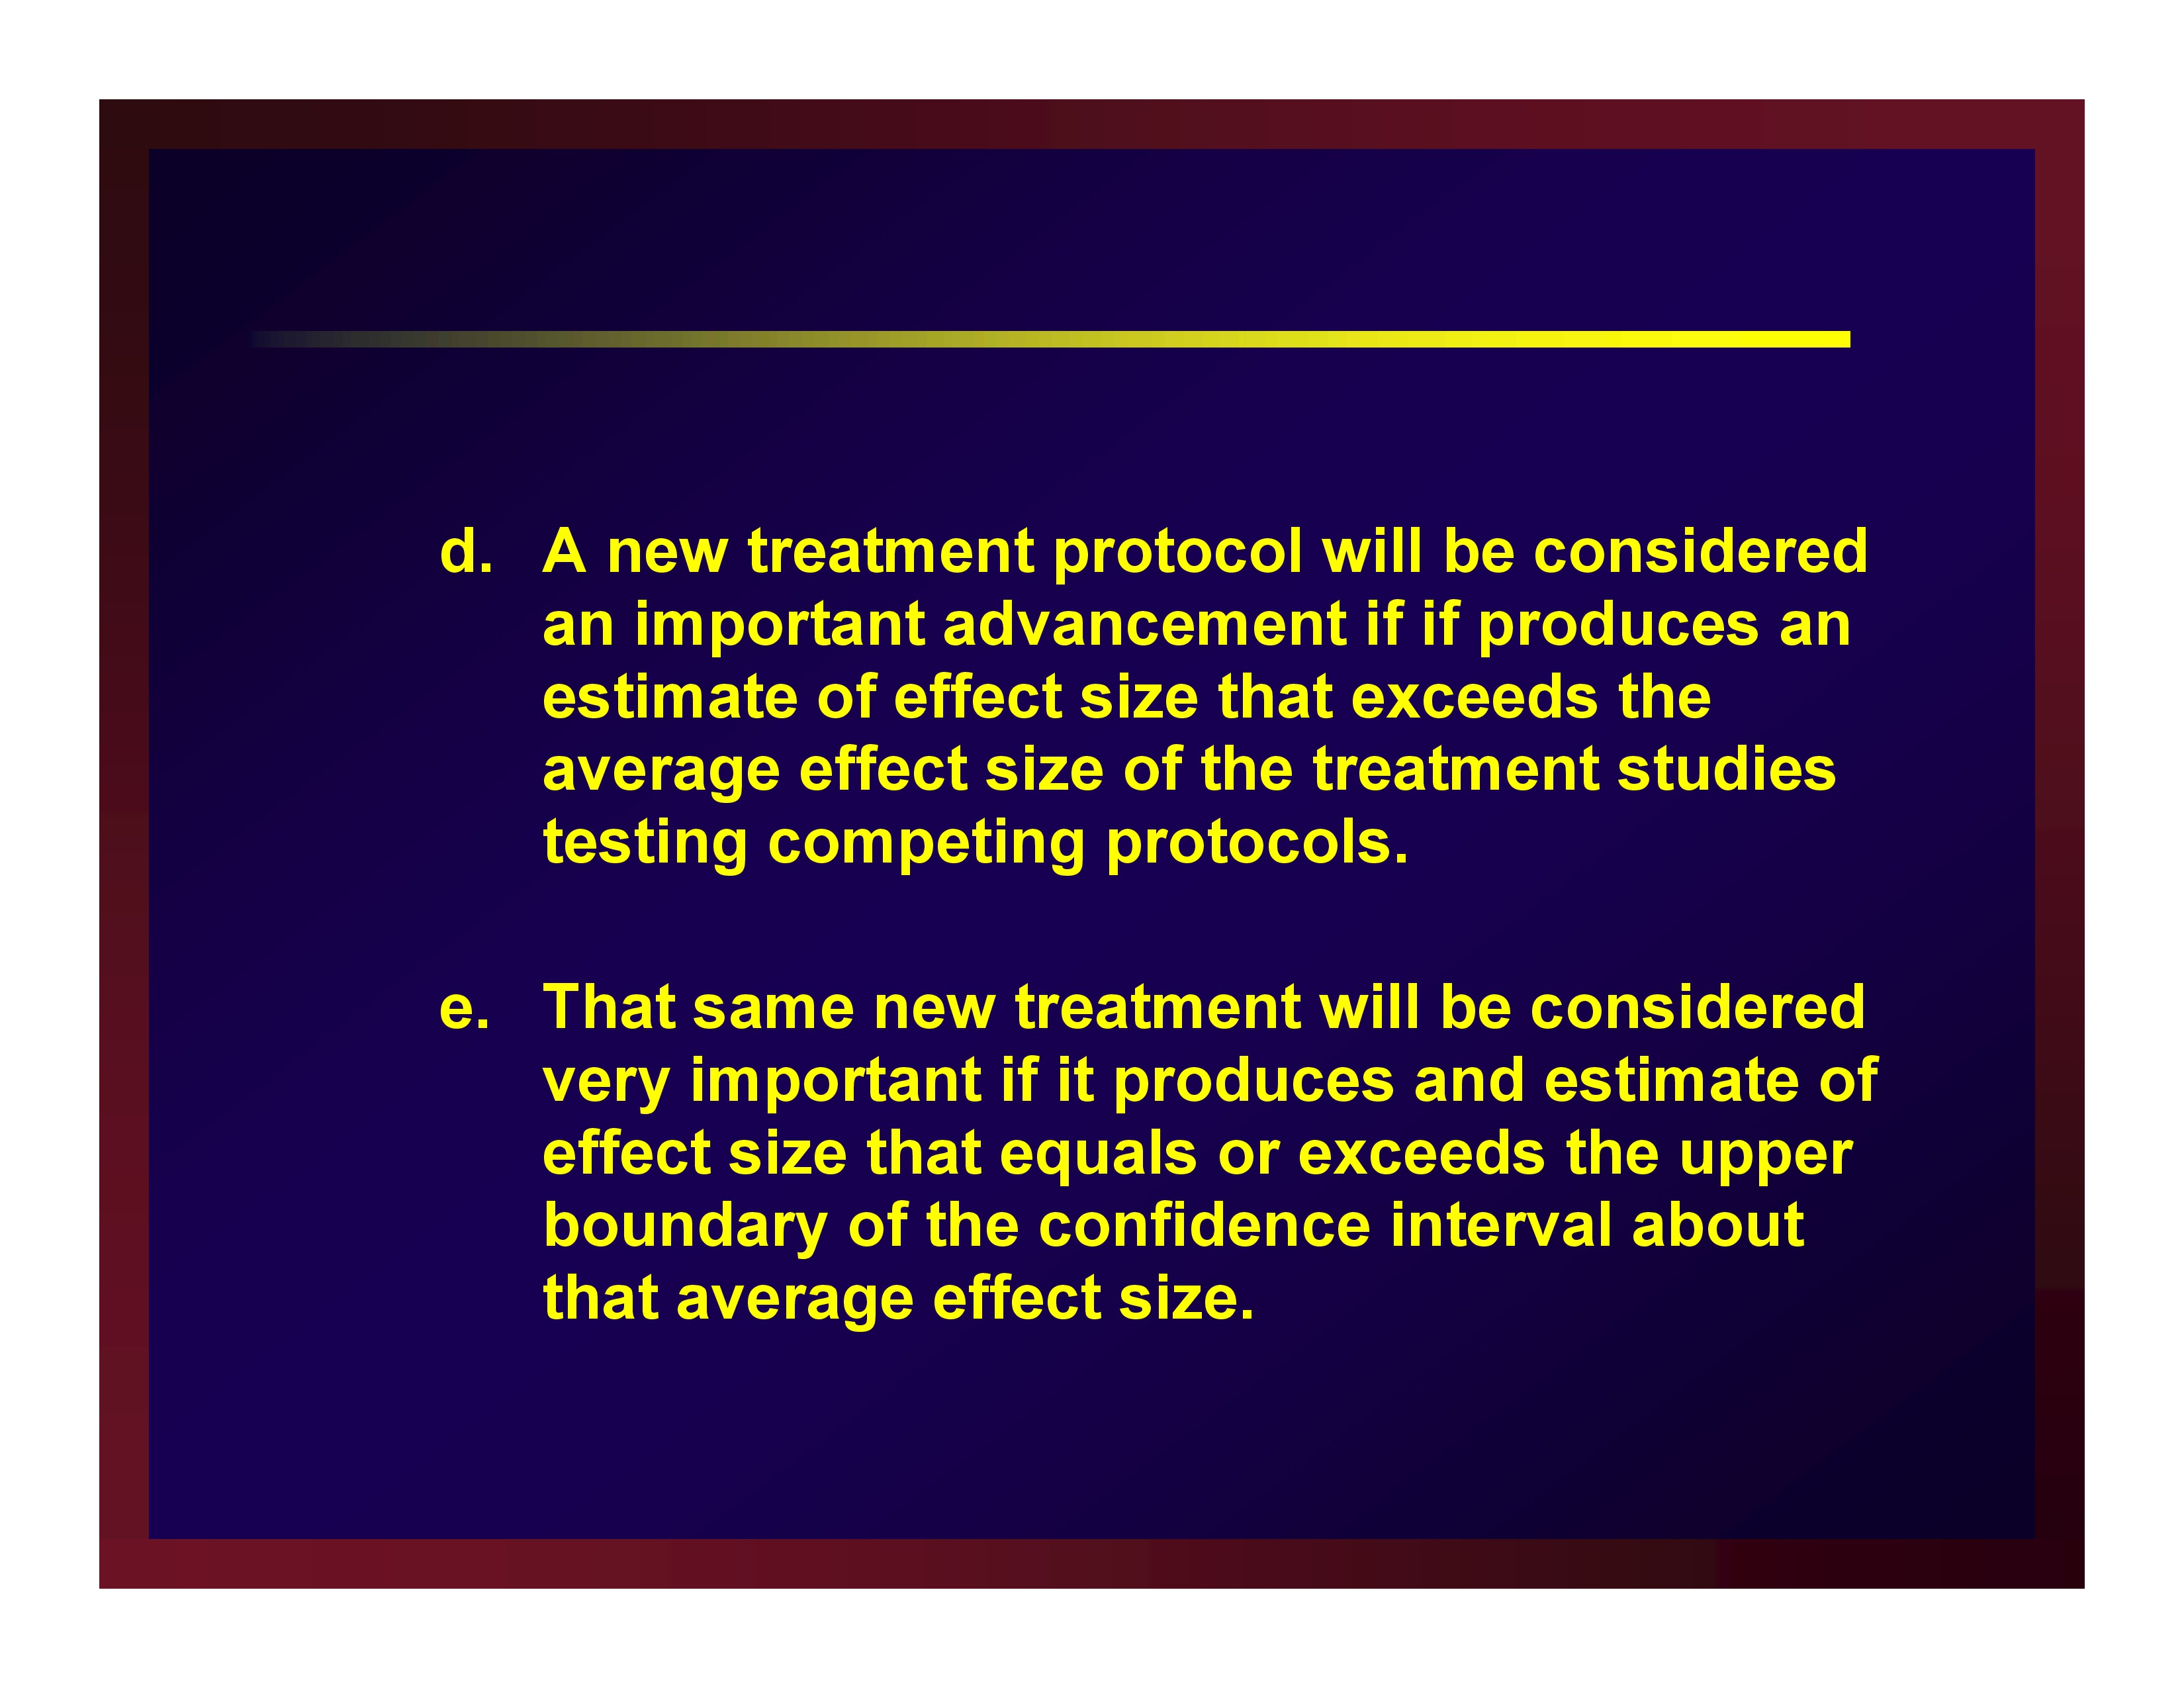
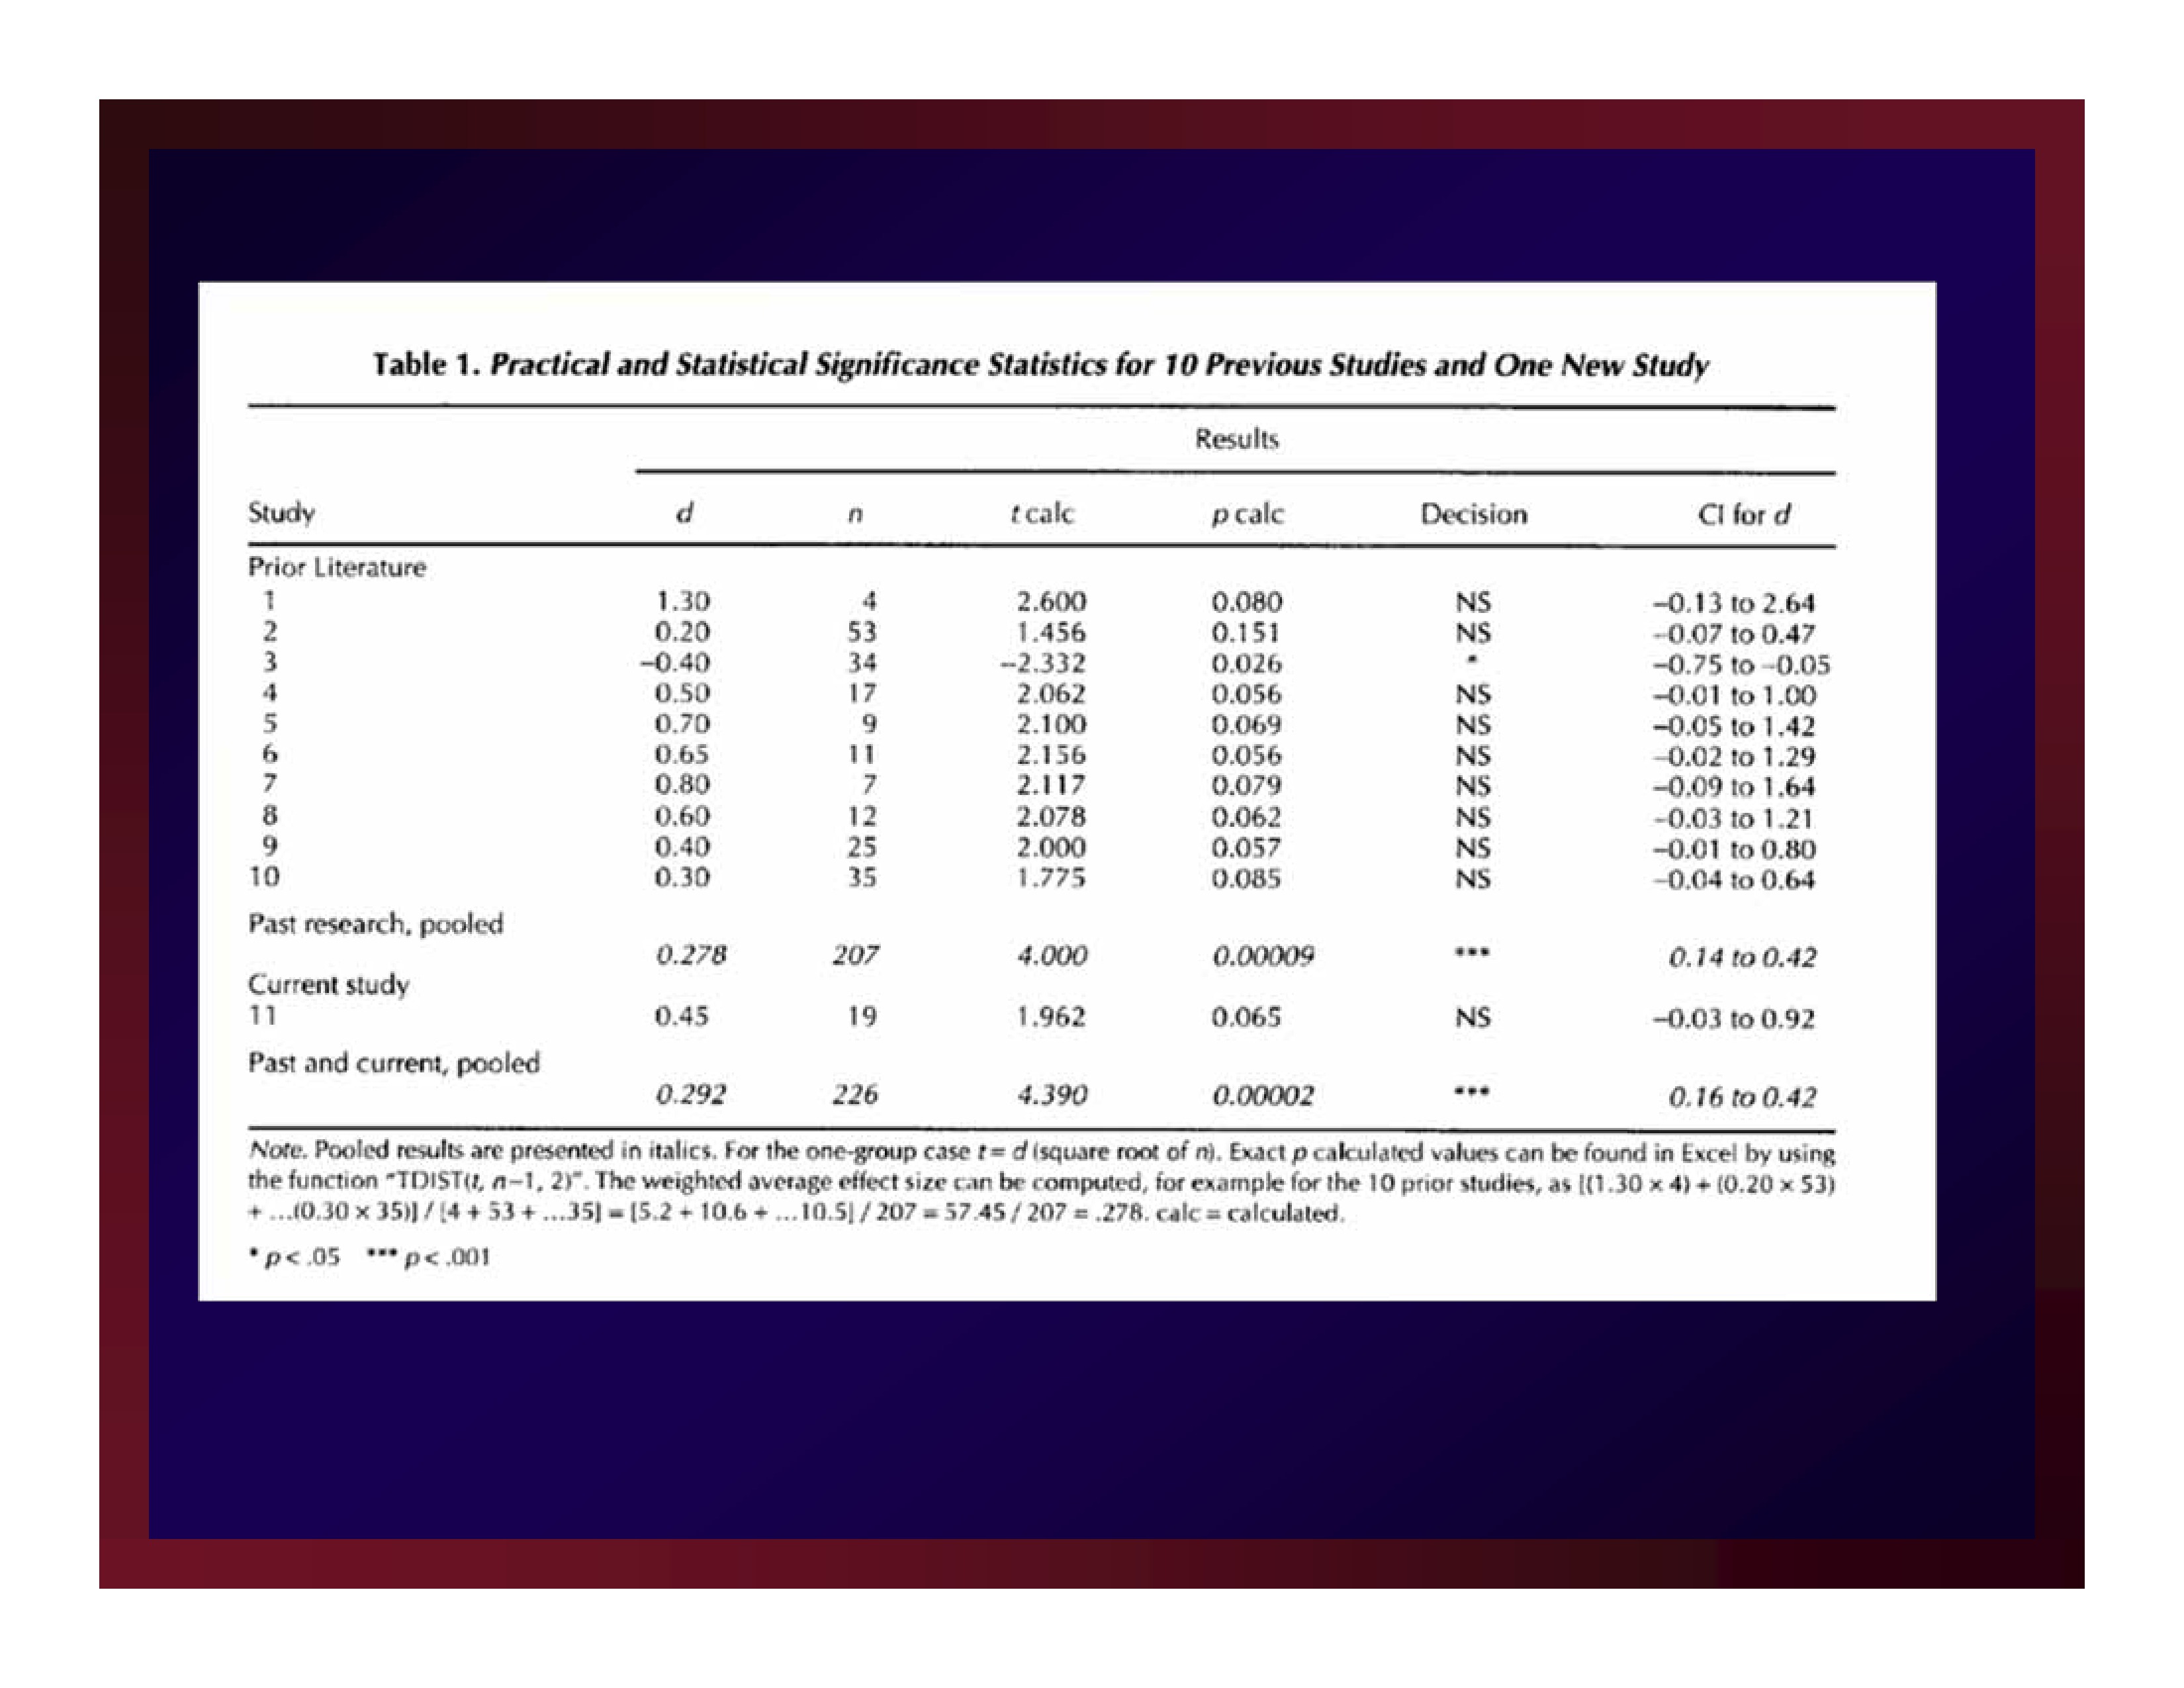
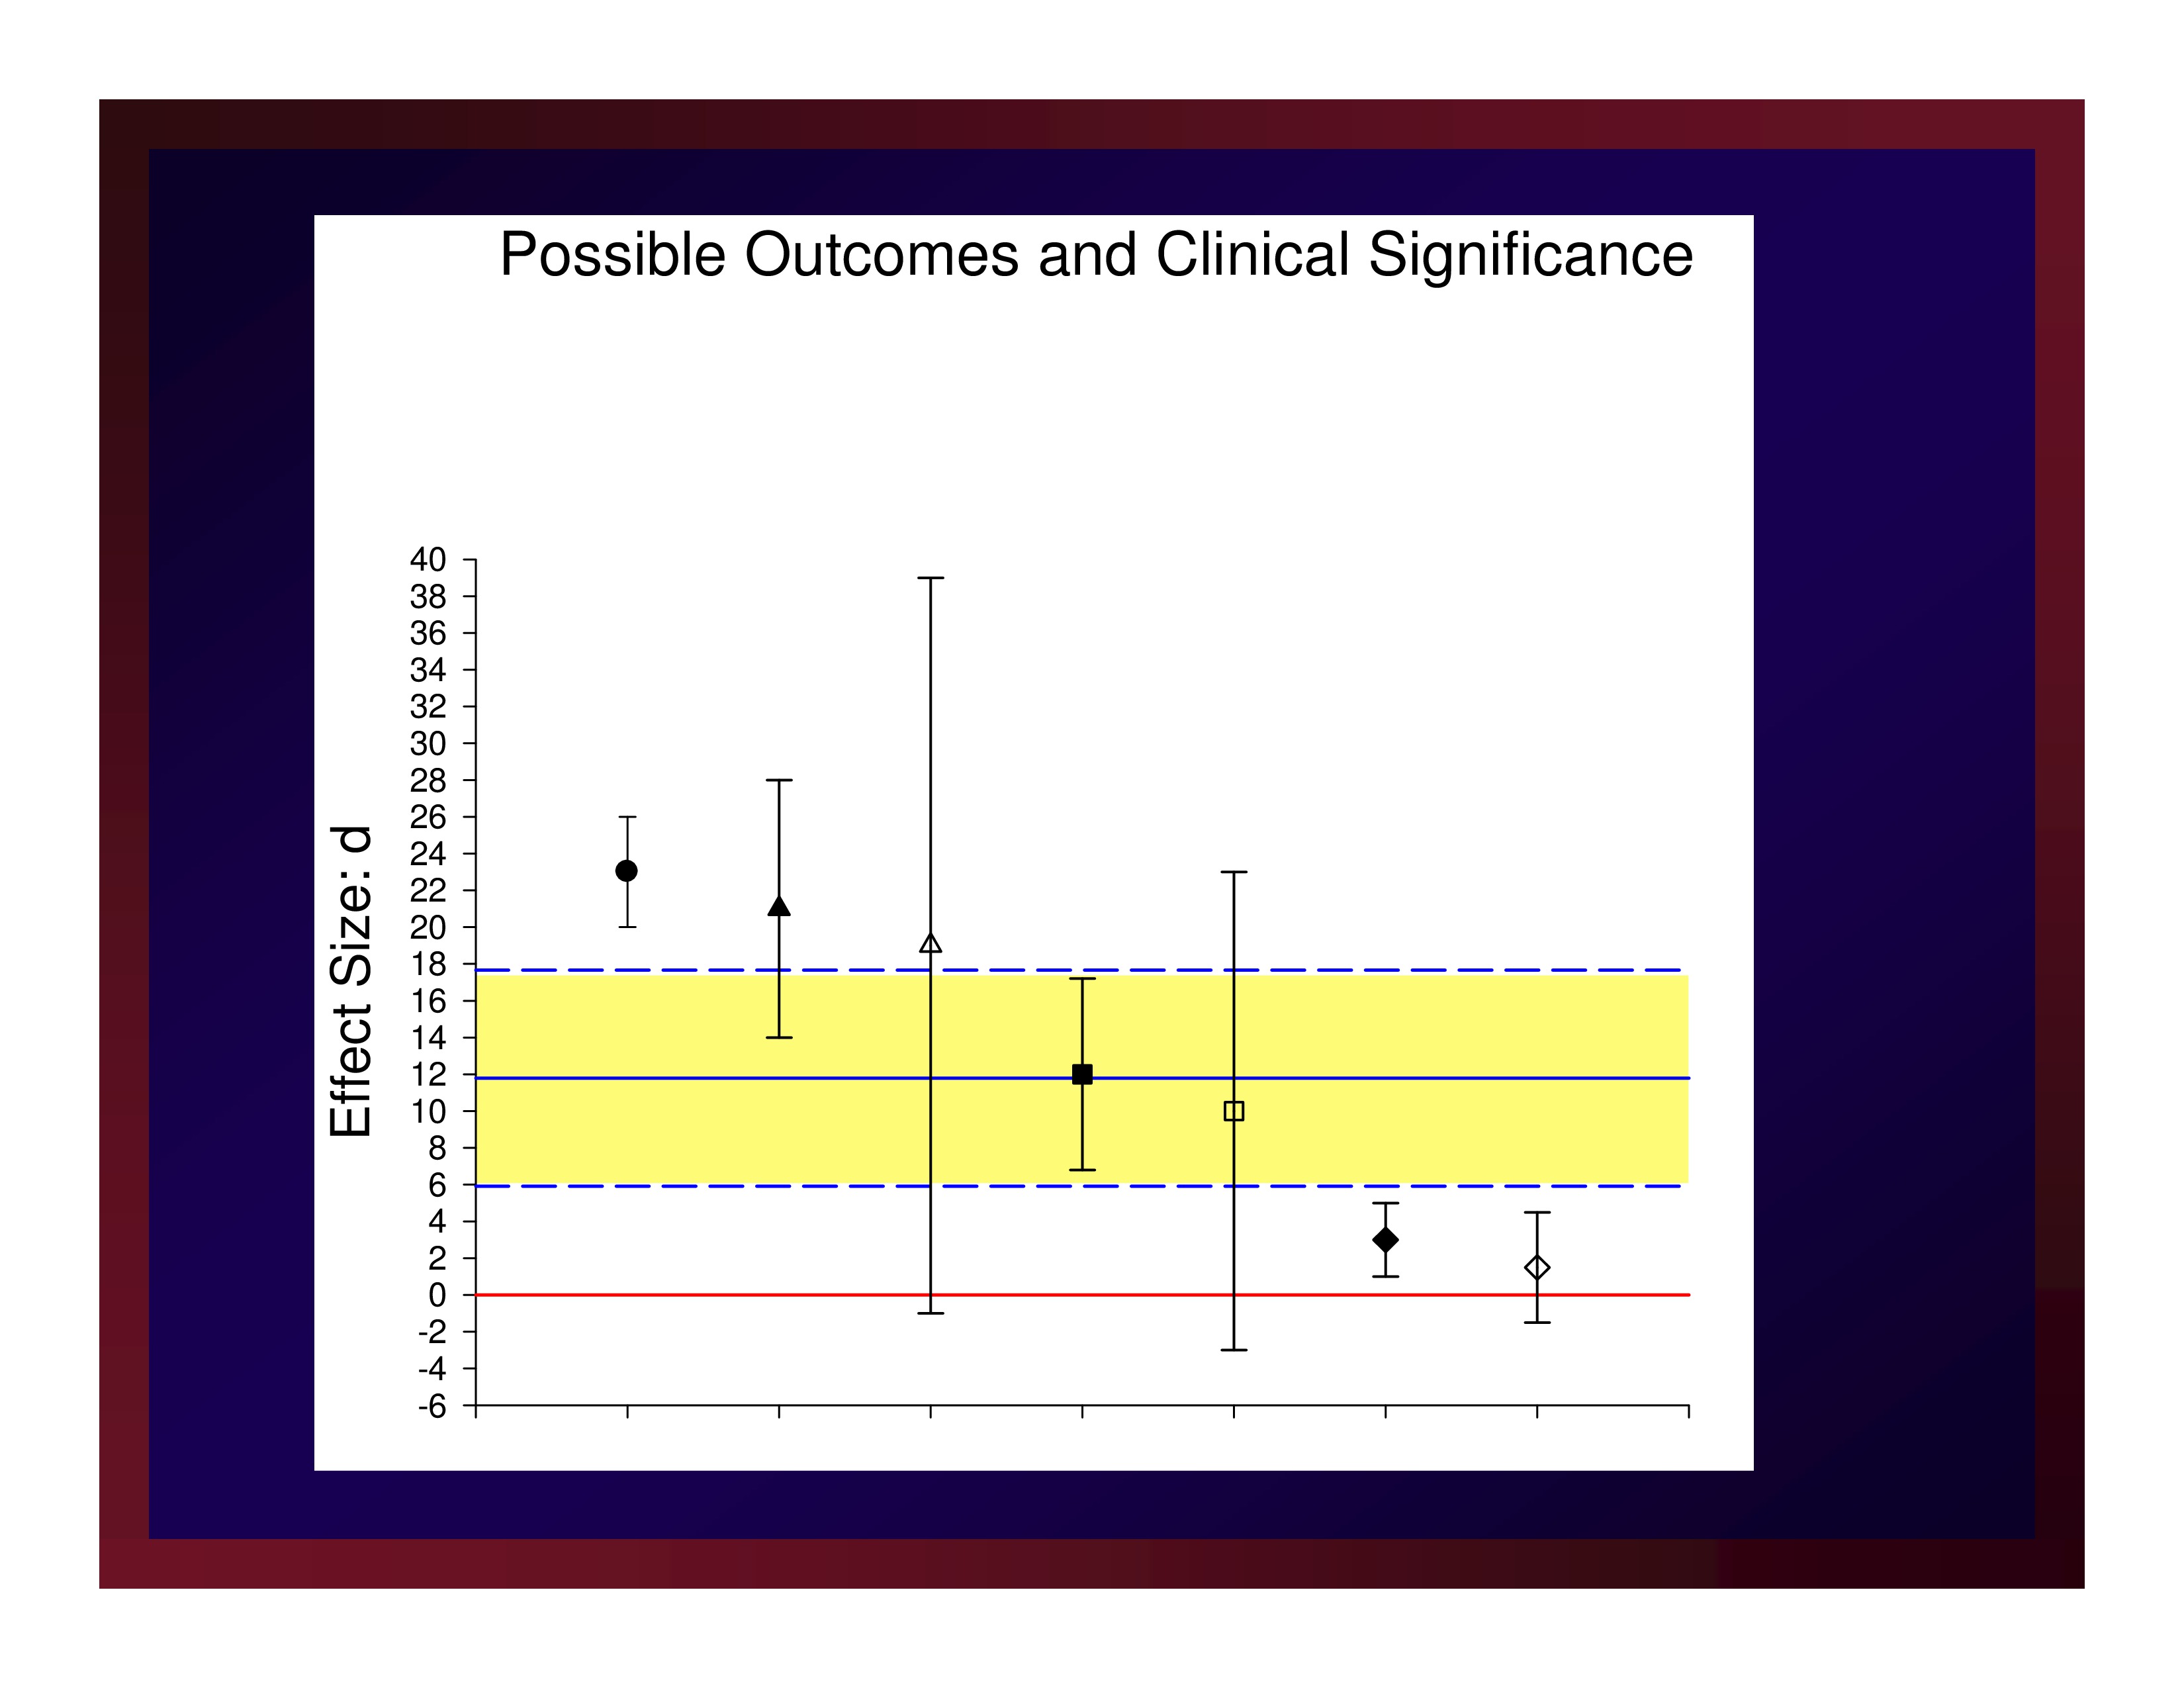
A new treatment protocol will be considered an important advancement if it produces an estimate of effect size that exceeds the average effect size of the treatment studies testing competing protocols.
That same new treatment will be considered very important if it produces and estimate of effect size that equals or exceeds the upper boundary of the confidence interval about that average effect size.
Example
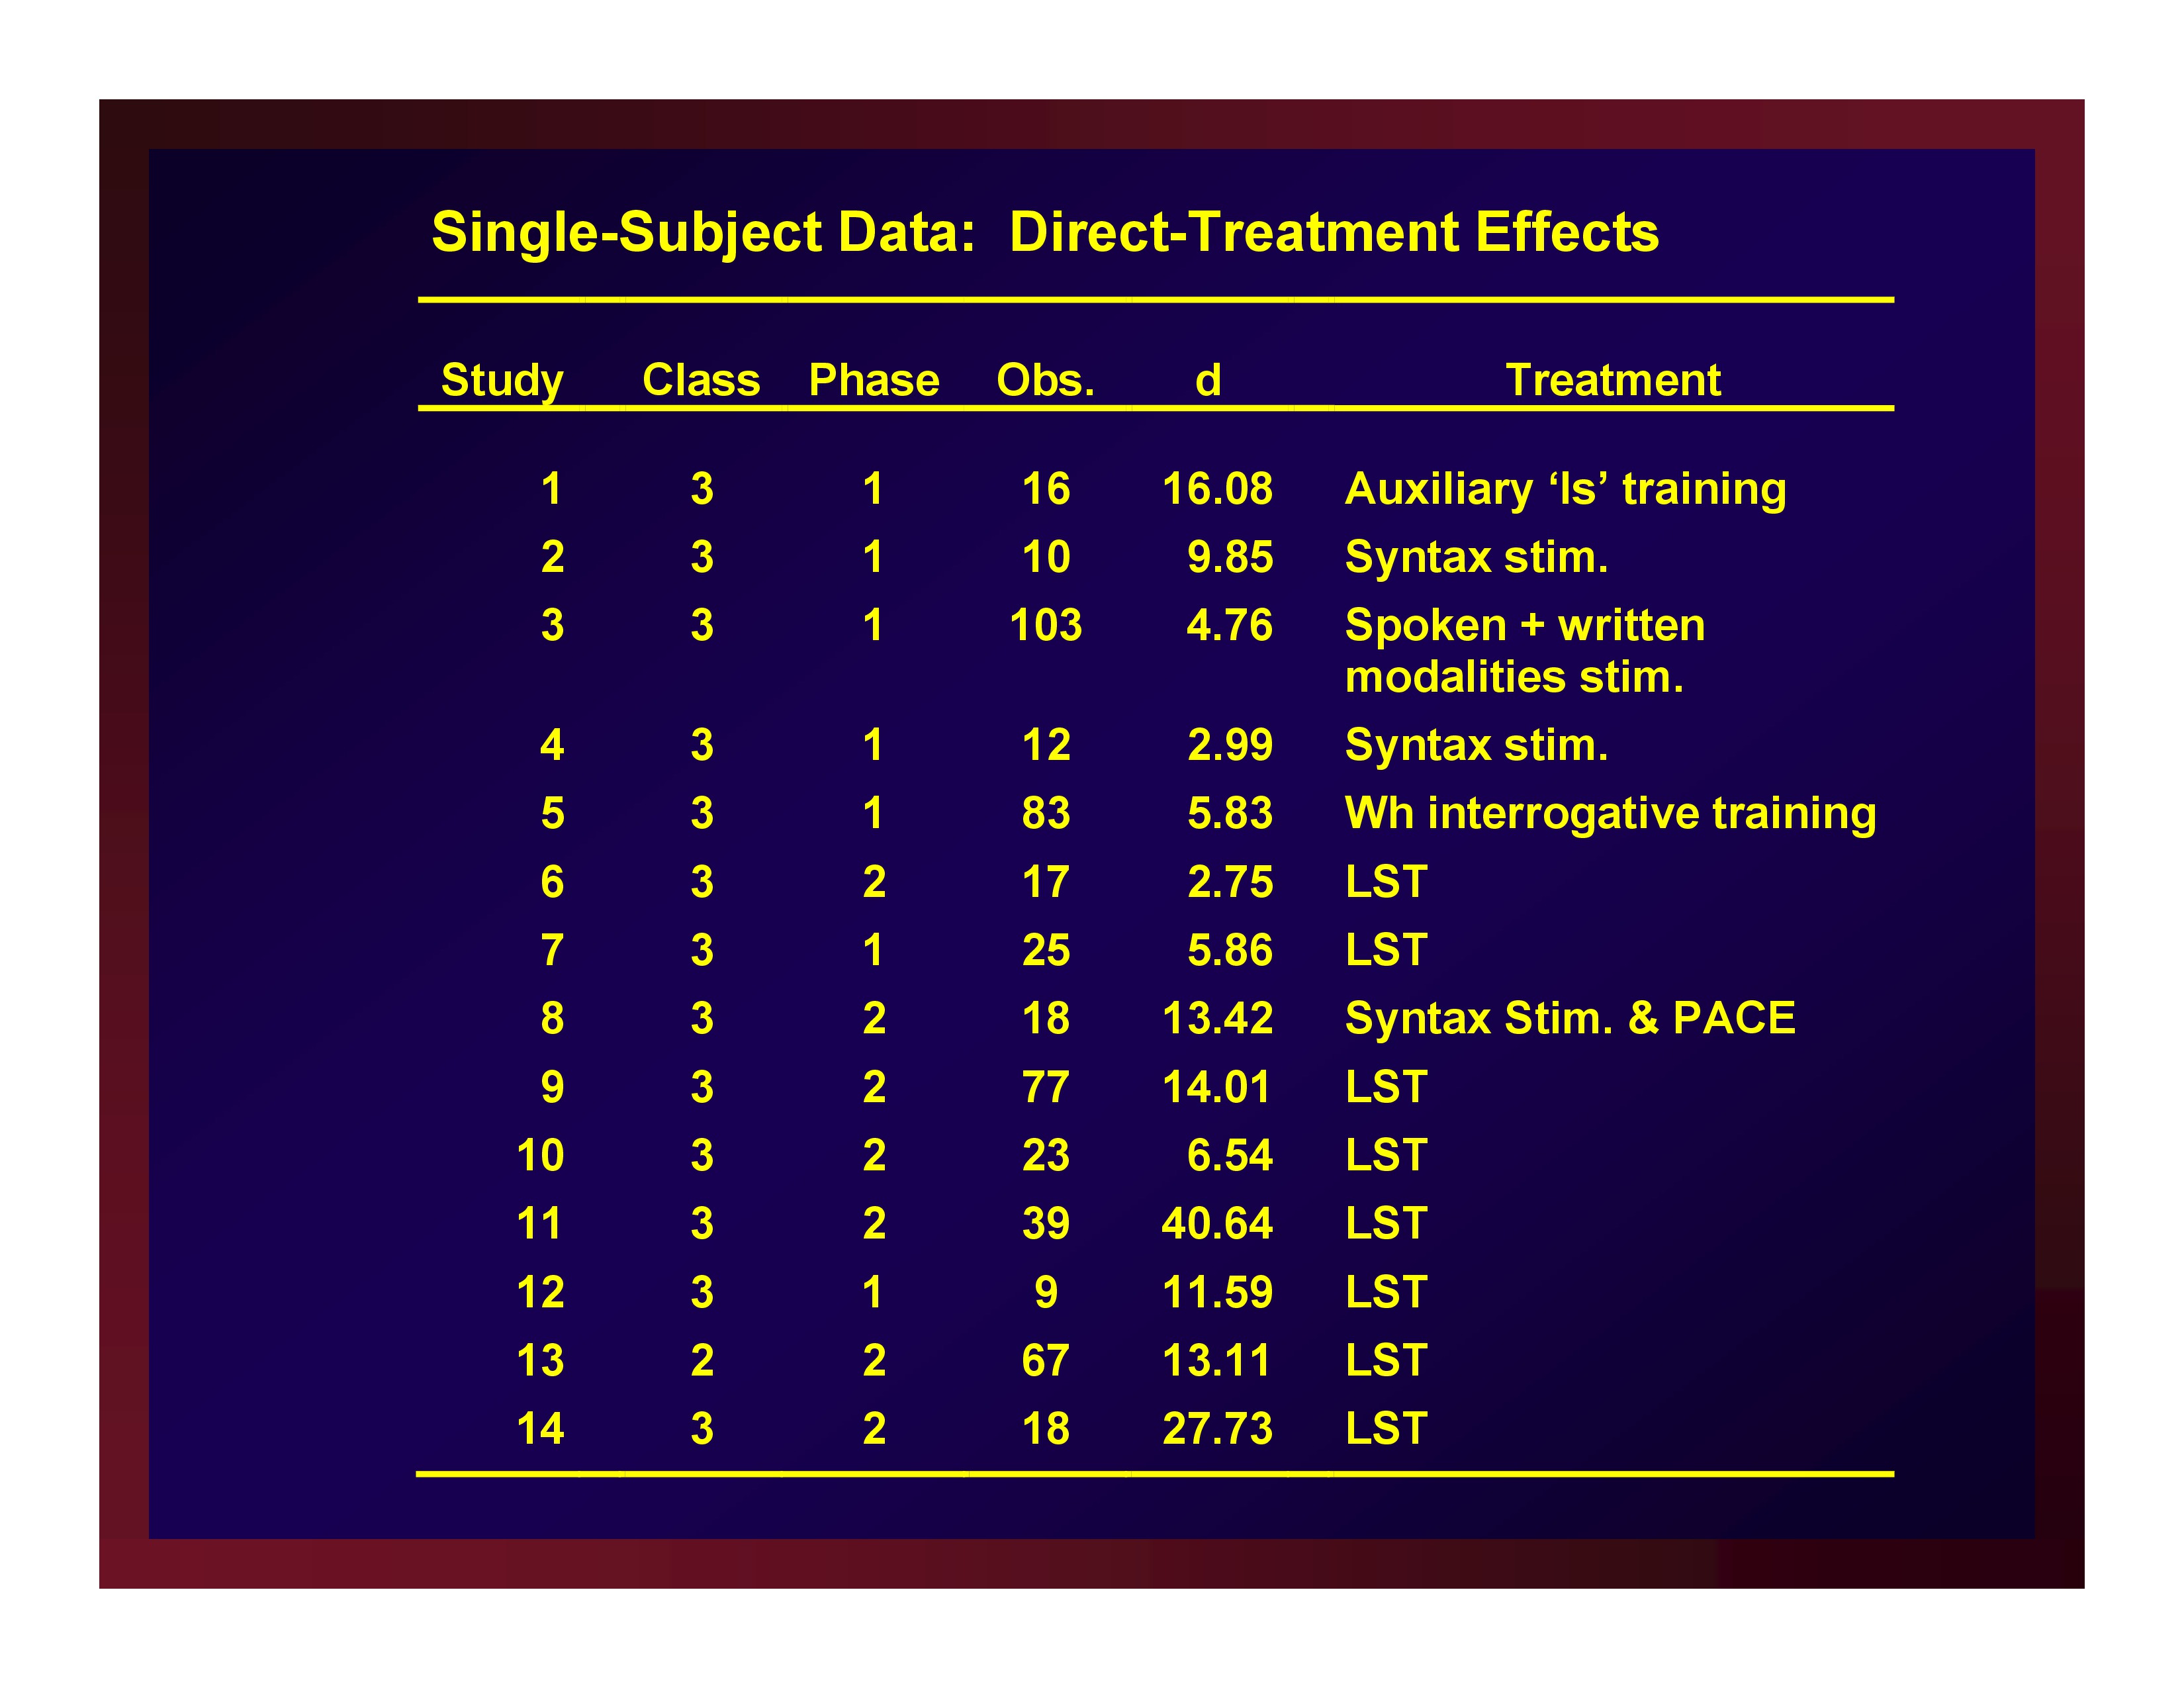
Single-Subject Data: Direct-Treatment Effects
Single-Subject Data: Direct-Treatment Effects
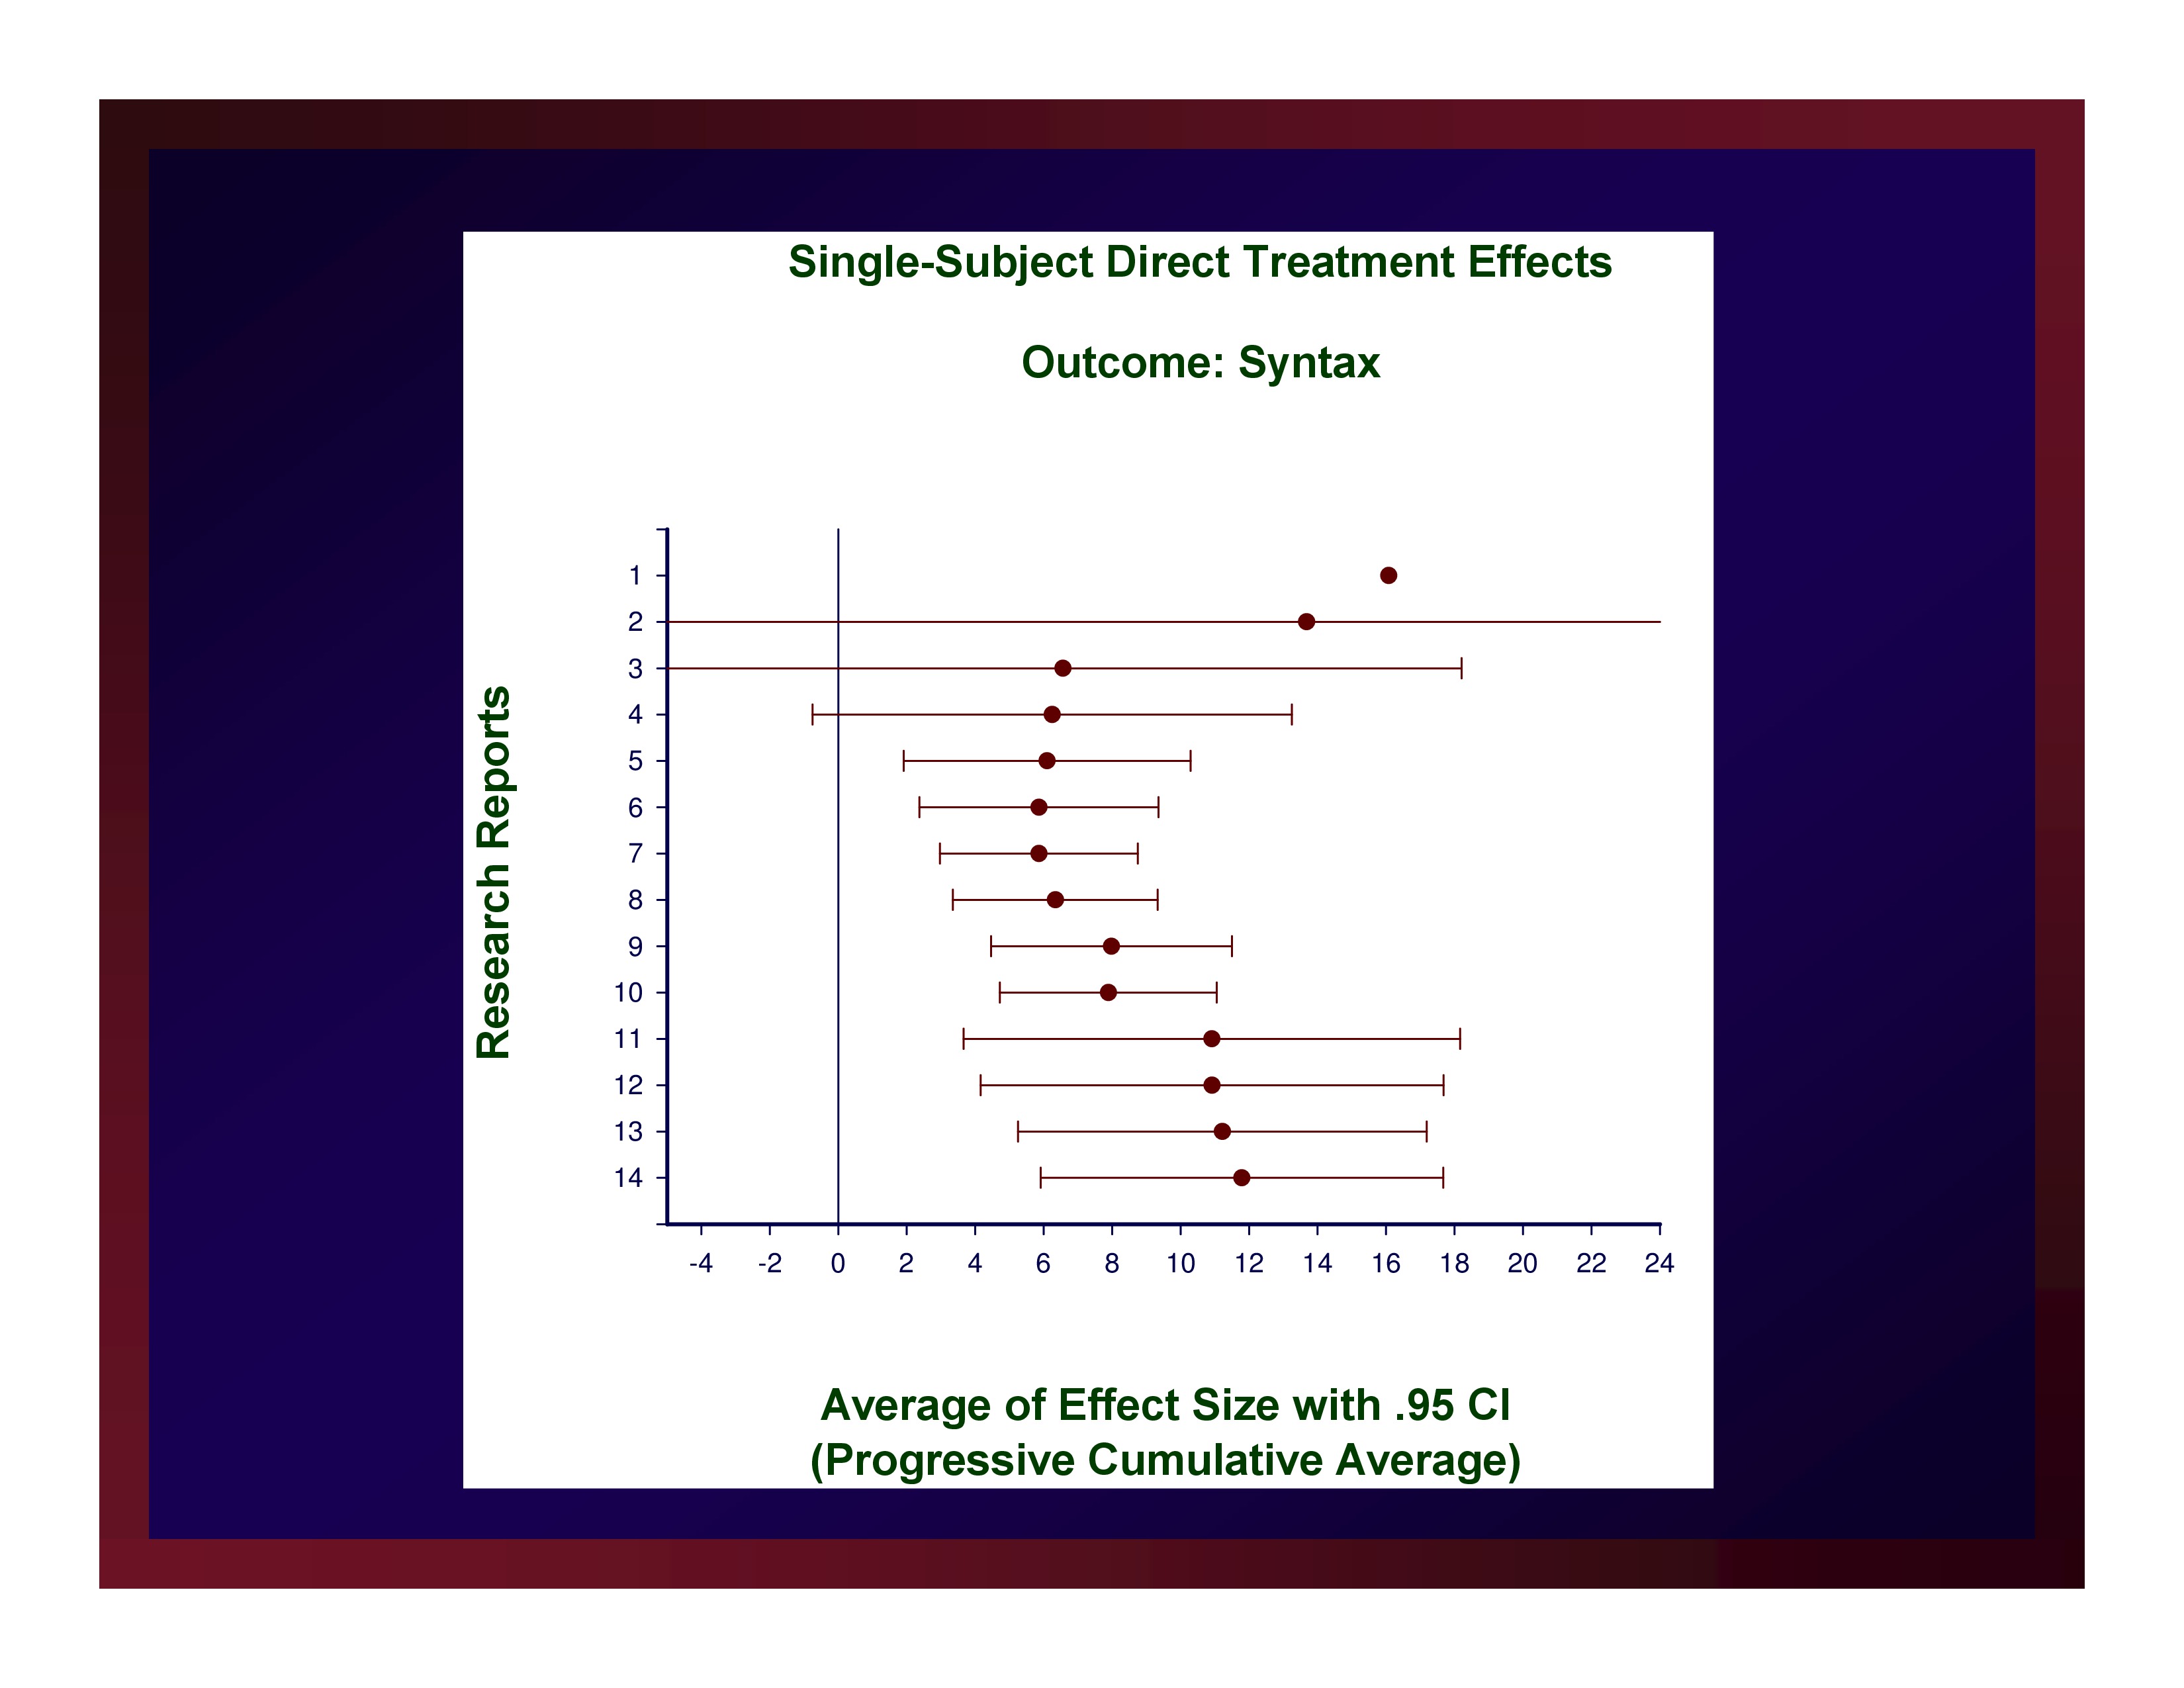
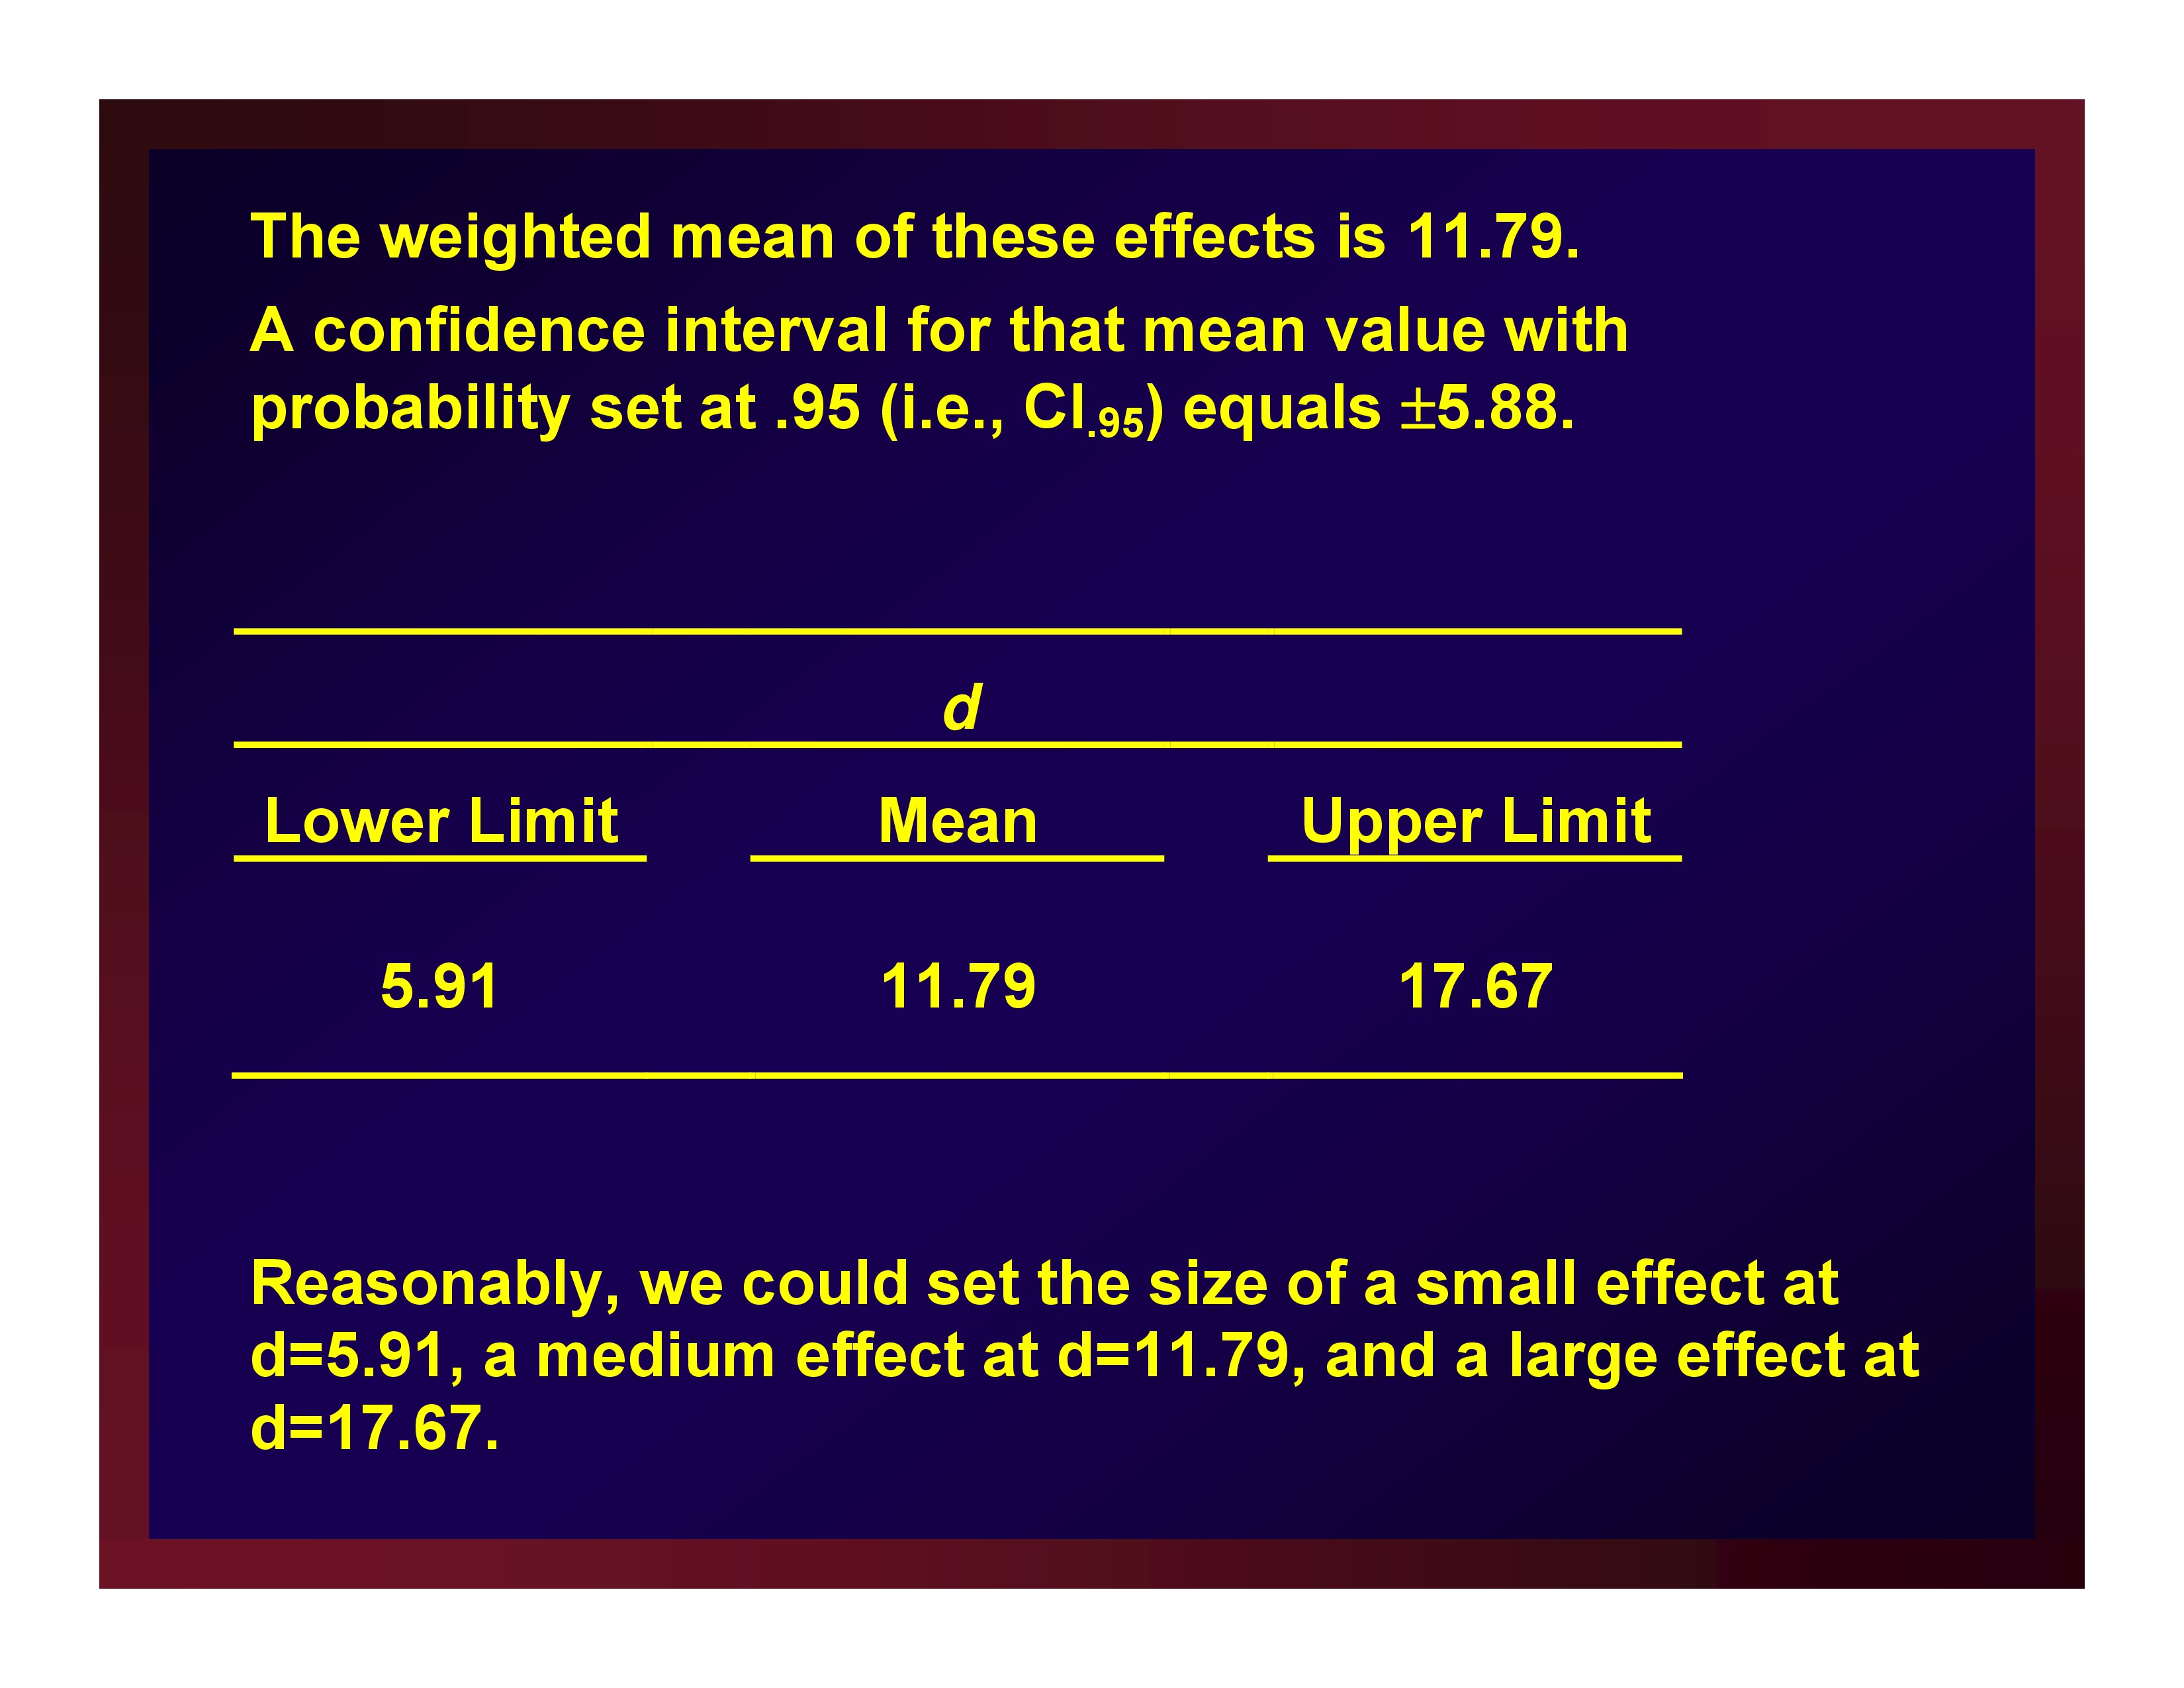
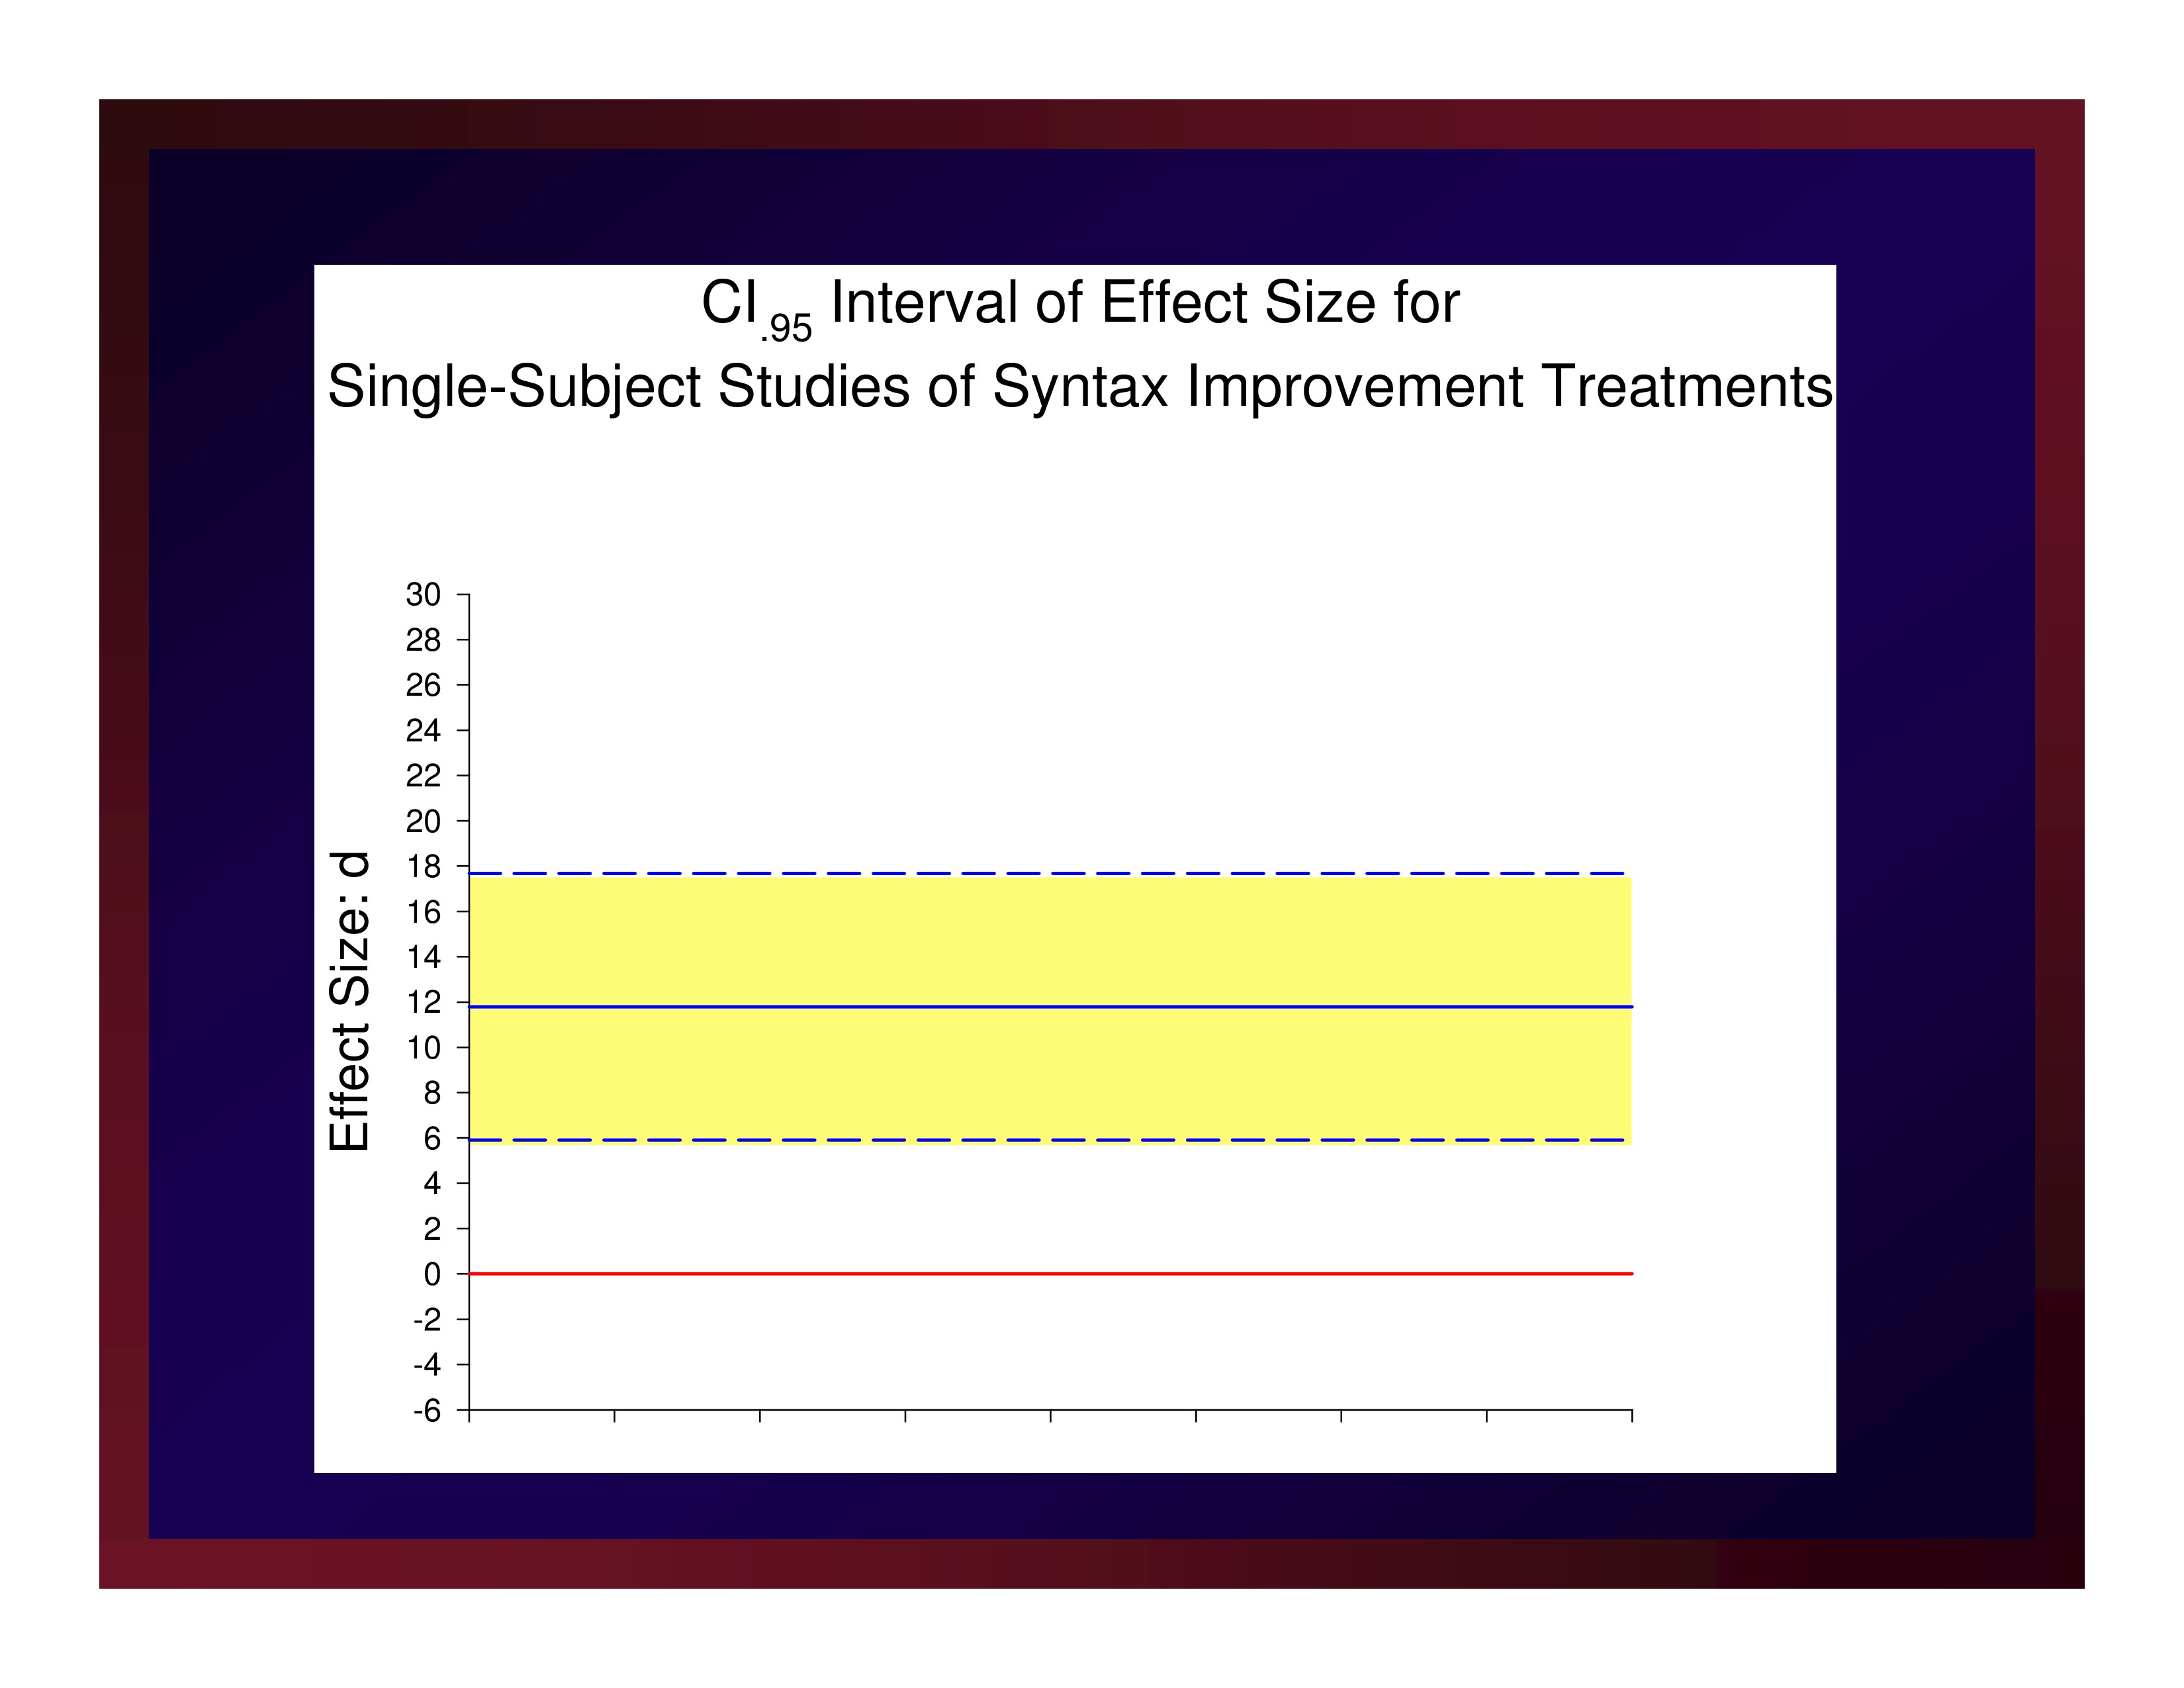
The weighted mean of these effects is 11.79. A confidence interval for that mean value with probability set at .95 (i.e., CI.95) equals ±5.88.
Reasonably, we could set the size of a small effect at d=5.91, a medium effect at d=11.79, and a large effect at d=17.67.
CI.95 Interval of Effect Size
Possible Outcomes and Clinical Significance
 How do I obtain values for this mini meta-analysis?
If a meta-analysis has been published in your target literature, you’re golden.
If not, work with your statistician to obtain what you need.
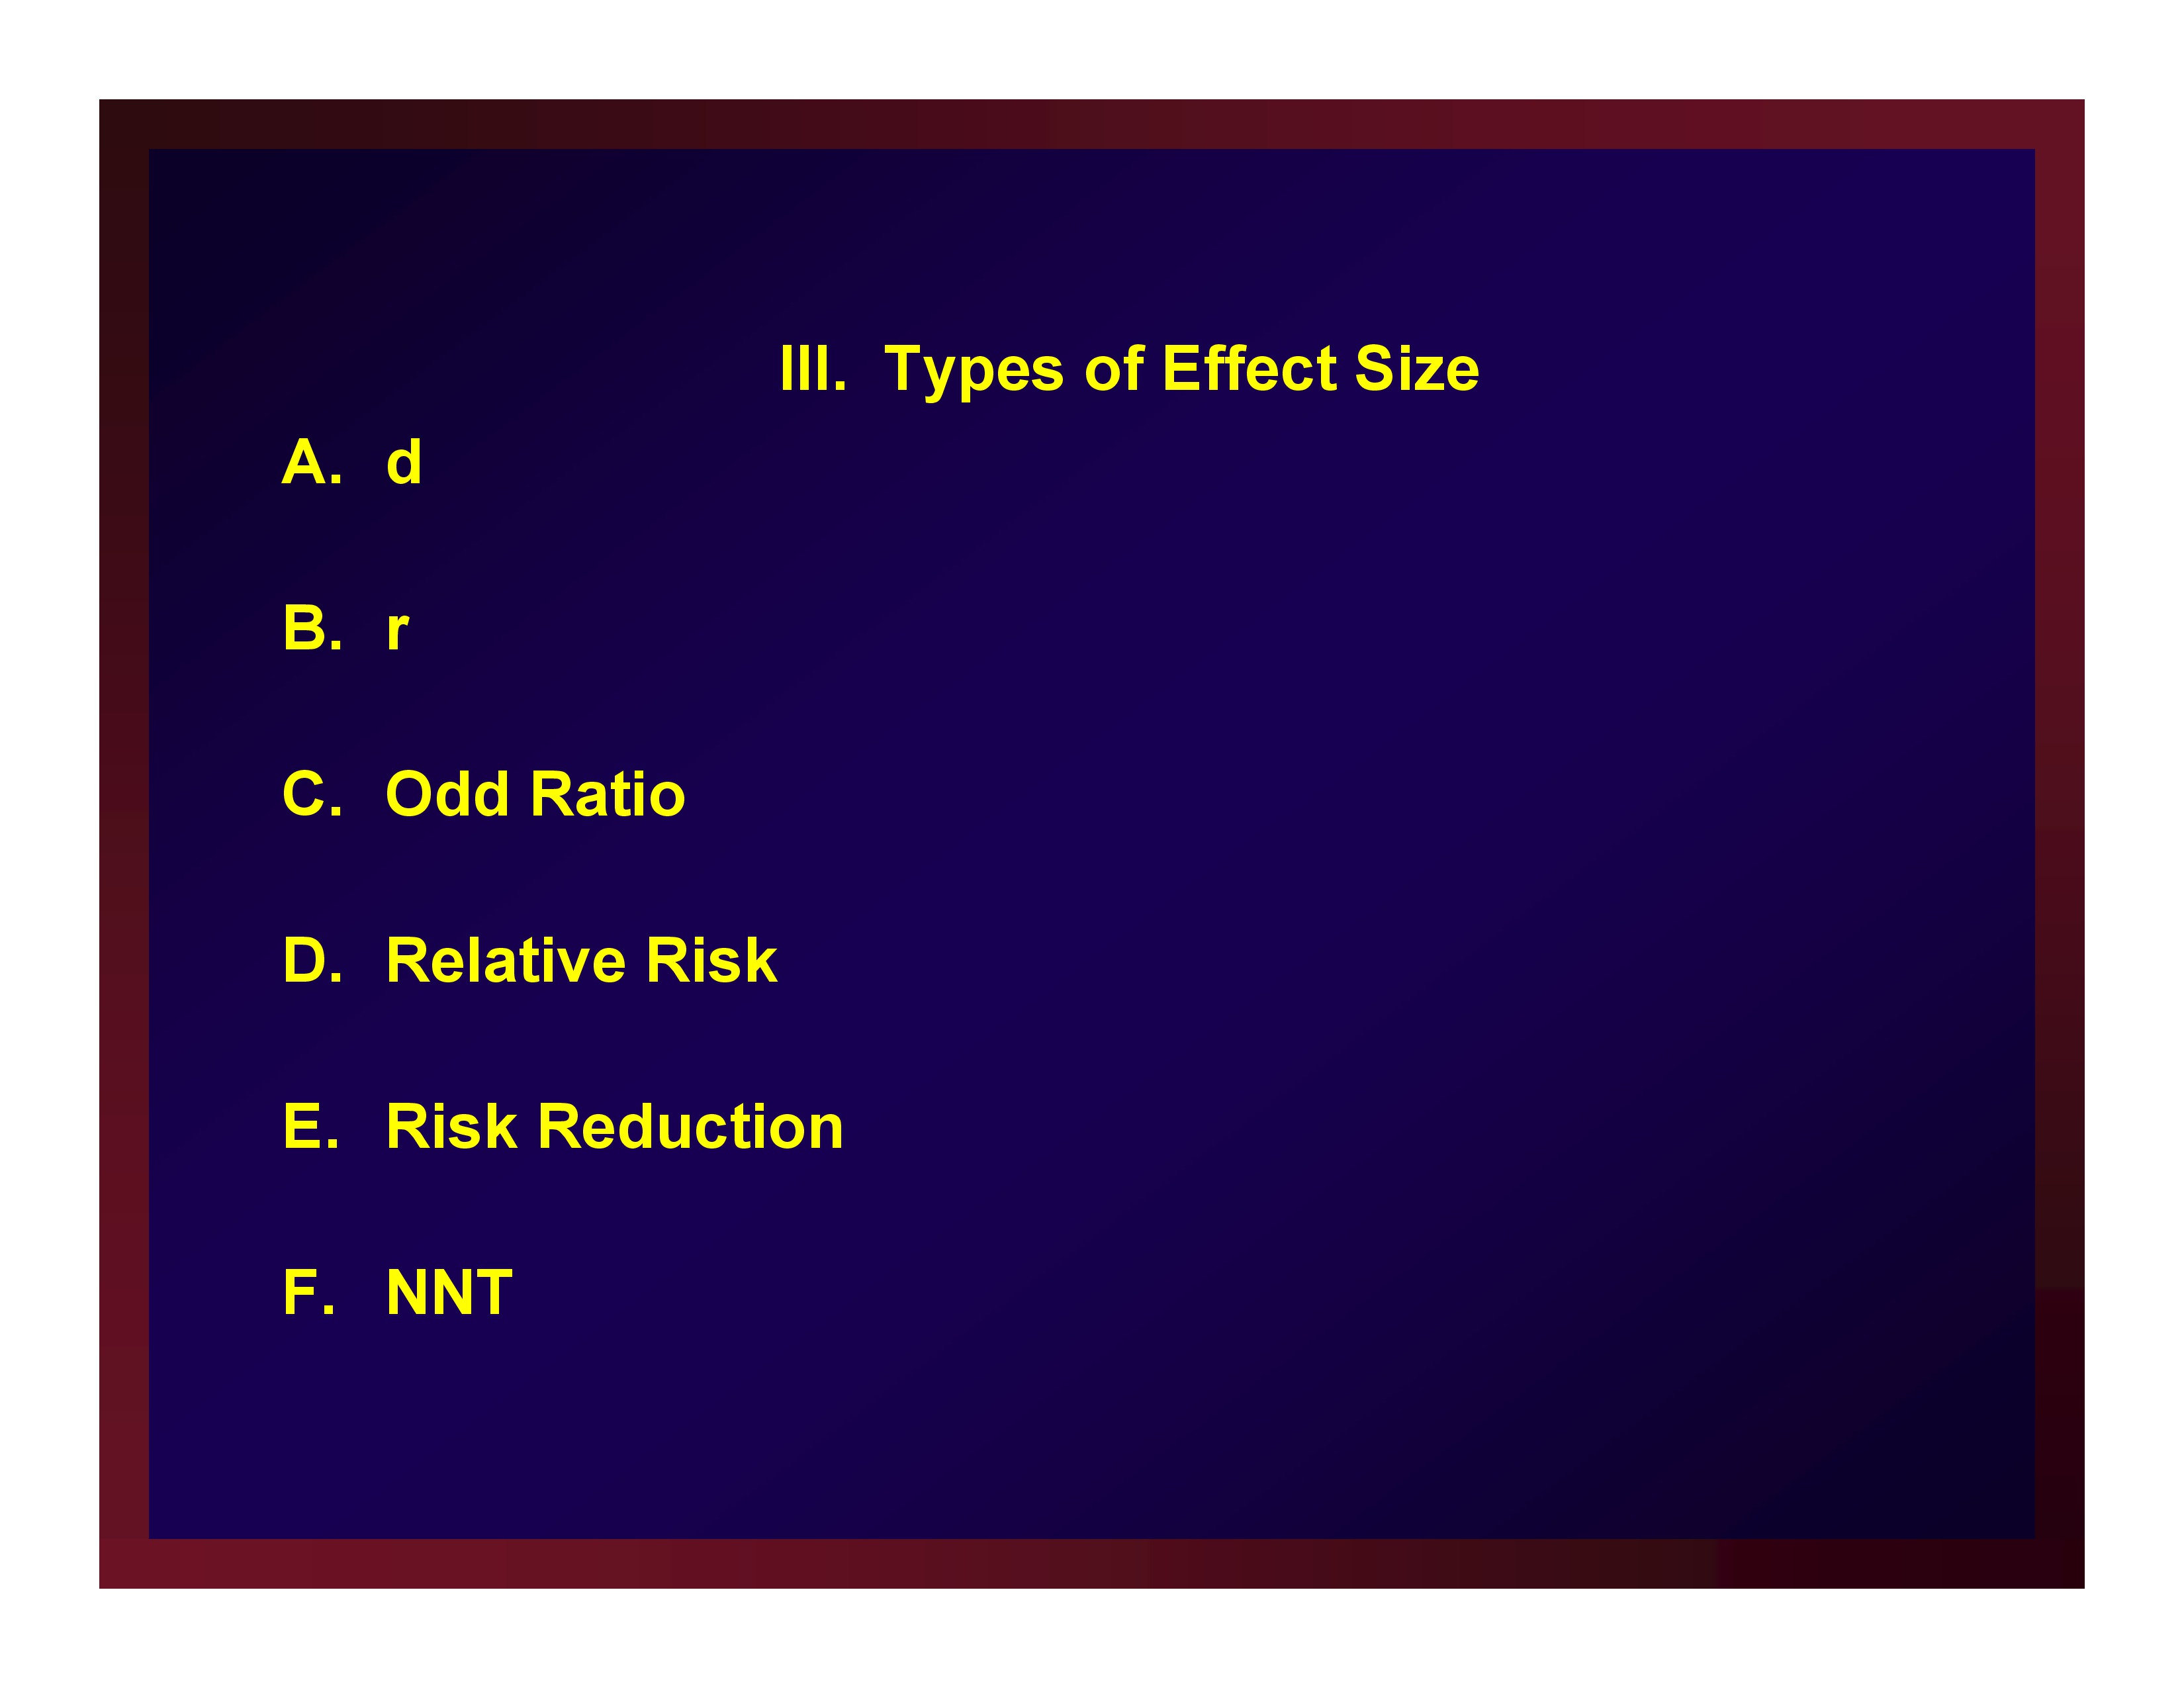
Types of Effect Size
A Priori Statistical Power Analysis

The following four terms are algebraically linked.
- Effect size
- Type I error tolerance
- Statistical power
- Sample size (n)
Knowing the values of any three allows us to solve for the value of the fourth.
Obtaining and Reporting Estimates of Effect Size Obtained Through Your Study

Four benefits realized through reporting estimates of effect size
- Decreased reliance on, or misuse of, statistical significance
- Meaningful interpretations observed results in the context of previous research through empirical, objective, and transparent means
- Increased precision in designing experiments
- Direct support for eventual meta-analyses of clinical research

In the course of the past 10 years, statisticians have made available a powerful tool for assessing a literature base, designing experiments, and interpreting results: noncentral confidence intervals (CI) for point estimates of effect size.

Because a non-zero estimate of effect size characterizes a departure from a null hypothesis, the sampling distribution forming the mathematical basis for a confidence interval is a noncentral distribution.
Bird (2002), Cumming & Finch (2001), Fidler & Thompson (2001), Robey (2005), and Smithson (2001) constitute central readings.
The mathematics of finding a point on a noncentral distribution are exceptionally complex.
Central and Noncentral Distributions of Cohen’s d
 Online Software Resources

Through advances in software applications, recently, statisticians have made noncentral distributions accessible for practitioners. http://psychology3.anu.edu.au/people/smithson/details/CIstuff/CI.html
 http://www.latrobe.edu.au/psy/research/cognitive-and-developmental-psychology/esci/2001-to-2010
 http://www.psy.unsw.edu.au/research/research-tools/psy-statistical-program
References
Bird, K. D. (2002). Confidence intervals for effect sizes in analysis of variance. Educational and Psychological Measurement, 62(2), 197–226 [Article]
Cumming, G. & Finch, S. (2001). A primer on the understanding, use, and calculation of confidence intervals that are based on central and noncentral distributions. Educational and Psychological Measurement, 61(4), 532–574 [Article]
Fidler, F. & Thompson, B. (2001). Computing correct confidence intervals for ANOVA fixed-and random-effects effect sizes. Educational and Psychological Measurement, 61(4), 575–604
Gallin, J.I. & Ognibene, F.P. (2007). Principles and Practices of Clinical Research (2nd Ed.). Ed. Academic Press.
Man‐Son‐Hing, M., Laupacis, A., O’Rourke, K., Molnar, F. J., Mahon, J., Chan, K. B. & Wells, G. (2002). Determination of the clinical importance of study results. Journal of General Internal Medicine, 17(6), 469–476 [Article] [PubMed]
Robey, R. R. (2004). Reporting point and interval estimates of effect-size for planned contrasts: Fixed within effect analyses of variance. Journal of Fluency Disorders, 29(4), 307–341 [Article] [PubMed]
Smithson, M. (2001). Correct confidence intervals for various regression effect sizes and parameters: The importance of noncentral distributions in computing intervals. Educational and Psychological Measurement, 61(4), 605–632 [Article]
Thompson, B. (2002). What future quantitative social science research could look like: Confidence intervals for effect sizes. Educational Researcher, 31(3), 25–32 [Article]
Glossary
See the Evidence-Based Practice Glossary, available from the ASHA website at www.asha.org.
* * * * * * * * * *
d. Several variations of Cohen’s (1988) value d are often reported in group comparison treatment studies. These index degrees of change from pre-treatment to post-treatment, or degrees of change in groups undergoing different treatment experiences
* * * * * * * * * *
r. Correlation coefficient. In a correlational study an effect size reflects the strength of the association between two variables.
* * * * * * * * * *
Odds Ratio. The incidence rate of a particular clinical outcome among individuals exposed to a clinical protocol (i.e., experimental group) divided by the incidence rate of that outcome among individuals who are not exposed to the protocol (i.e., control group).
* * * * * * * * * *
Relative Risk. In technical terms, relative risk ratio (RR) is the incidence rate of a particular clinical outcome among individuals exposed to a clinical protocol (i.e., experimental group) divided by the incidence rate of that outcome among individuals who are not exposed to the protocol (i.e., control group).
* * * * * * * * * *
Absolute Risk Reduction. Absolute risk reduction (ARR) is the absolute difference between the rate of a particular clinical outcome among individuals exposed to a clinical protocol (i.e., experimental group) and the rate of that outcome among individuals who are not exposed to the protocol (i.e., control group).
* * * * * * * * * *
NNT. Number needed to treat is the inverse of the absolute risk reduction (1/ARR), reflecting the average number of individuals that need to be exposed to the experimental clinical protocol in order for a particular clinical outcome to occur.
