

The following is a transcript of the presentation video, edited for clarity.
I’m delighted to talk to you about NIH initiatives to improve measurement. They have some similarities between them, and I will point those out. The first one I’m going to talk about is PROMIS.
I’m going to start with it for a couple reasons. One is that it predates the Toolbox which is the other effort I’ll be talking about. And the other is that some of the methods I’ll introduce to you are also methods are used in Toolbox. So going through and giving you a little bit of a step-by-step about PROMIS perhaps would prepare you to understand more about the Toolbox. I also have to admit that I know more about PROMIS than I do about Toolbox and certainly more about the domains.
PROMIS Goals
So let’s look at PROMIS.
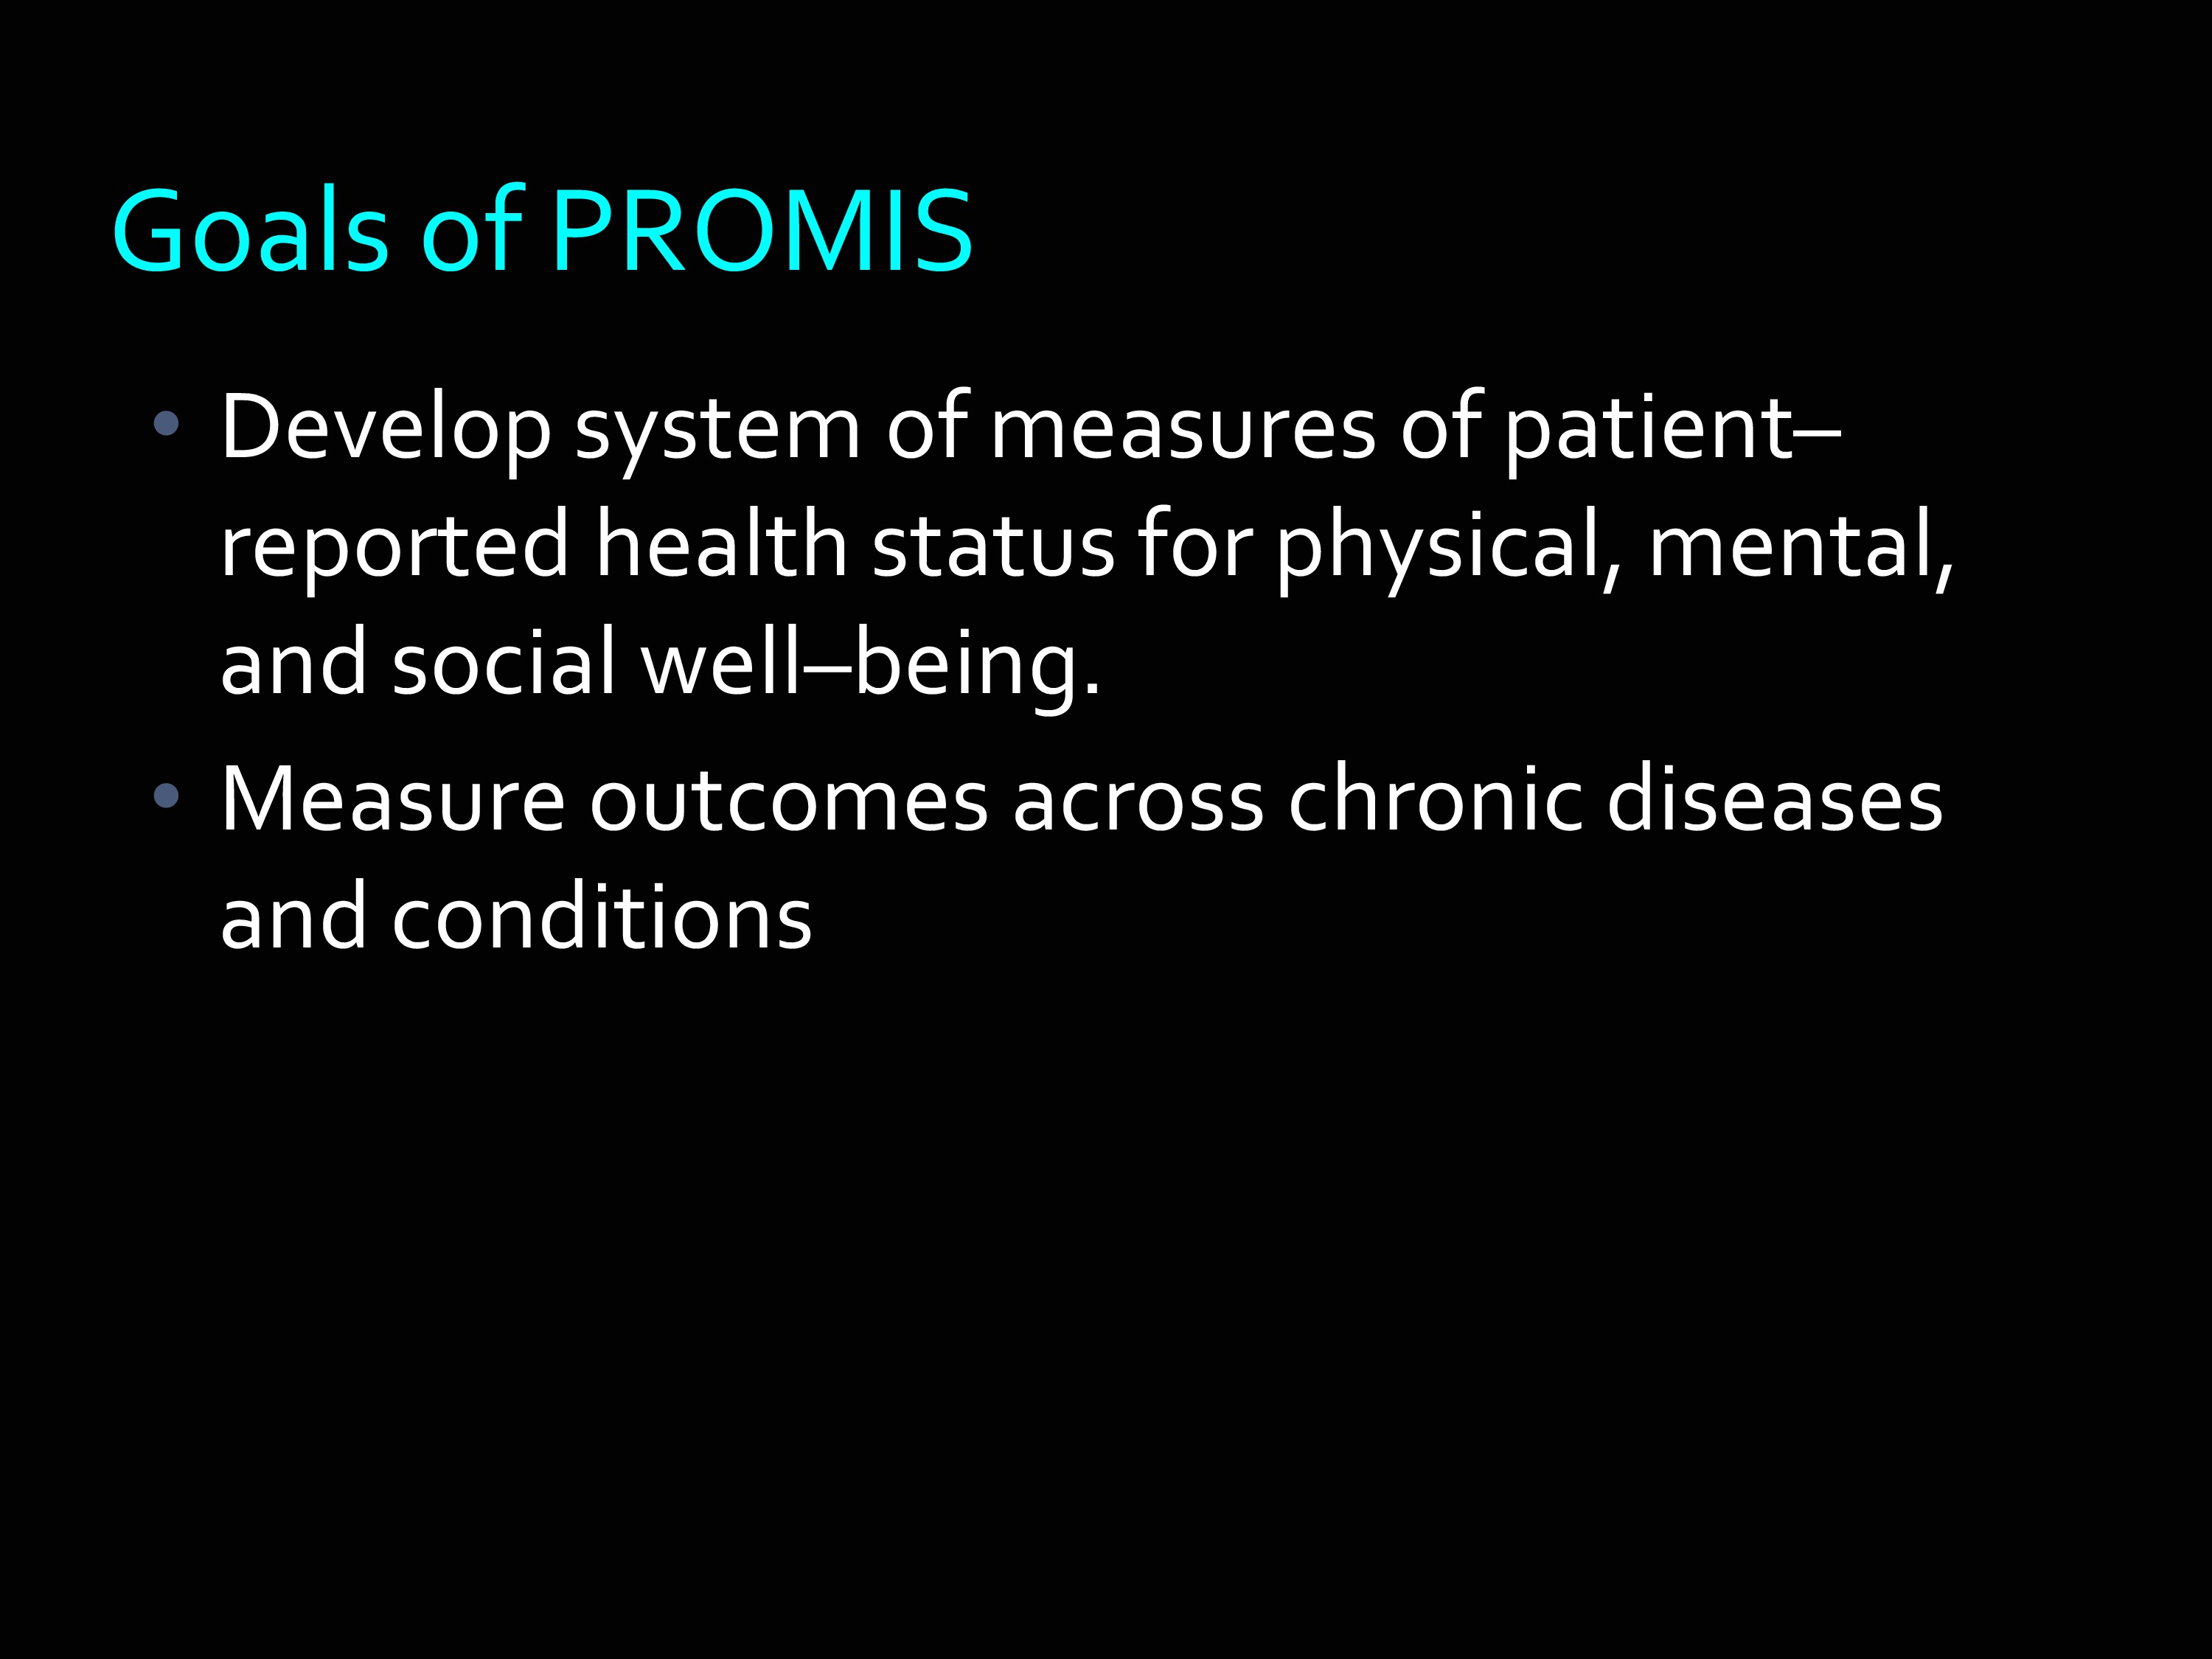
The goal of PROMIS was to develop a system of measures of patient-reported health status for physical, mental, and social well-being. As I’m going to show you, there’s a lot of things that are underneath each of those domains.
The reason those particular ones were picked is because they were domains that were relevant across a lot of chronic diseases. This is one way in which PROMIS contrasts a little bit from Toolbox’s emphasis because PROMIS really is about, what are the measures, what are the outcomes that go across many, many different kinds of chronic conditions.
PROMIS Framework
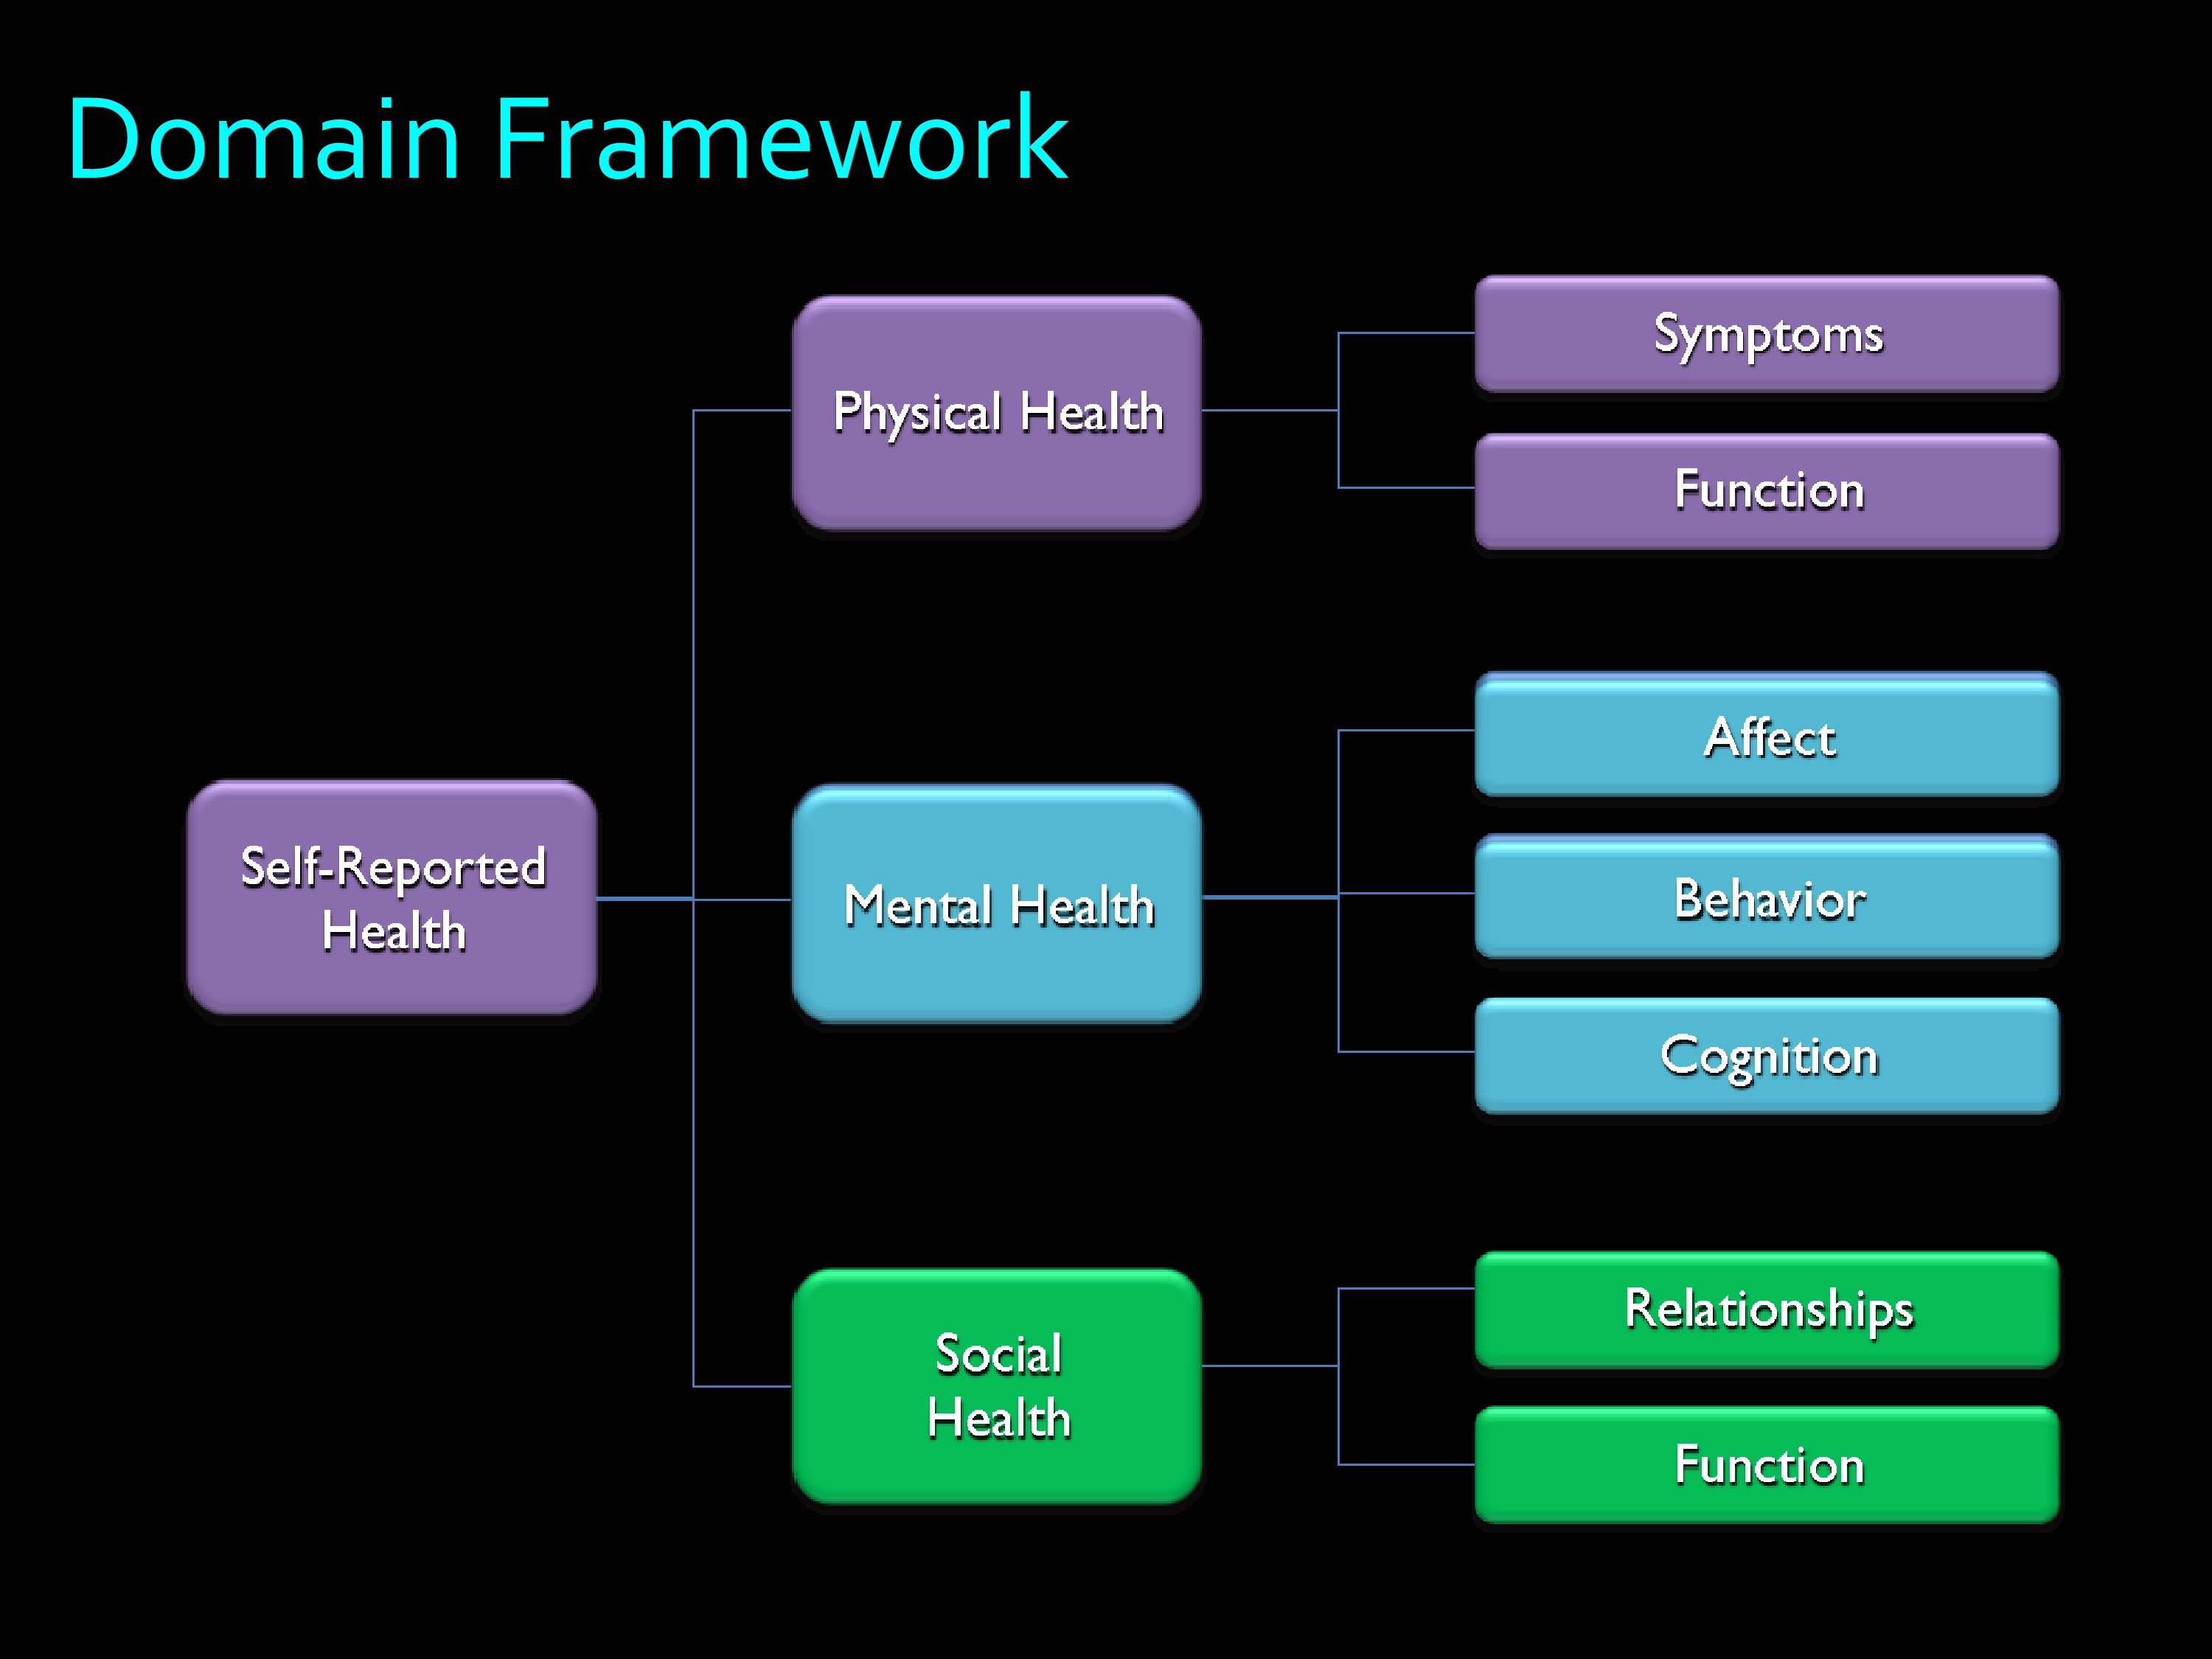
Here’s the PROMIS domain framework. Self-reported health was divided into physical health, mental health, and social health. As you can see, there are a lot of branches off of those.
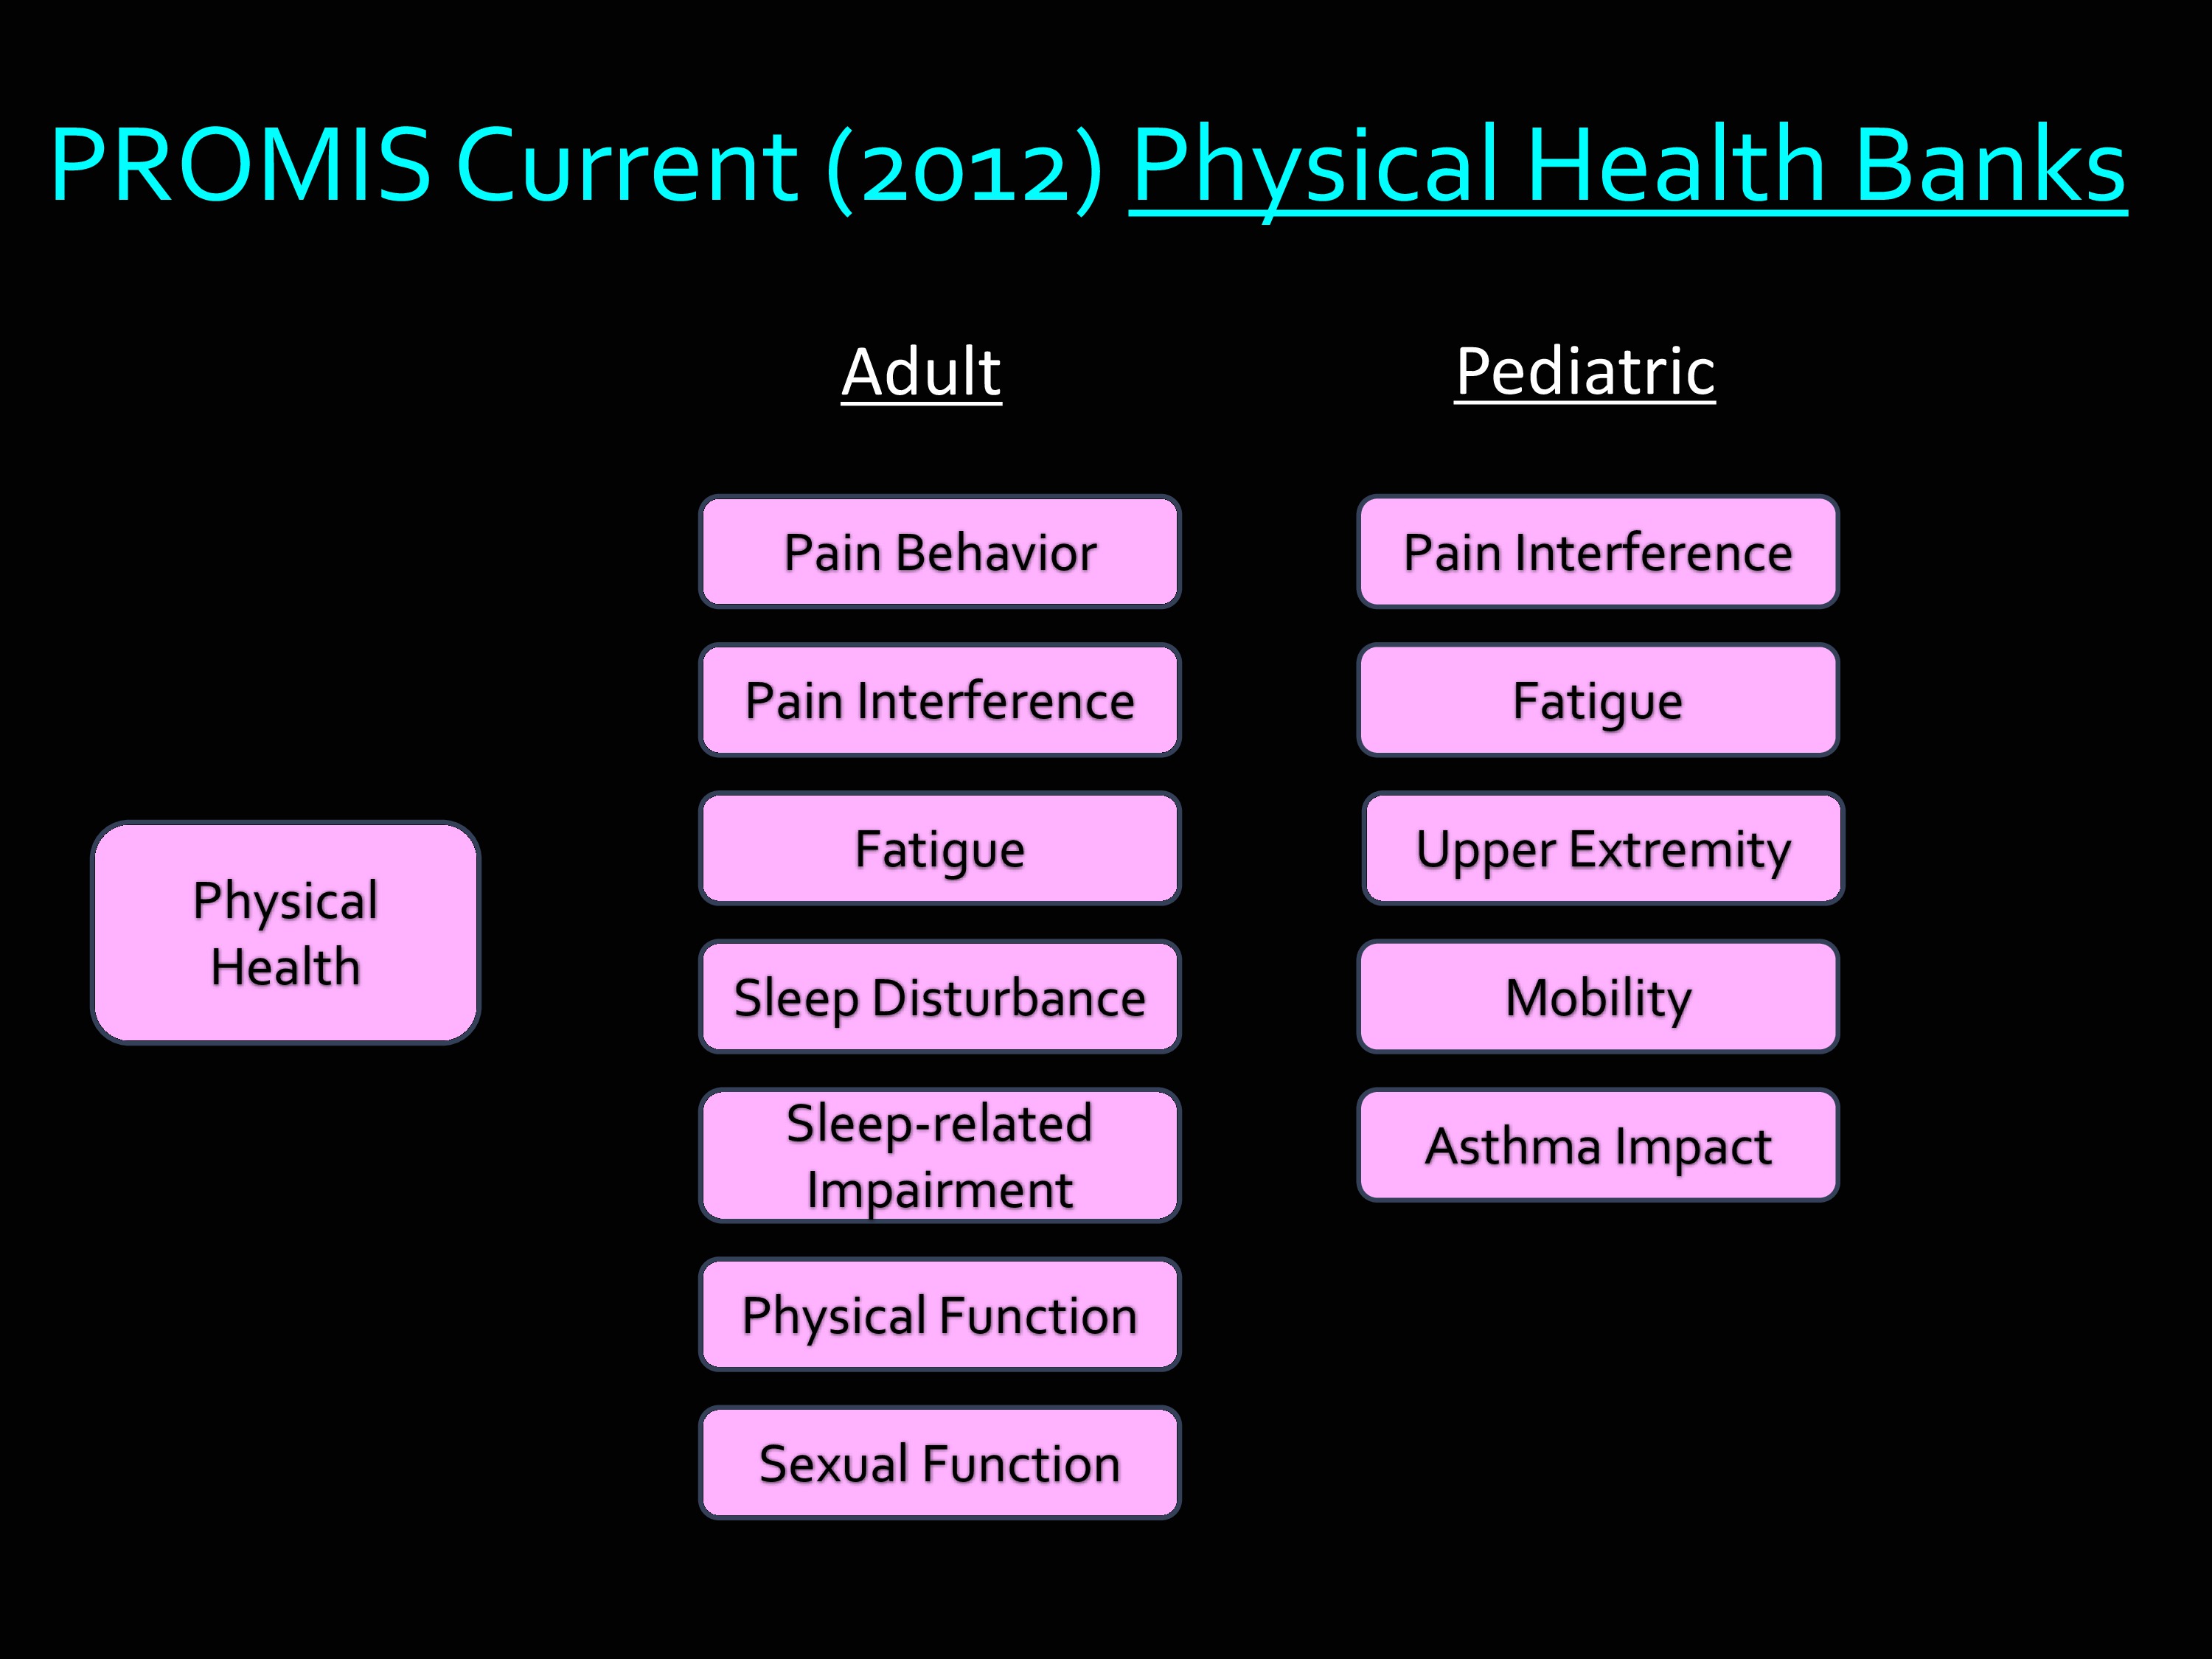
But then if we just take physical health. These are the banks that are available right now, as of this year. Under Adult: Pain behavior, pain interference, fatigue, sleep disturbance, sleep-related impairment, physical function, sexual function. Then many of those are also available in Pediatric banks. I haven’t included this in my slide, but many of the measures in PROMIS have been translated into Spanish, and into other languages as well.
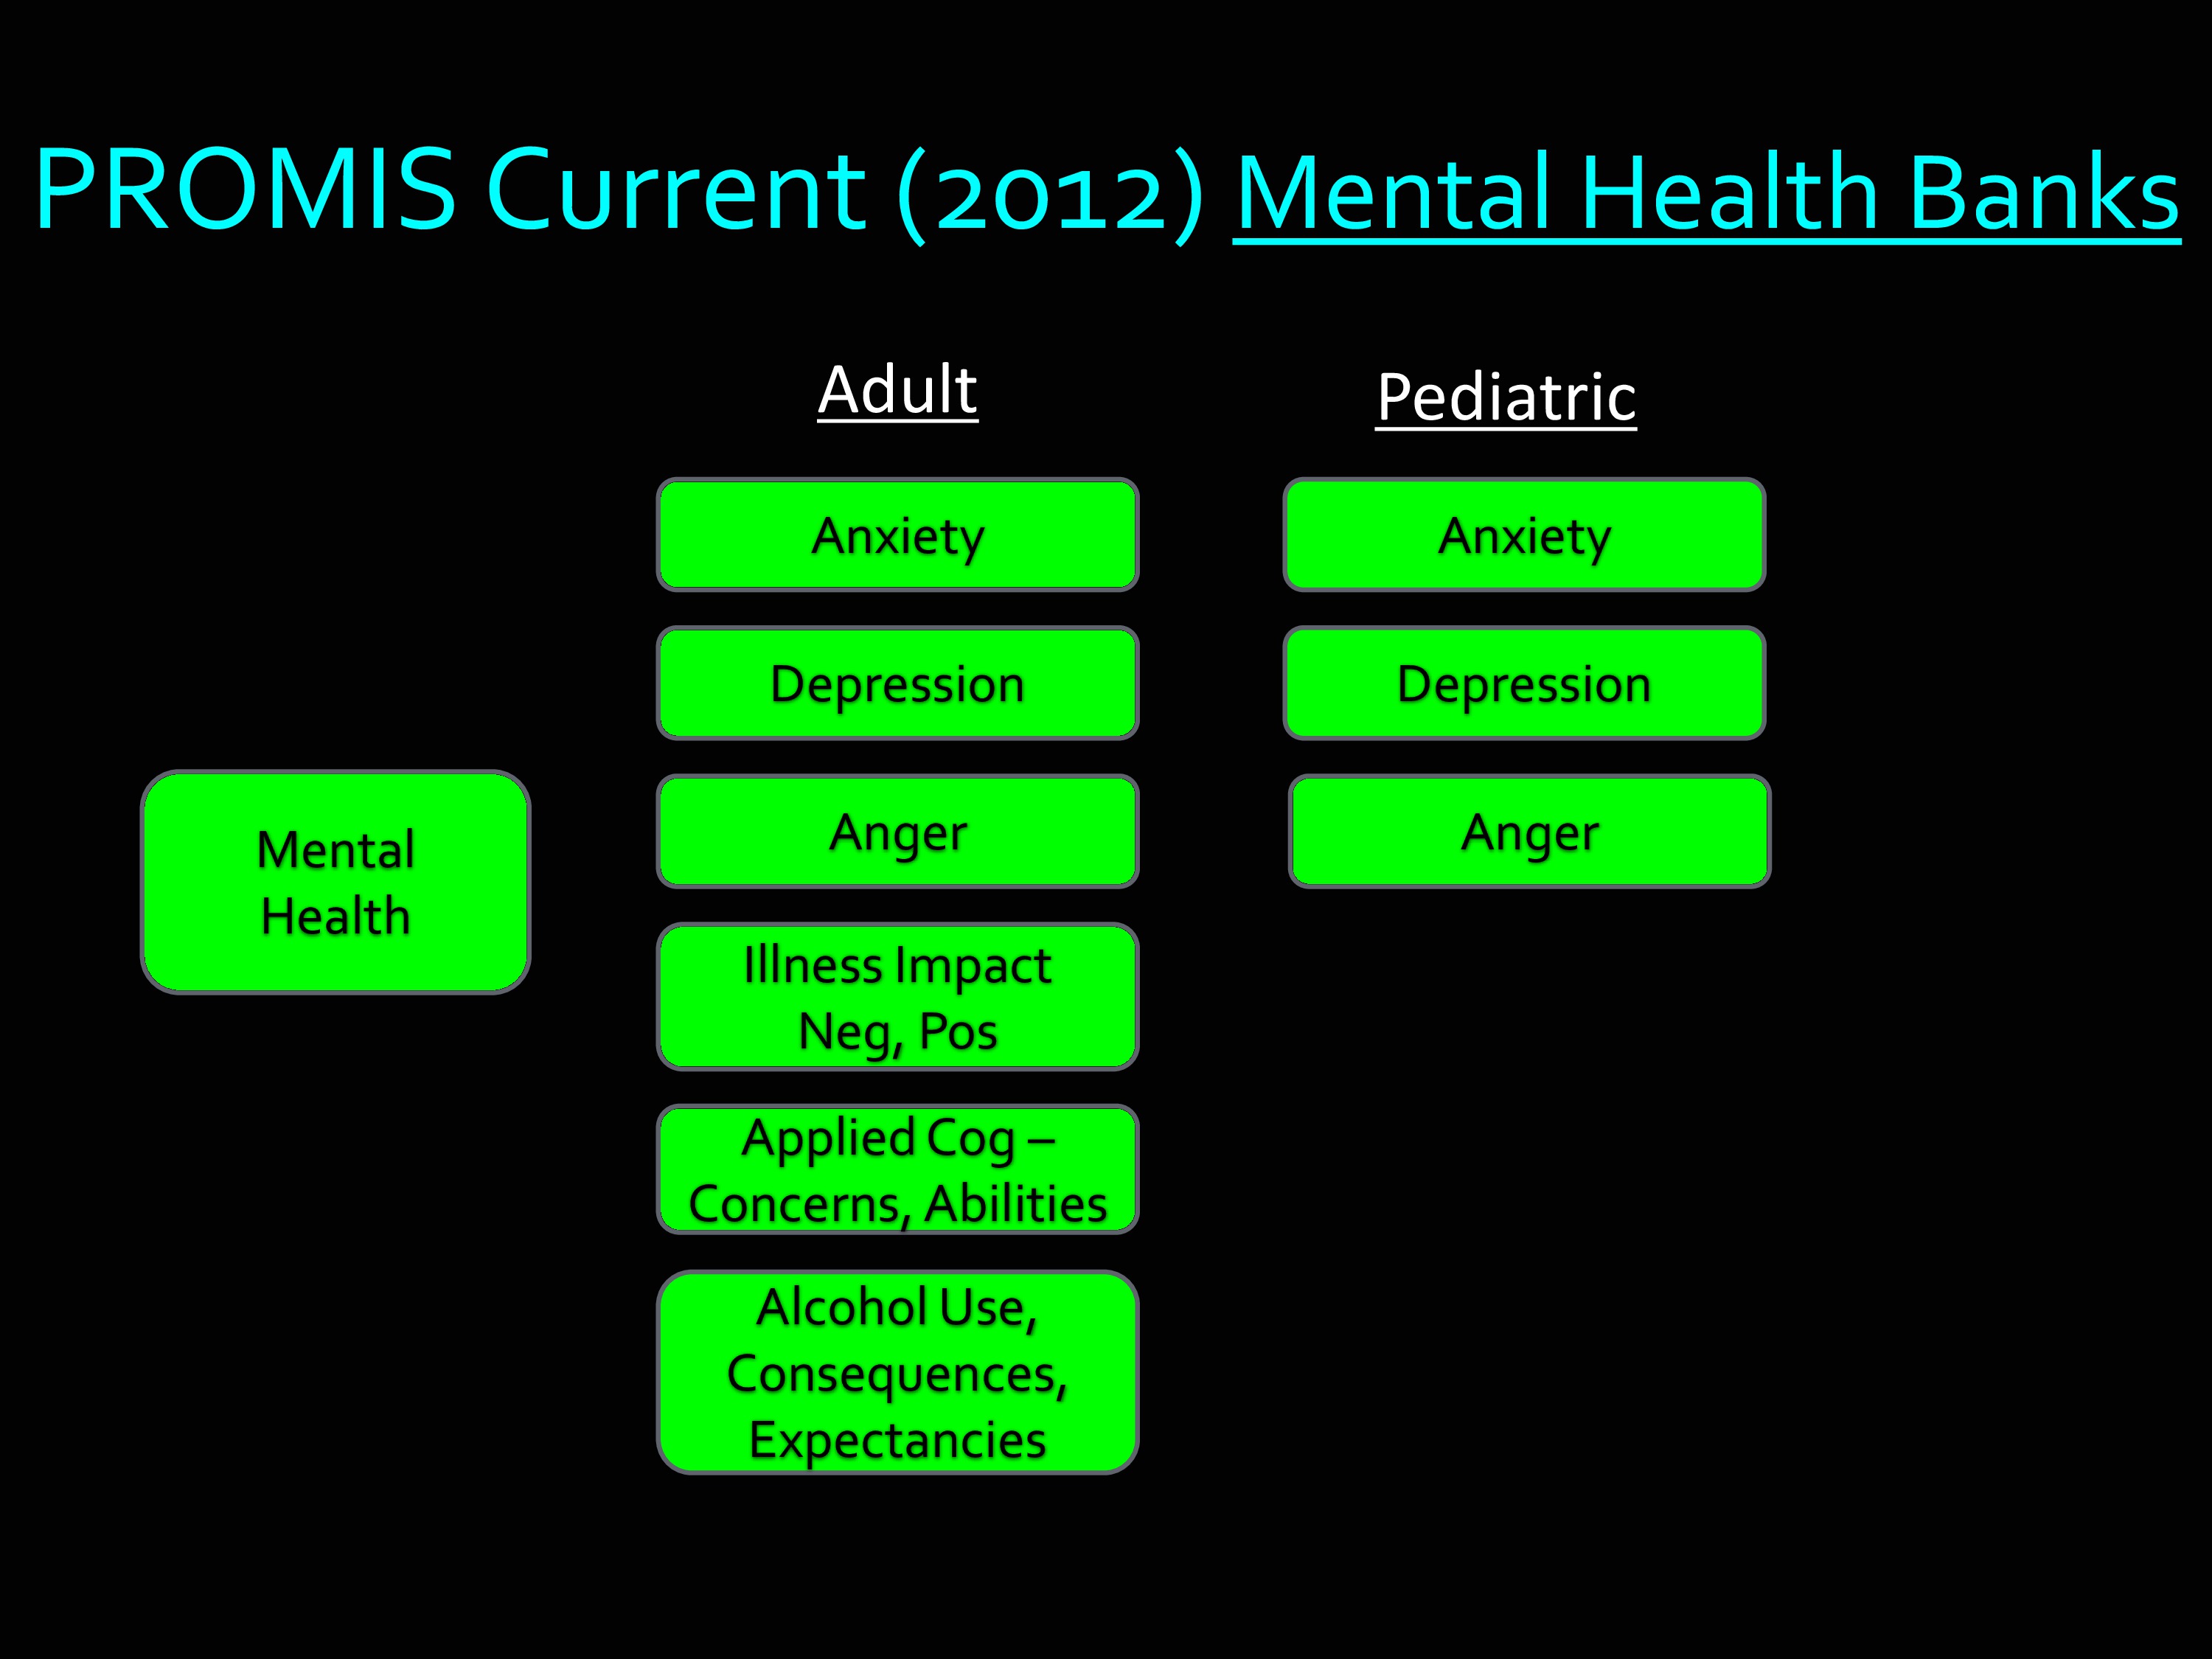
Here’s an example of the Mental Health component. You see the kinds of things there. Anxiety, depression, anger, etc. Under the Pediatric, there’s three: anxiety, depression, anger.
Item Banking: Quality and Methods
One of the things about PROMIS — and it’s also true of Toolbox — is the measurement strategy is different from the classical approach.
The classical approach is something like this: A couple of people who are experts are sitting around over a beer. They write out some questions on a napkin. And then they administer it. I like to say that the problem with self-reported outcome measures is they look like something you can make in your garage over the weekend. Though, I’m sure you are very aware of how much there is to the research behind how you ask questions and the questions that you ask.
Generally, the old-school approach to measurement — and still one that works very well for many applications — is to have a list of items. It’s one form, and everyone answers the same items.
The approach used in PROMIS and in Toolbox is called Item Banking.
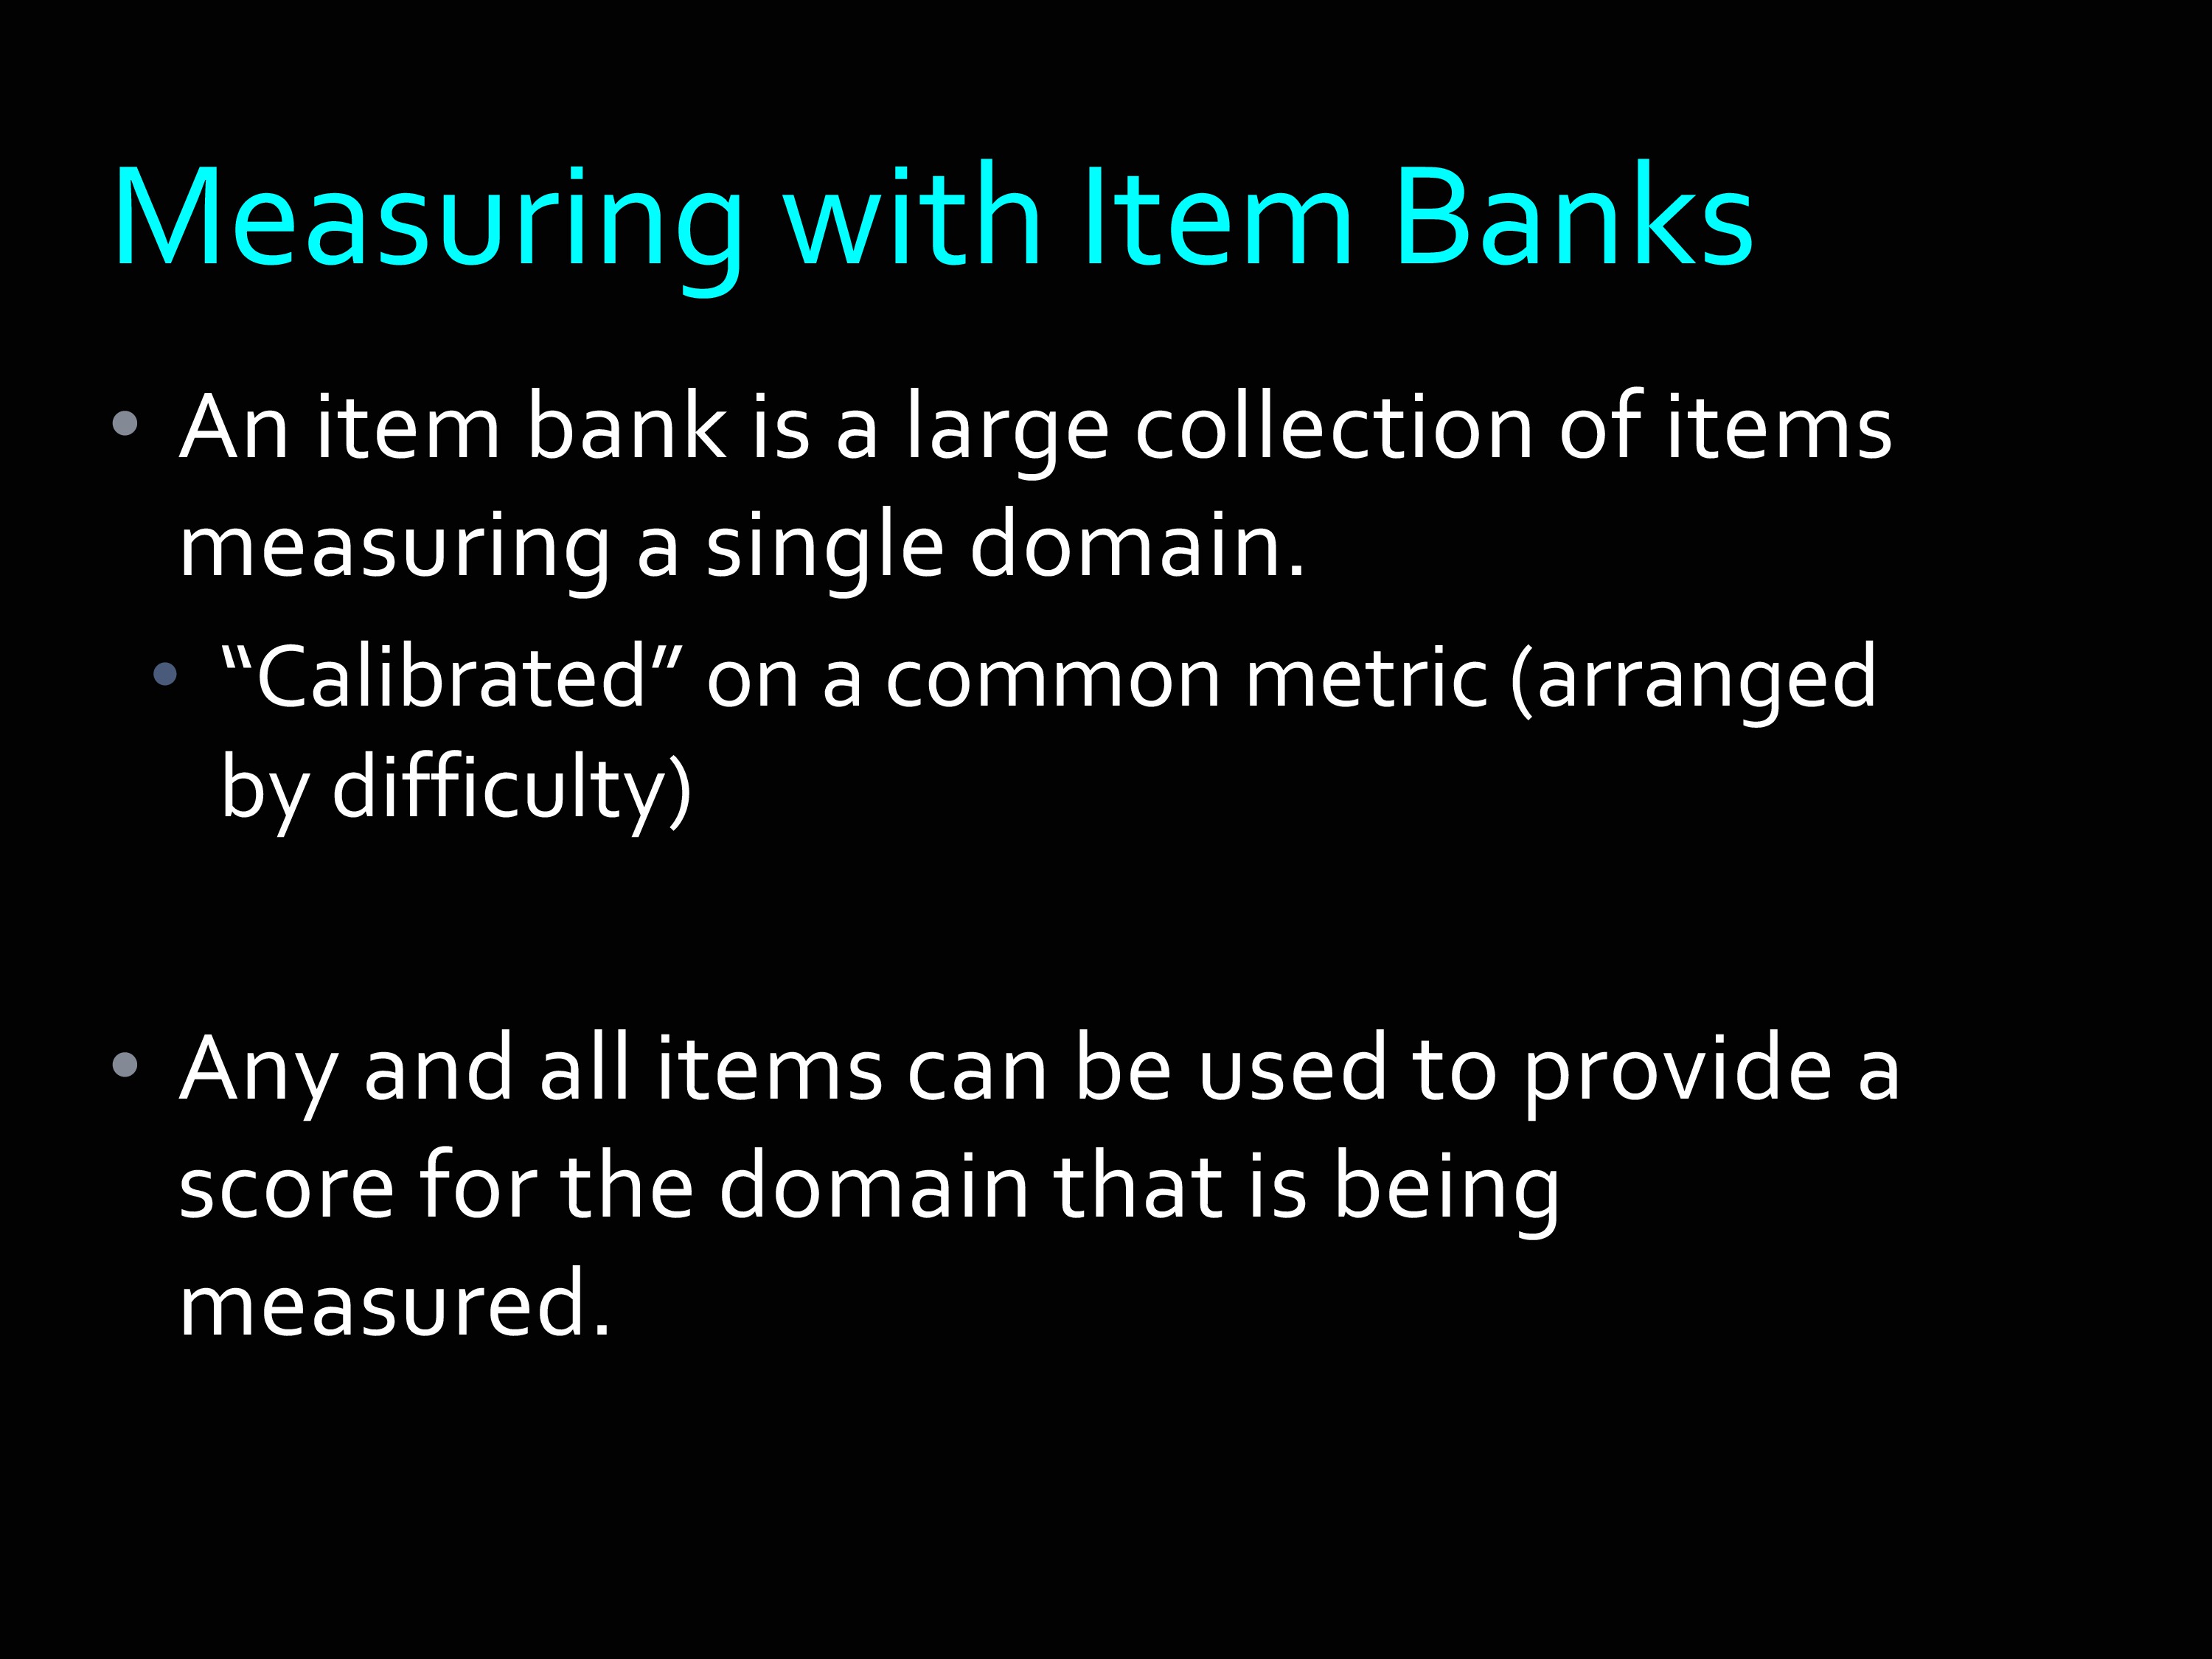
You can picture this as thinking about the universe of items that could be asked about a particular outcome, and banking those into a single repository. Then withdrawing those to make short forms, to make longer forms, to make forms that make specific relevance for a particular population. And, as I’m going to show you later, also using them for tailored assessment.
If you have this whole large sample of items in this item bank, what holds them together and makes it possible for you to use subsets of them is something called “Item Response Theory” which is a mathematical equation. We say that these items are “calibrated” on a common metric.
Another way to think about that is we arrange them by difficulty along the continuum of what we’re going to measure. I’m going to show this later, this is just so you can hear it once. And you’re about to hear it a second time, as well.
As I said, the really nice thing about an item banking approach is that any subset of those items can be used to get a score that is on the same metric as any other subset of those items.
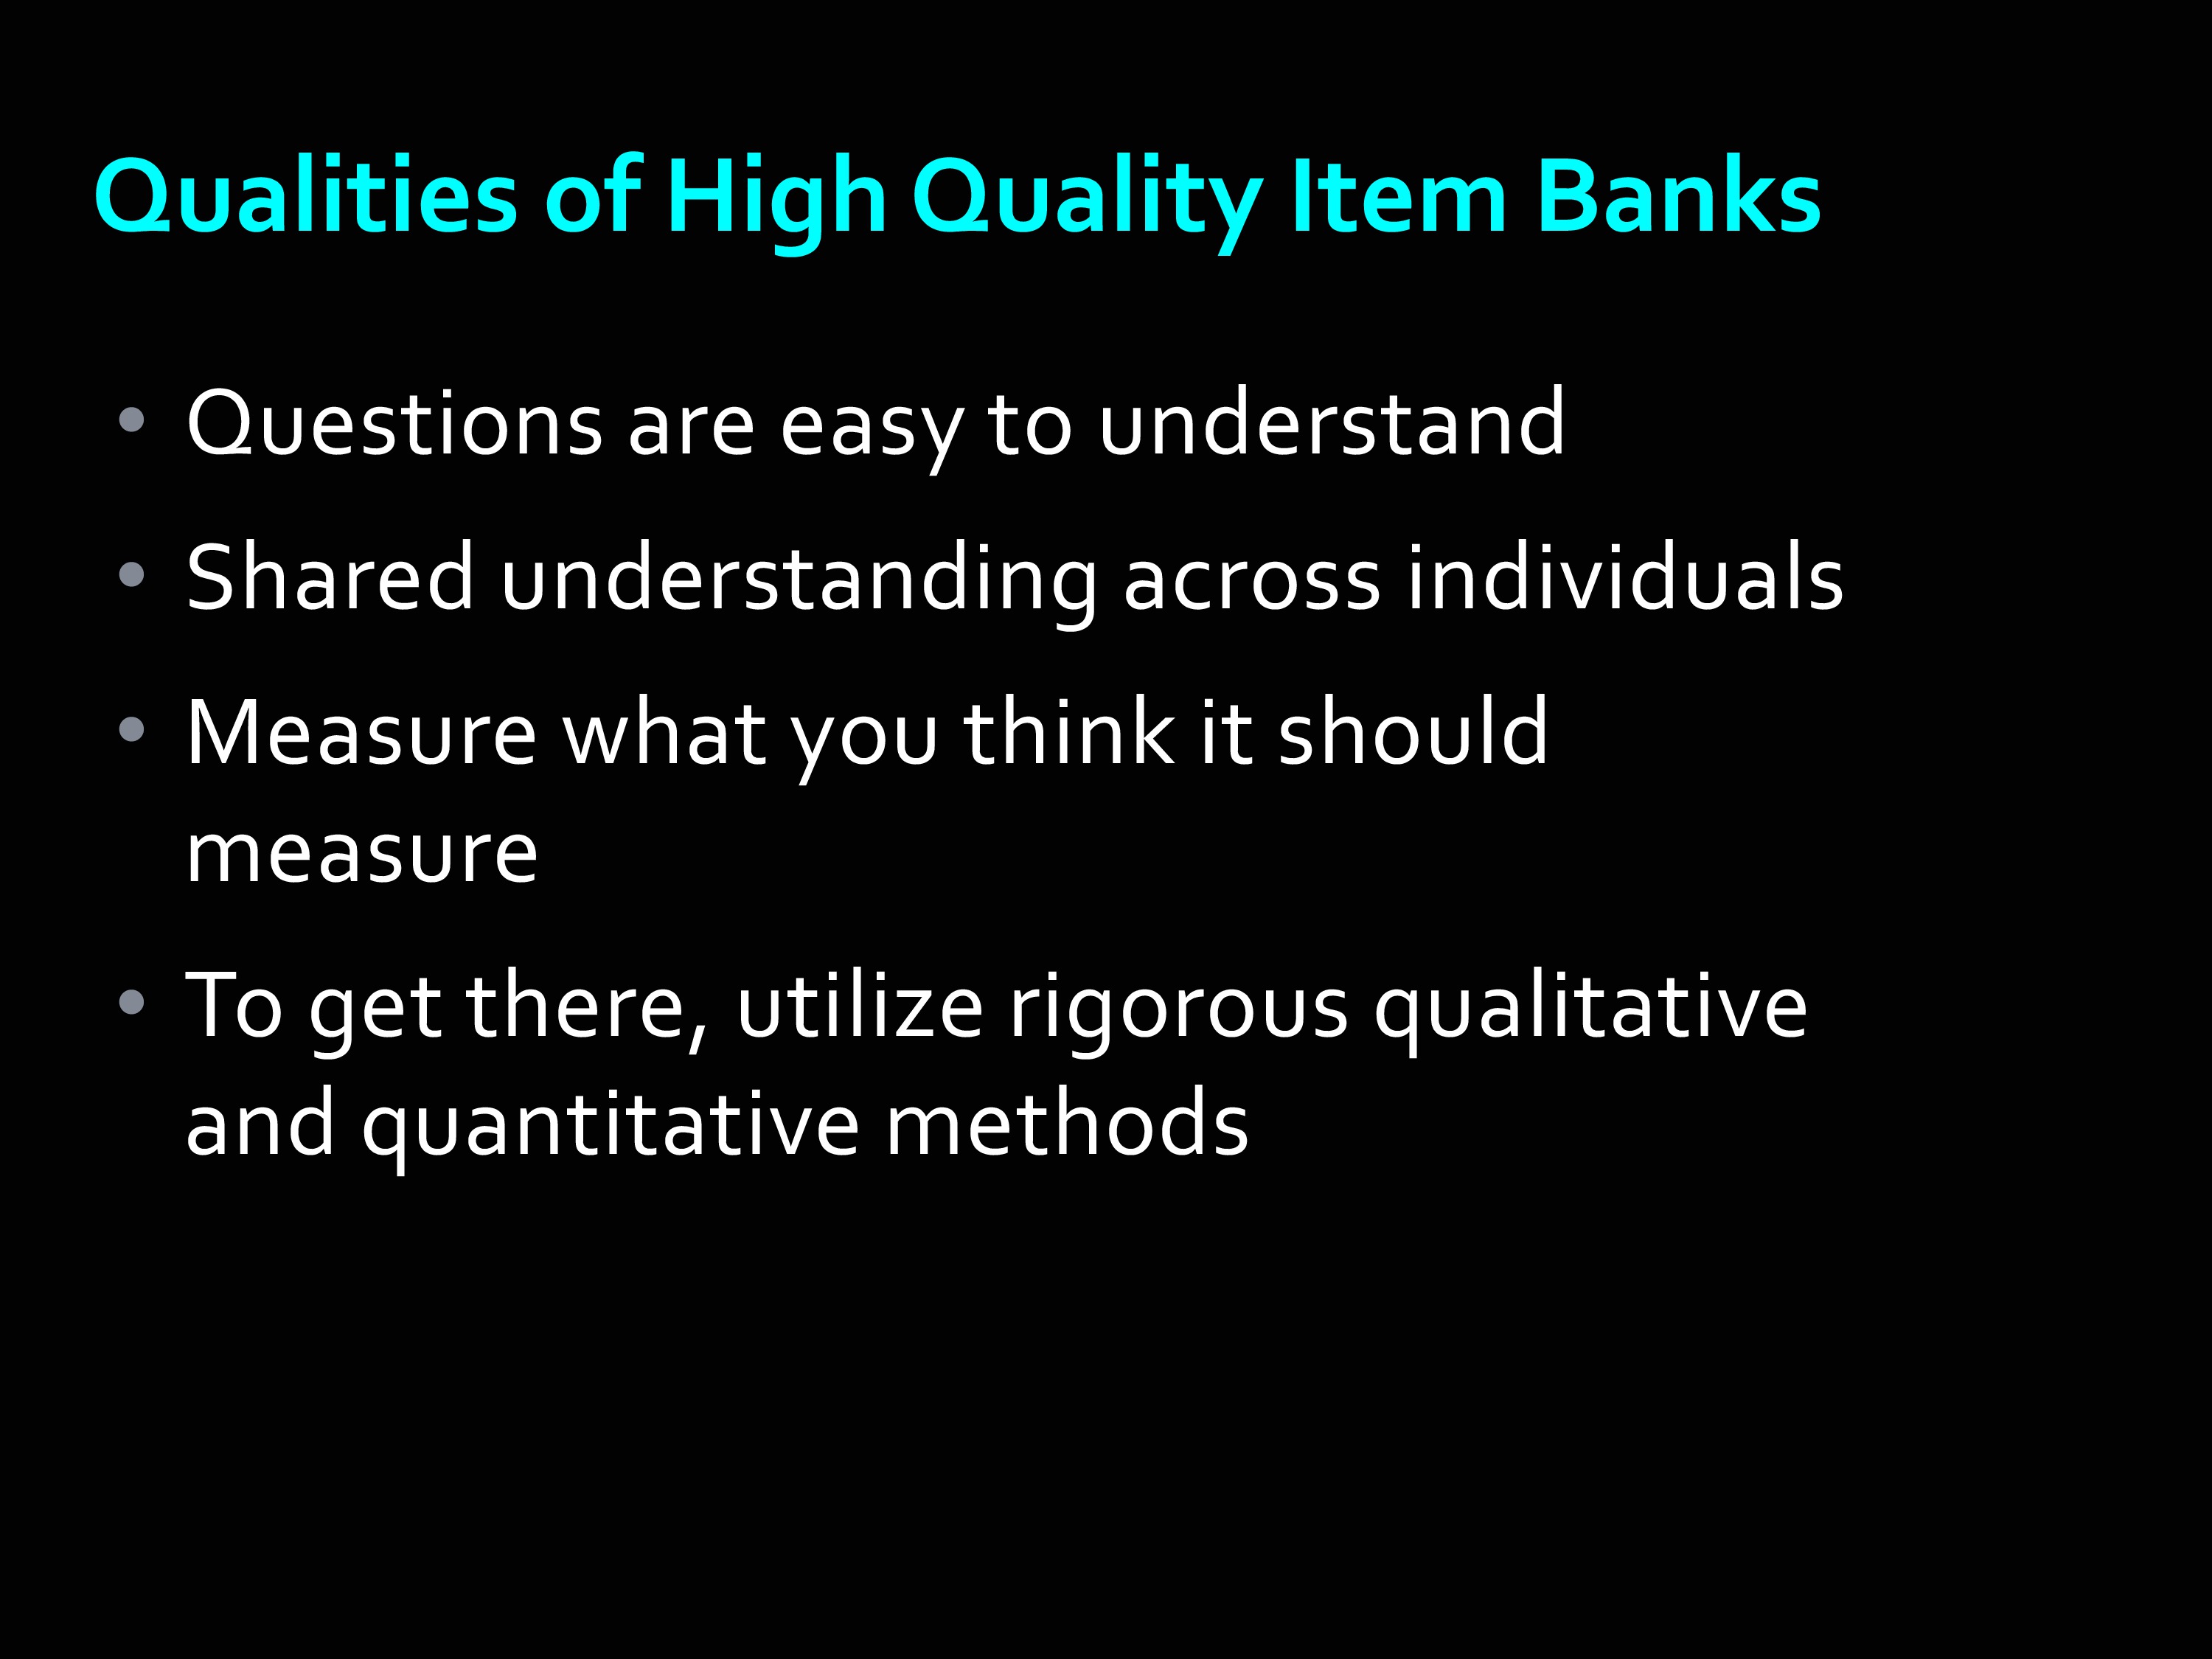
The most important thing about creating a quality item bank is you’ve got to make sure the items themselves have very strong psychometric qualities.
For example, the questions need to be easy to understand. It’s also very important that there’s a shared understanding across individuals.
At the University of Washington, when I was there, we led in the development of a pain interference and pain severity, pain behavior, and pain quality items for PROMIS. I remember in one of our groups, we were talking about pain qualities, and some people experience what they experience as a painful cold sensation. We were doing cognitive interviews with folks, and we asked them about their experience of cold pain. And this one person said, “It’s been a fairly warm winter in Seattle.” Another was asked about shooting pain, and he responded, “Well, I’ve been shot before, I know what shooting pain is like.” So, it’s very important, and it’s also very surprising how other people read questions. It is not enough for experts to sit in a room and decide, “Yeah, I understand that.” It’s very important to find out how those questions are read by patients and by different types of people.
The other critical thing, of course, is the validity issue. Do the items in the item bank all measure the construct that you’ve intended to measure.
And to get all of these really rigorous qualities, it’s important that we use rigorous qualitative and quantitative measures.
I’m going to give you some examples of the qualitative methods. This is a subset of the ones that were used in the PROMIS measures and the Toolbox measures.
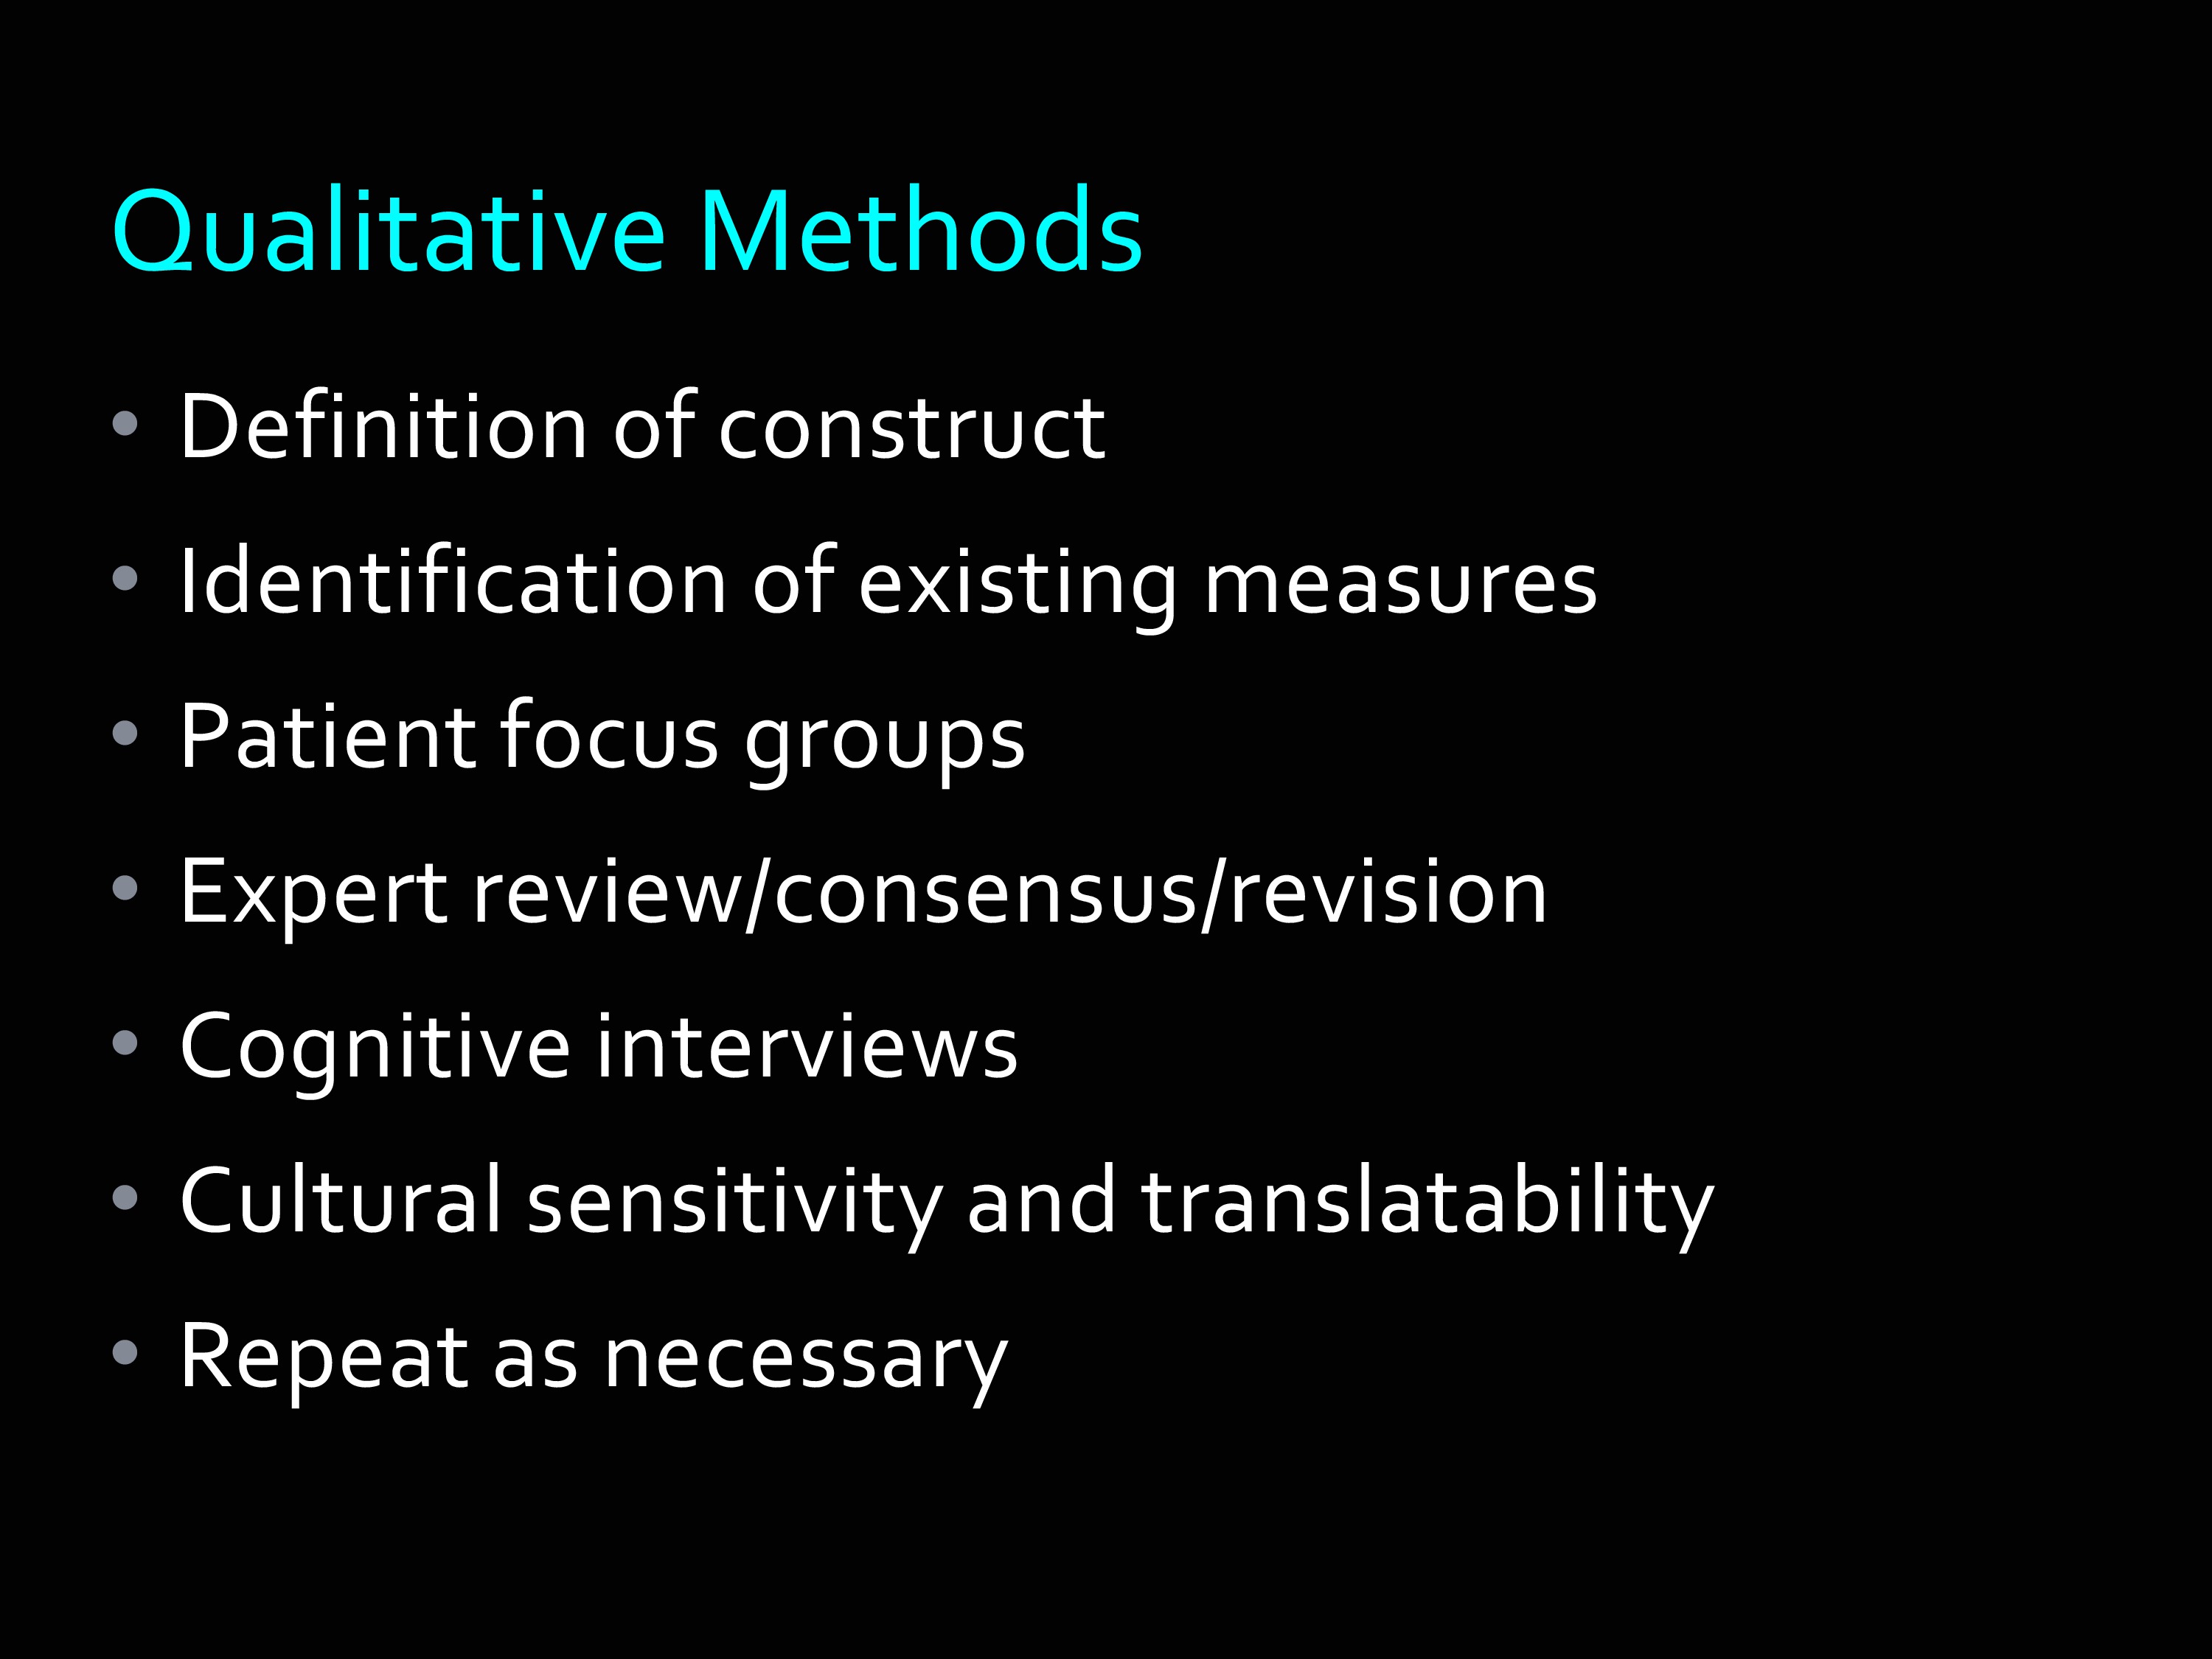
The very first step in developing a measure is the definition of a construct. I cannot tell you how many times people publish a measure without ever telling you how they defined the construct. But it is critical, because it really defines the boundaries around what you’re going to include in your items.
For example, there was an old study in JAMA one time that counted the percentage of people who said they used a quality of life measure and never explained what they meant by quality of life. The percentage that actually did — it was in the embarrassingly low 20%, I think.
So here are some of the things that were done: Definition of construct. Also, identification of existing measures.
For some constructs, we actually identified literally thousands of items that had already been written and were in the public domain.
We also then, in spite of having all of those items, we went into focus groups with patients and said, “Tell us about your experience with fatigue. Tell us about your experience with pain. Tell us about your experience with anxiety.” We wanted to make sure — even though all of those items were out there — that there weren’t things that we were missing.
This is a real key idea to the notion of construct validity. The idea that you have items that represent the construct of interest, and you’re not leaving things out that are really important.
Then next thing that happened was an expert review/consensus/revision of items. We did what we call “binning and winnowing” which is a process of trying to get down to a smaller subset of items. This was with clinical experts — not just psychometricians like myself, but people who actually know things about patients were included.
Once we had a smaller set of items, we went out and did the interviews like I just described. Cognitive interviews, where we had somebody read an item and say, “Tell us what that item means to you. Think aloud. As you read that item, tell us what you’re thinking about.”
Then, another really important step, and one I had not really had experience with before, was we went through a review of all the items to ensure their cultural sensitivity of course — I was aware of that — but their translatability. Because we knew the PROMIS items were going to later be translated into a number of different languages. We have at Northwestern a group that does a lot of translations of measures. So they read through the items and they could tell us — this particular construct is not going to be easy to translate into Spanish. So they gave us feedback, and we did our best, when we had an option, to try to find wording that could be effectively translated into other languages.
Then, as you can imagine, you get that feedback, and you make revisions, and you repeat as necessary.
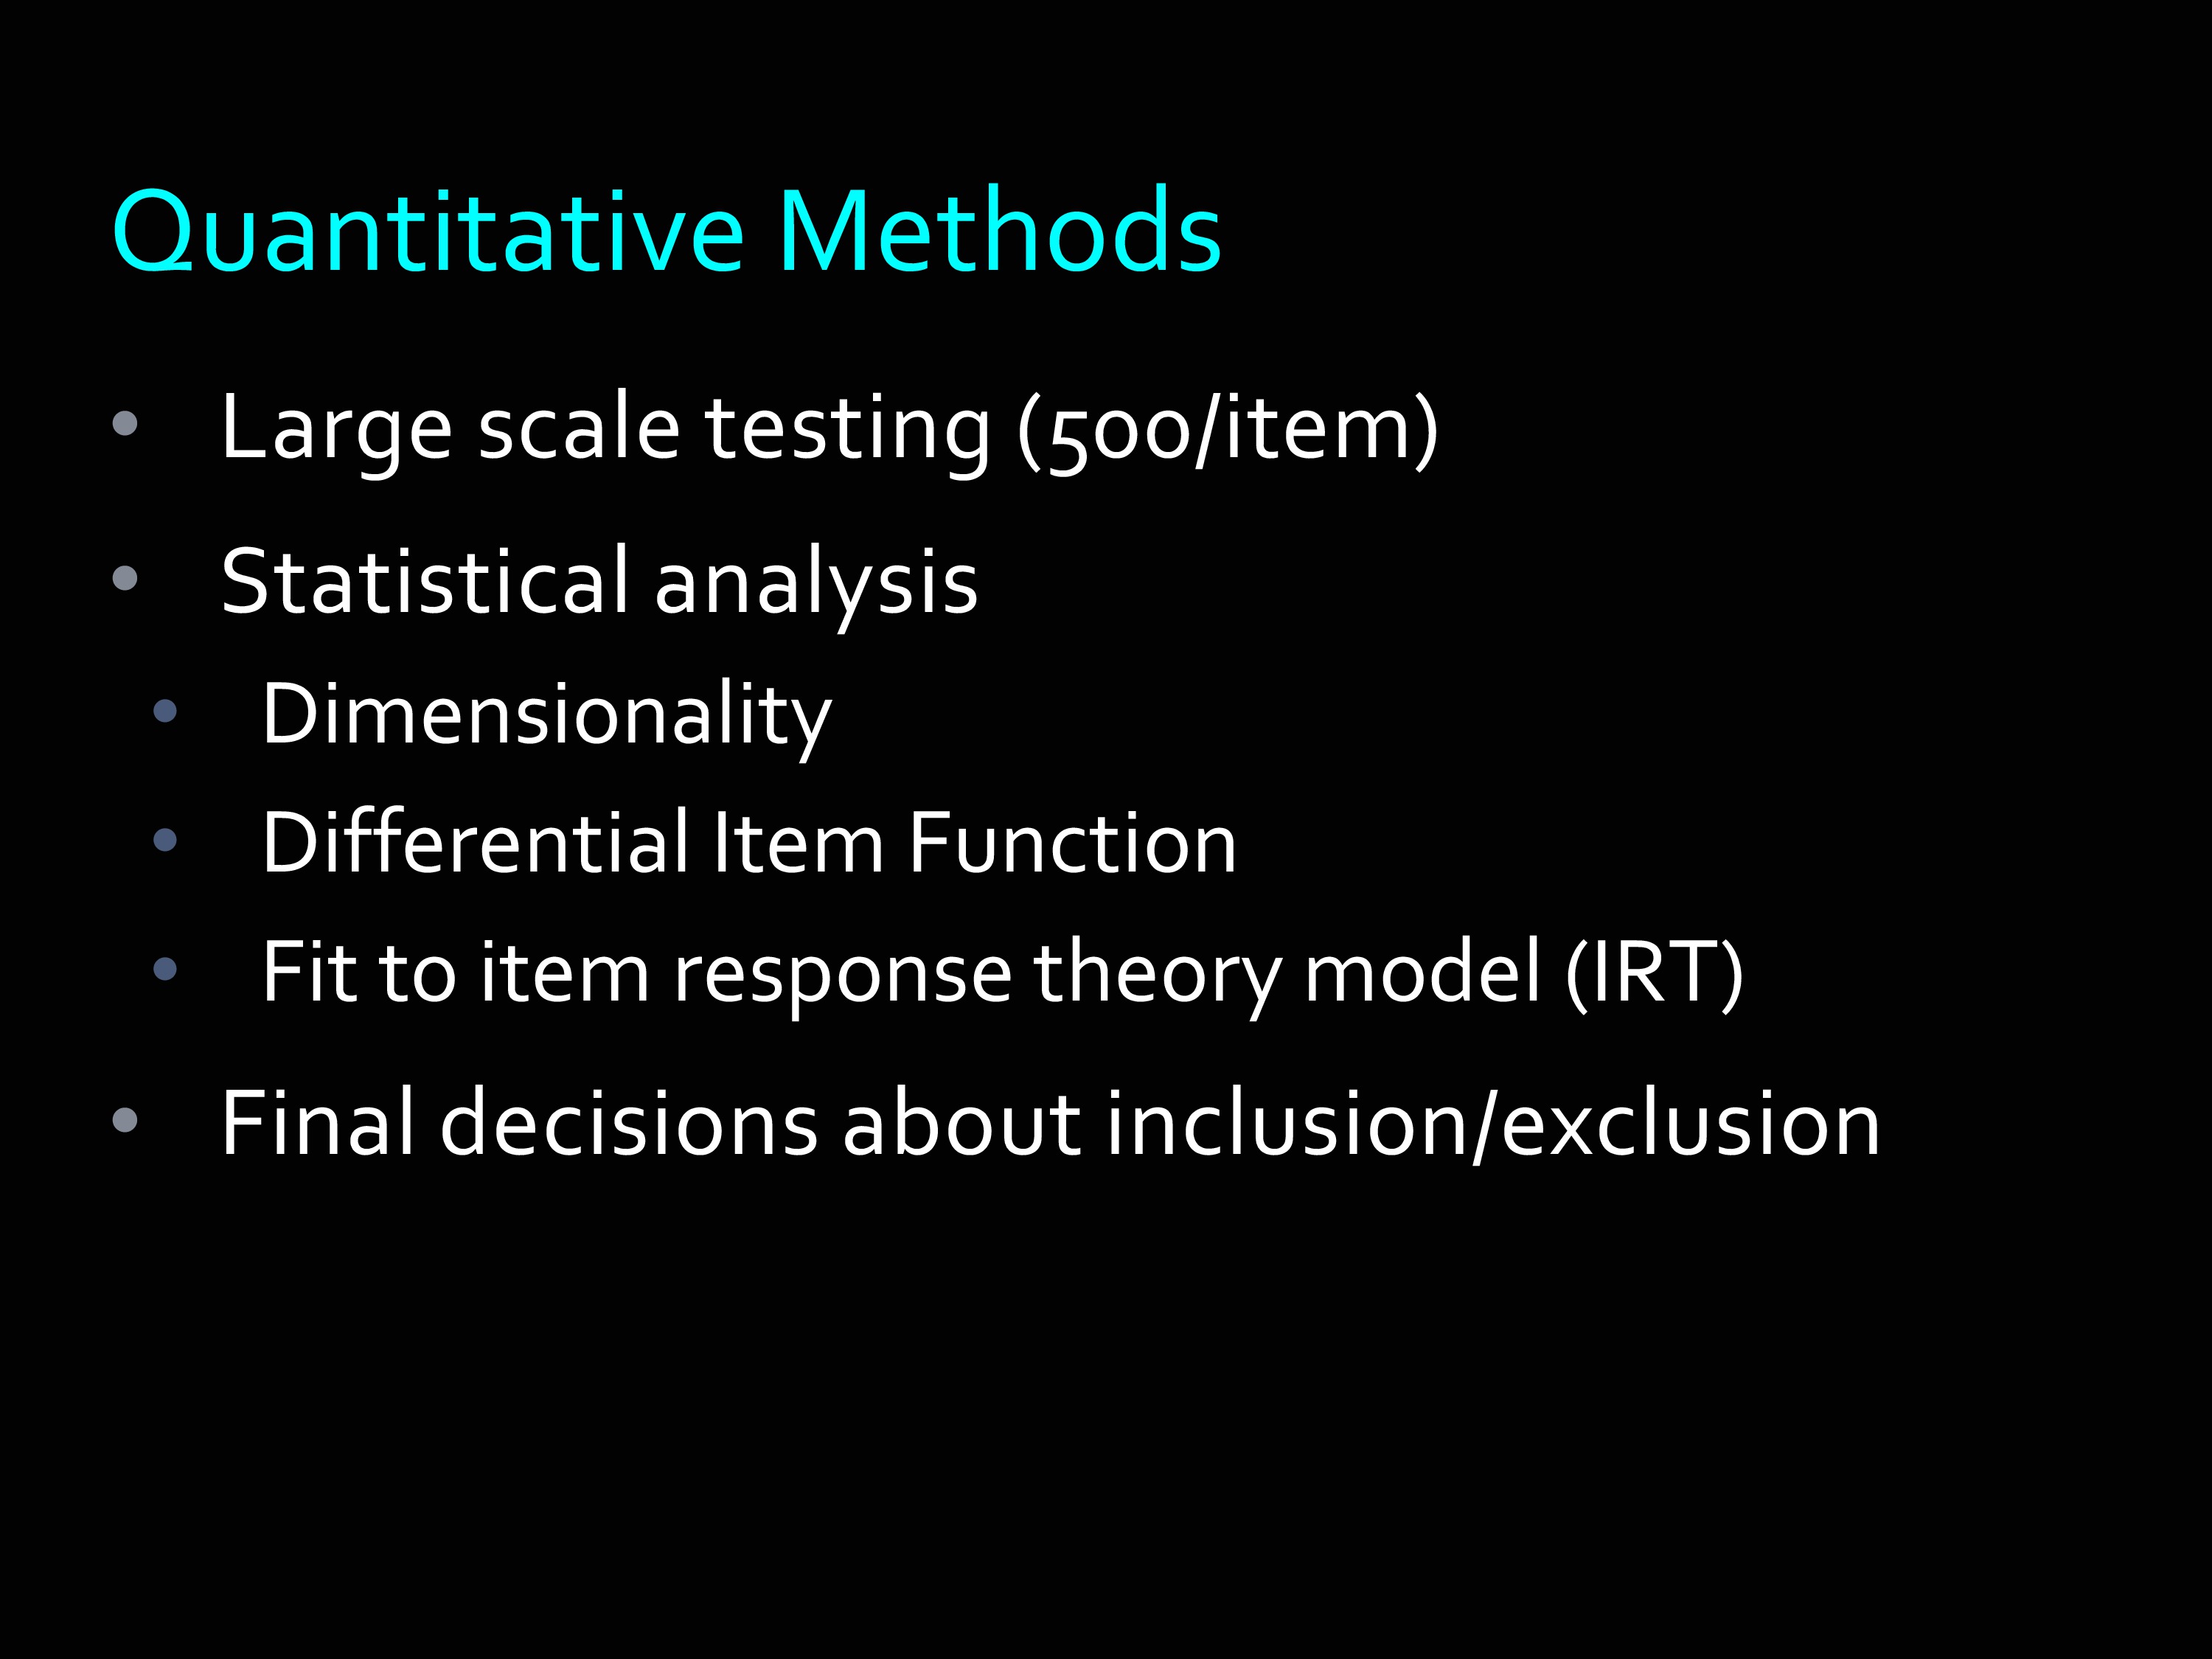
The quantitative methods. We did large scale testing. Made sure that at least 500 people answered every single item. There were actually greater than 20,000 people in the very first collection of data for PROMIS. There had to be 20,000 because there were so many items that were tested.
Then the statistical analysis, you’ll recognize some of these, dimensionality, differential item function, and whether they fit to the mathematical model that we’re using to calibrate all these together — item response theory.
Finally, final decisions were made about whether to include items in the bank, or exclude items in the bank. I think the largest banks have close to 80 items. Then there are some that have under 30 items. So the number of items included in the final banks depended on the quality of those items.
Item Banking: Delivery and Administration
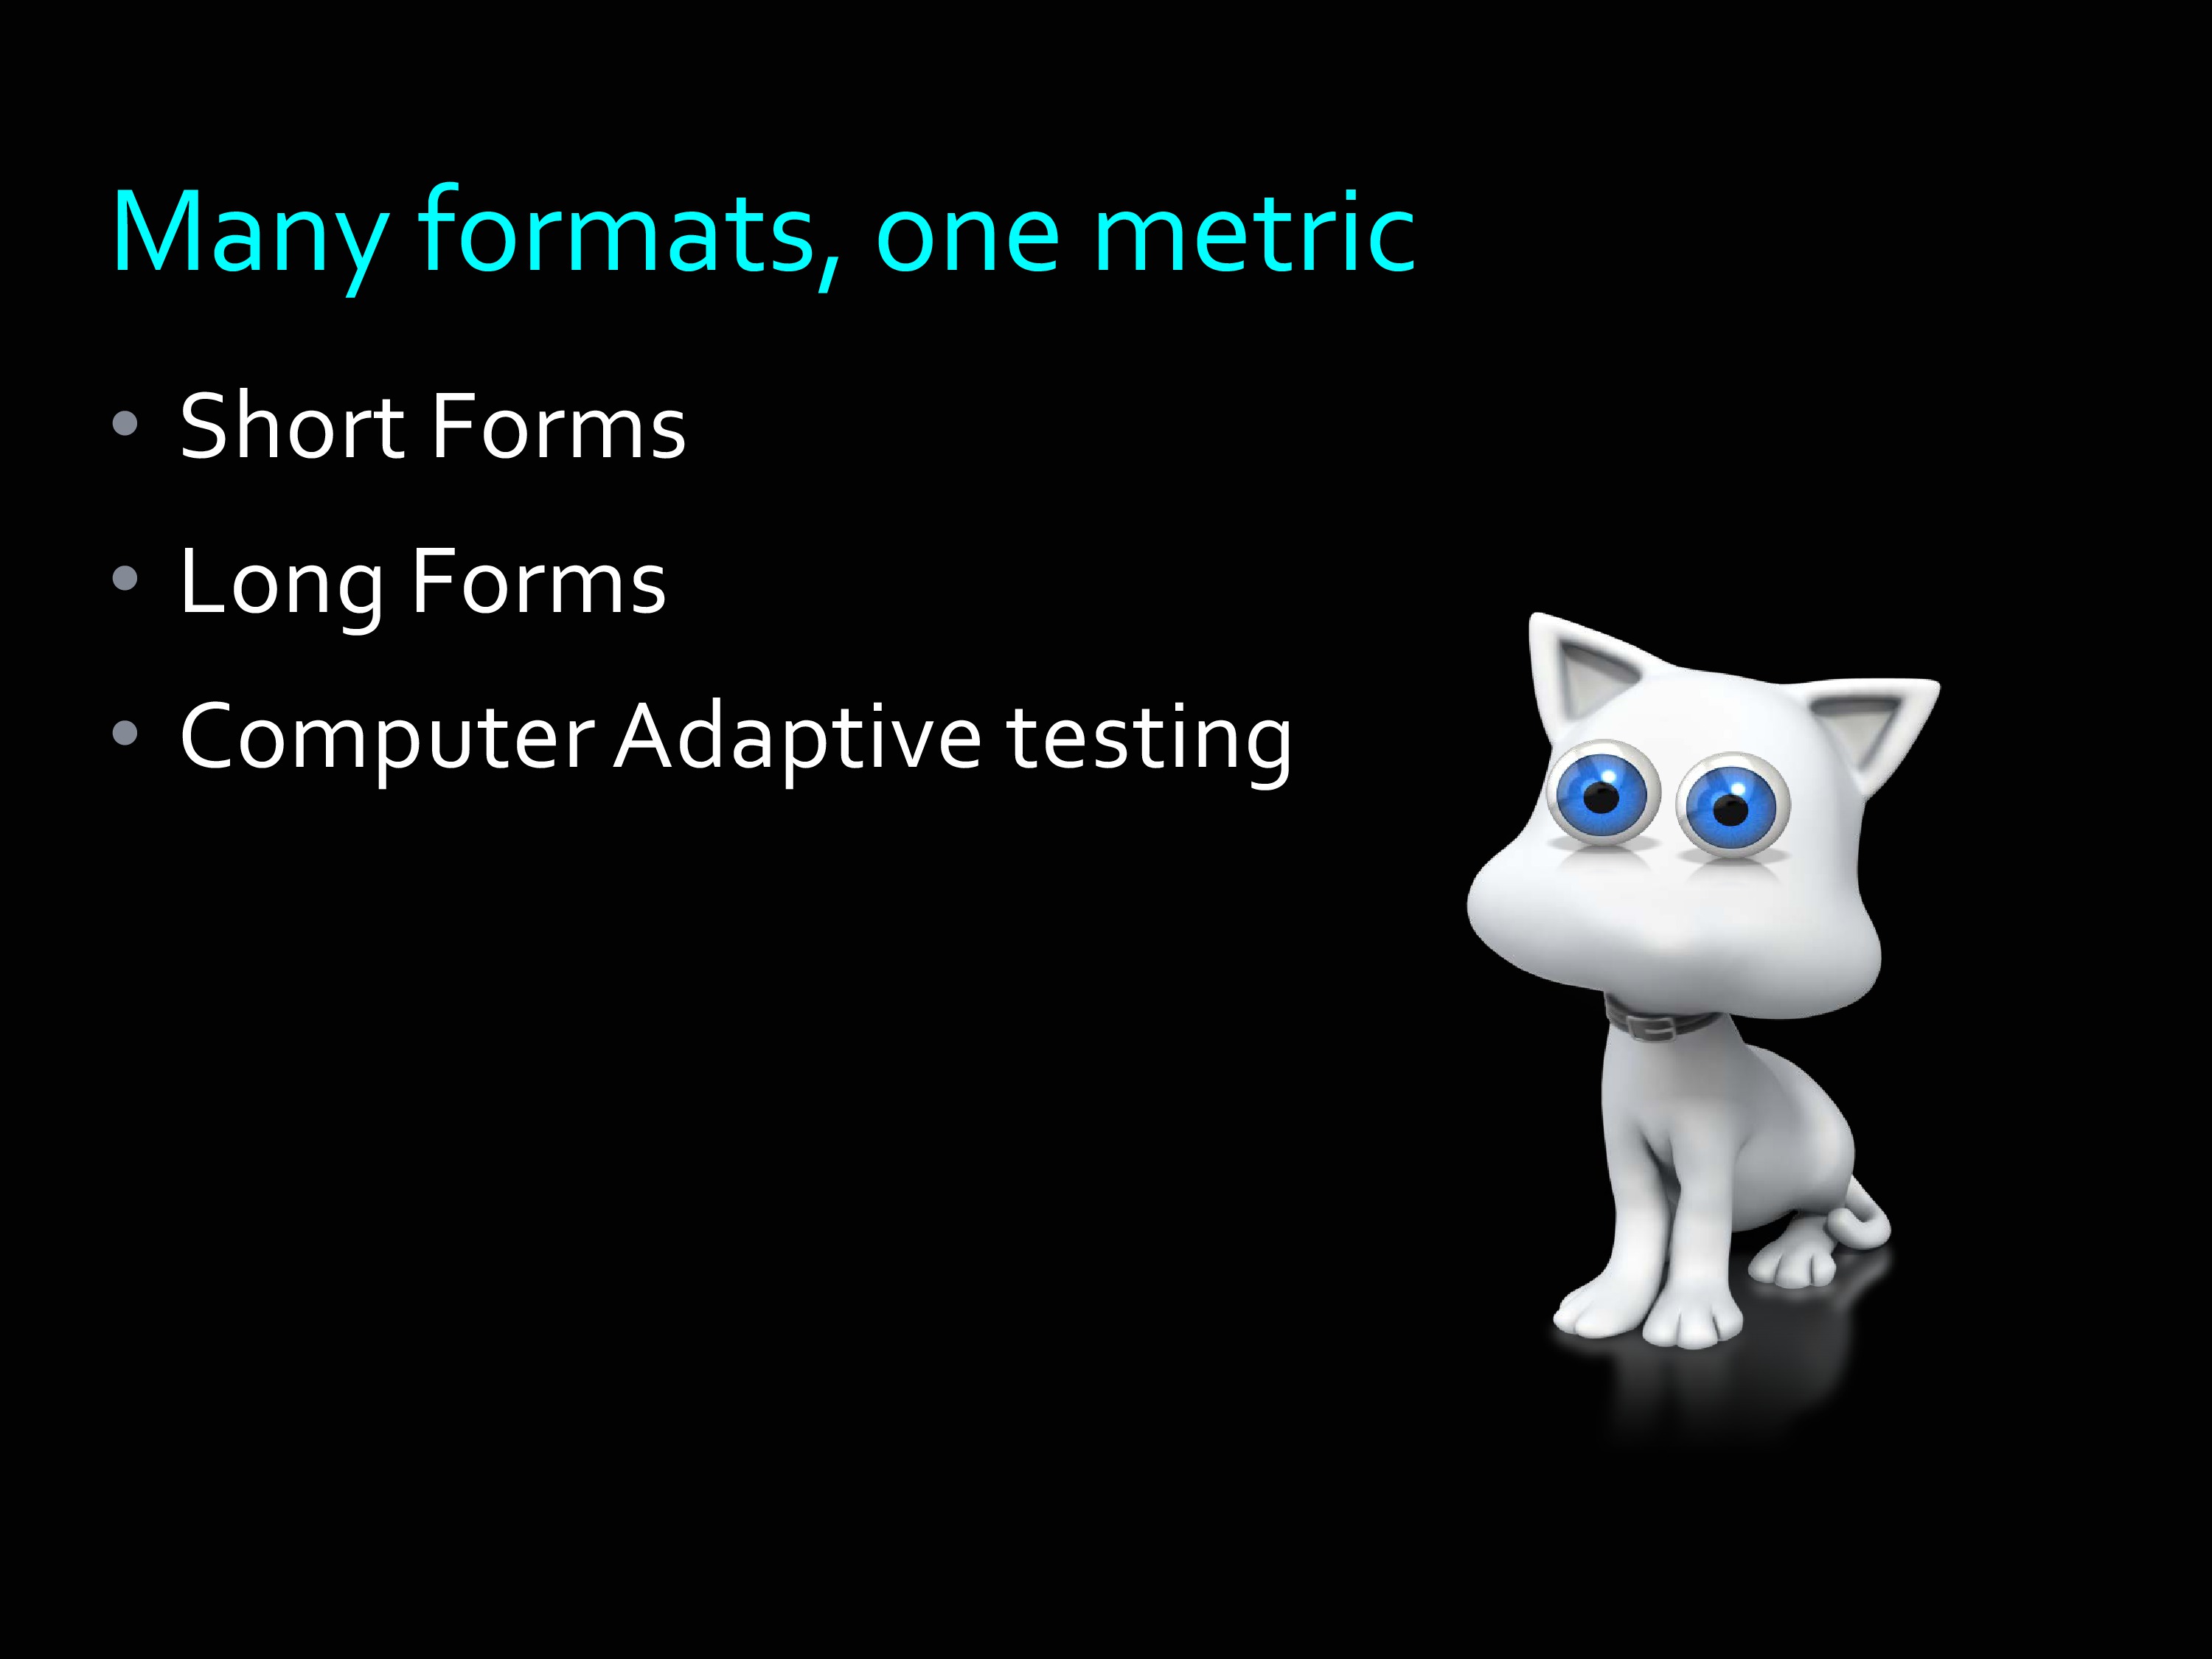
Again, it’s an item bank. You’ve got many formats, but one metric. The idea is you can have a short form on the same metric, a long form on the same metric, and also computer adaptive testing — which has the acronym CAT, which makes it very fun to develop slides for.
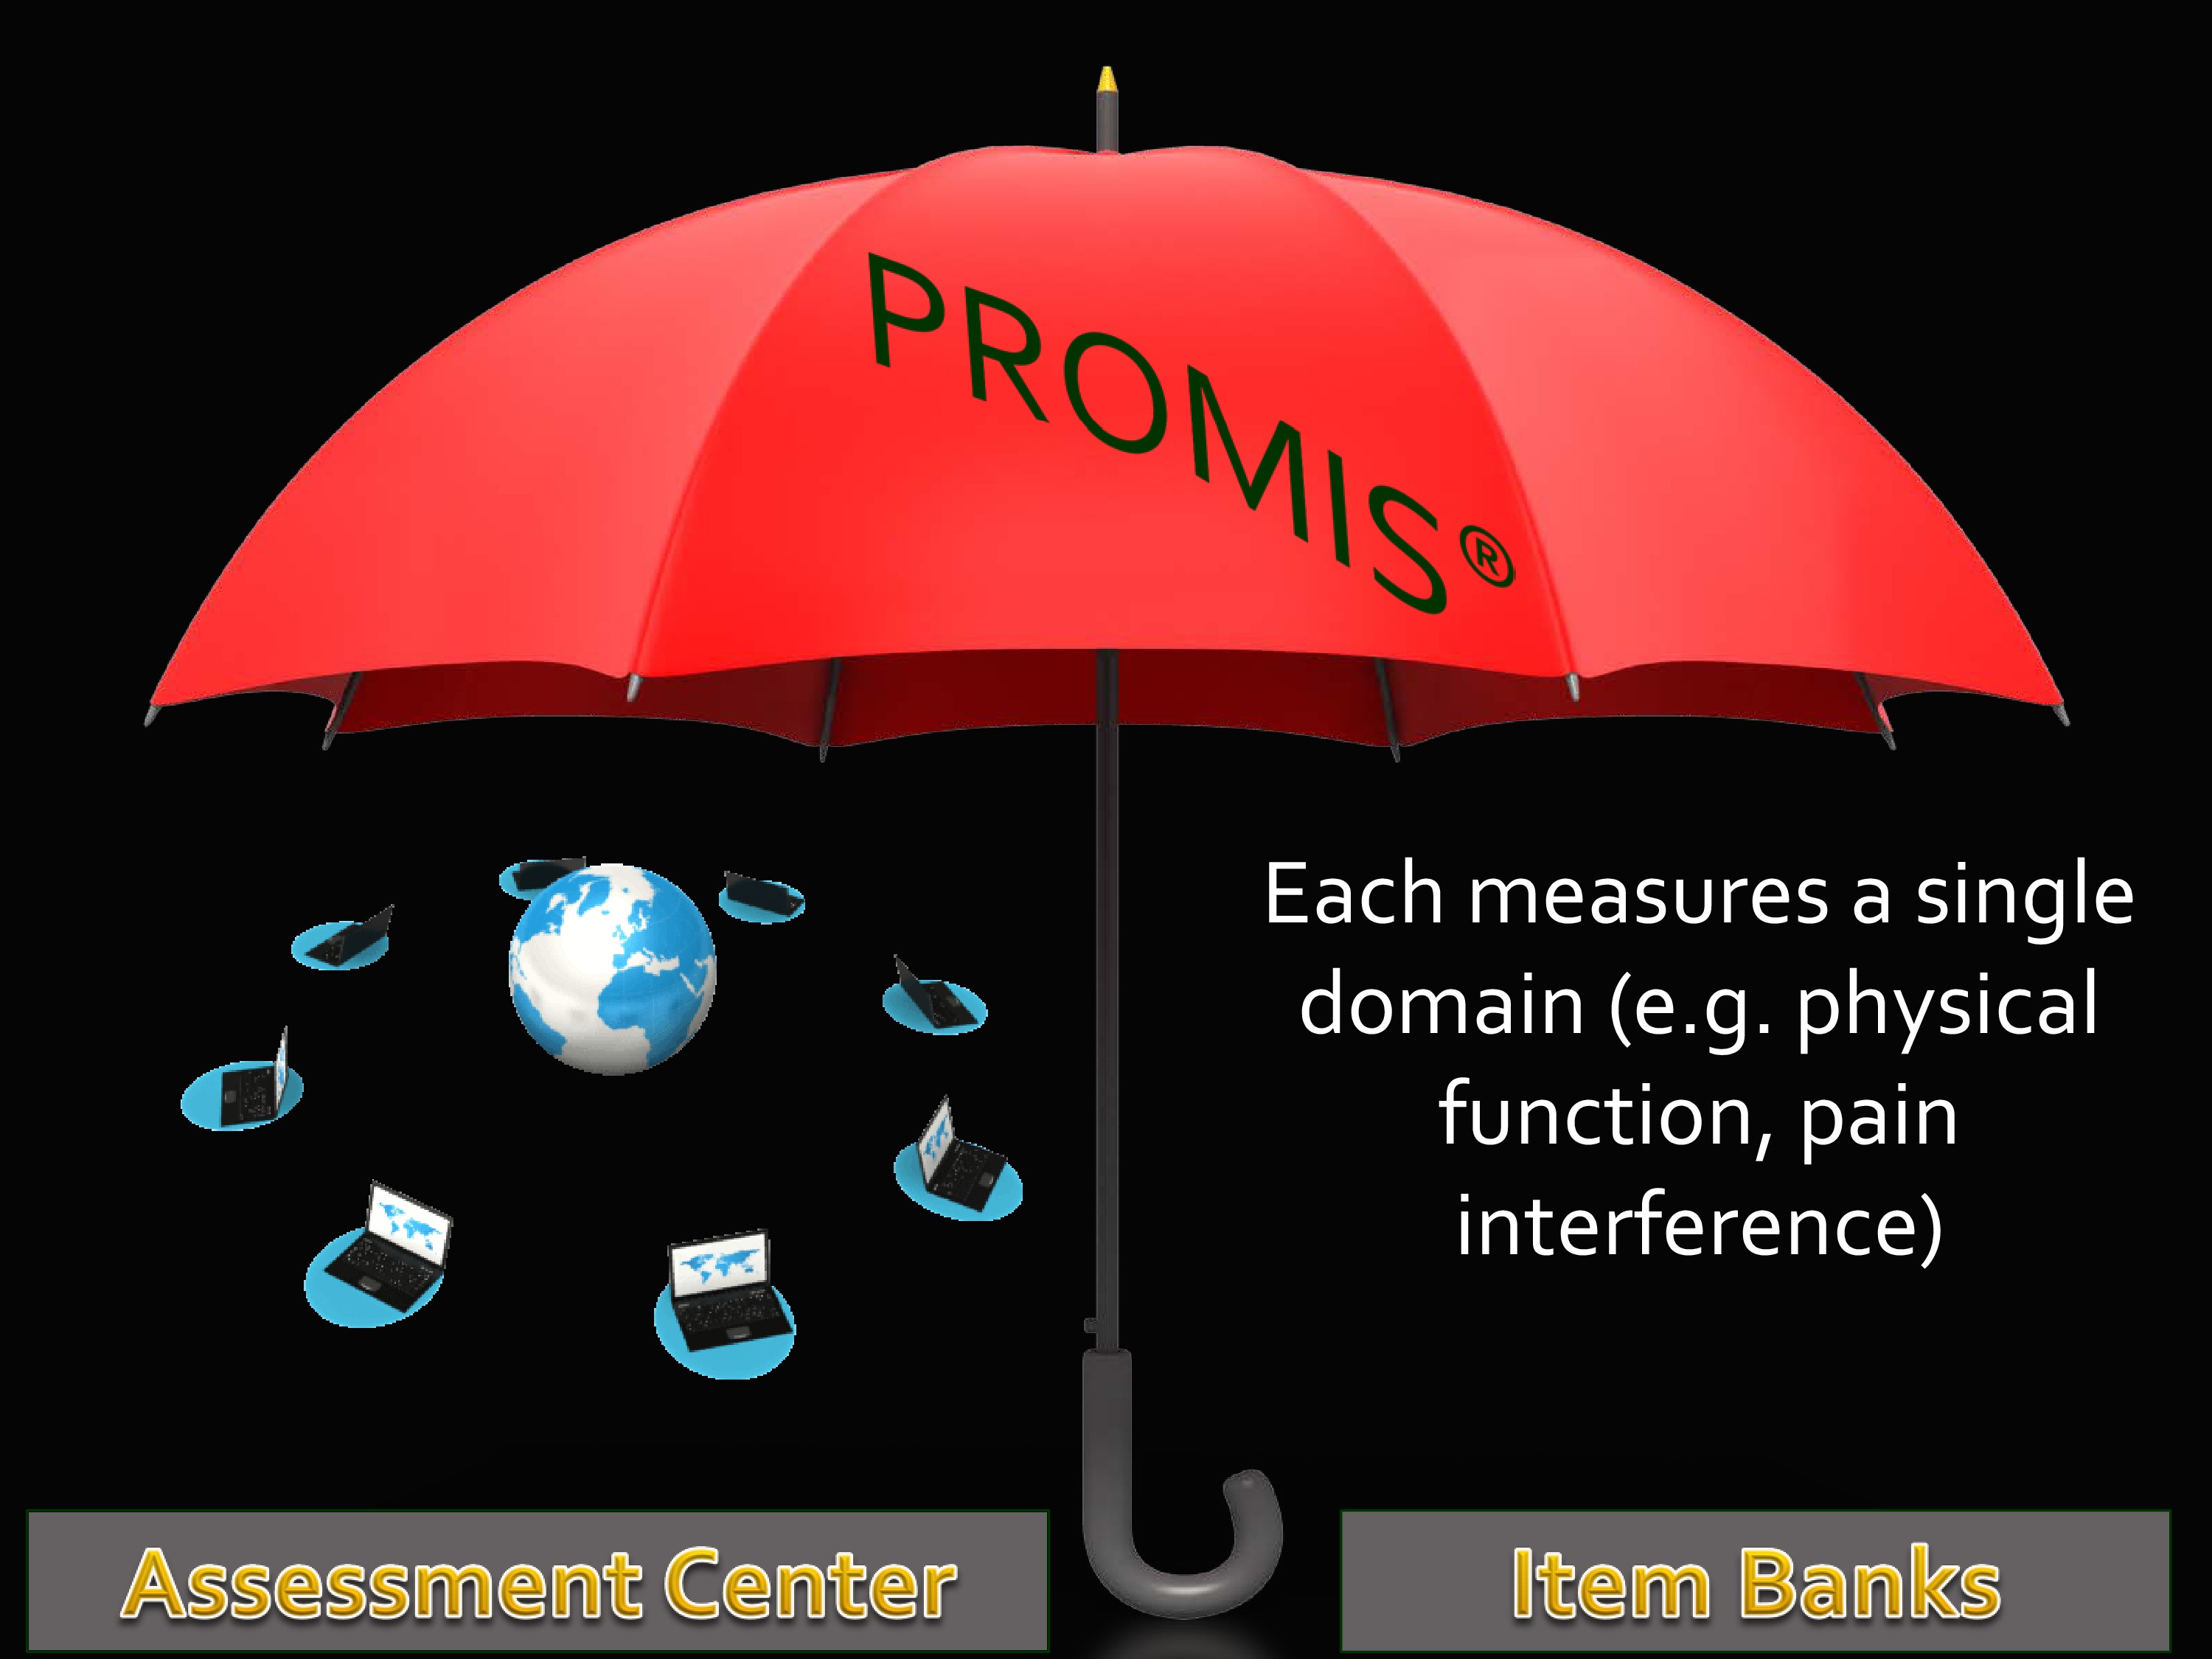
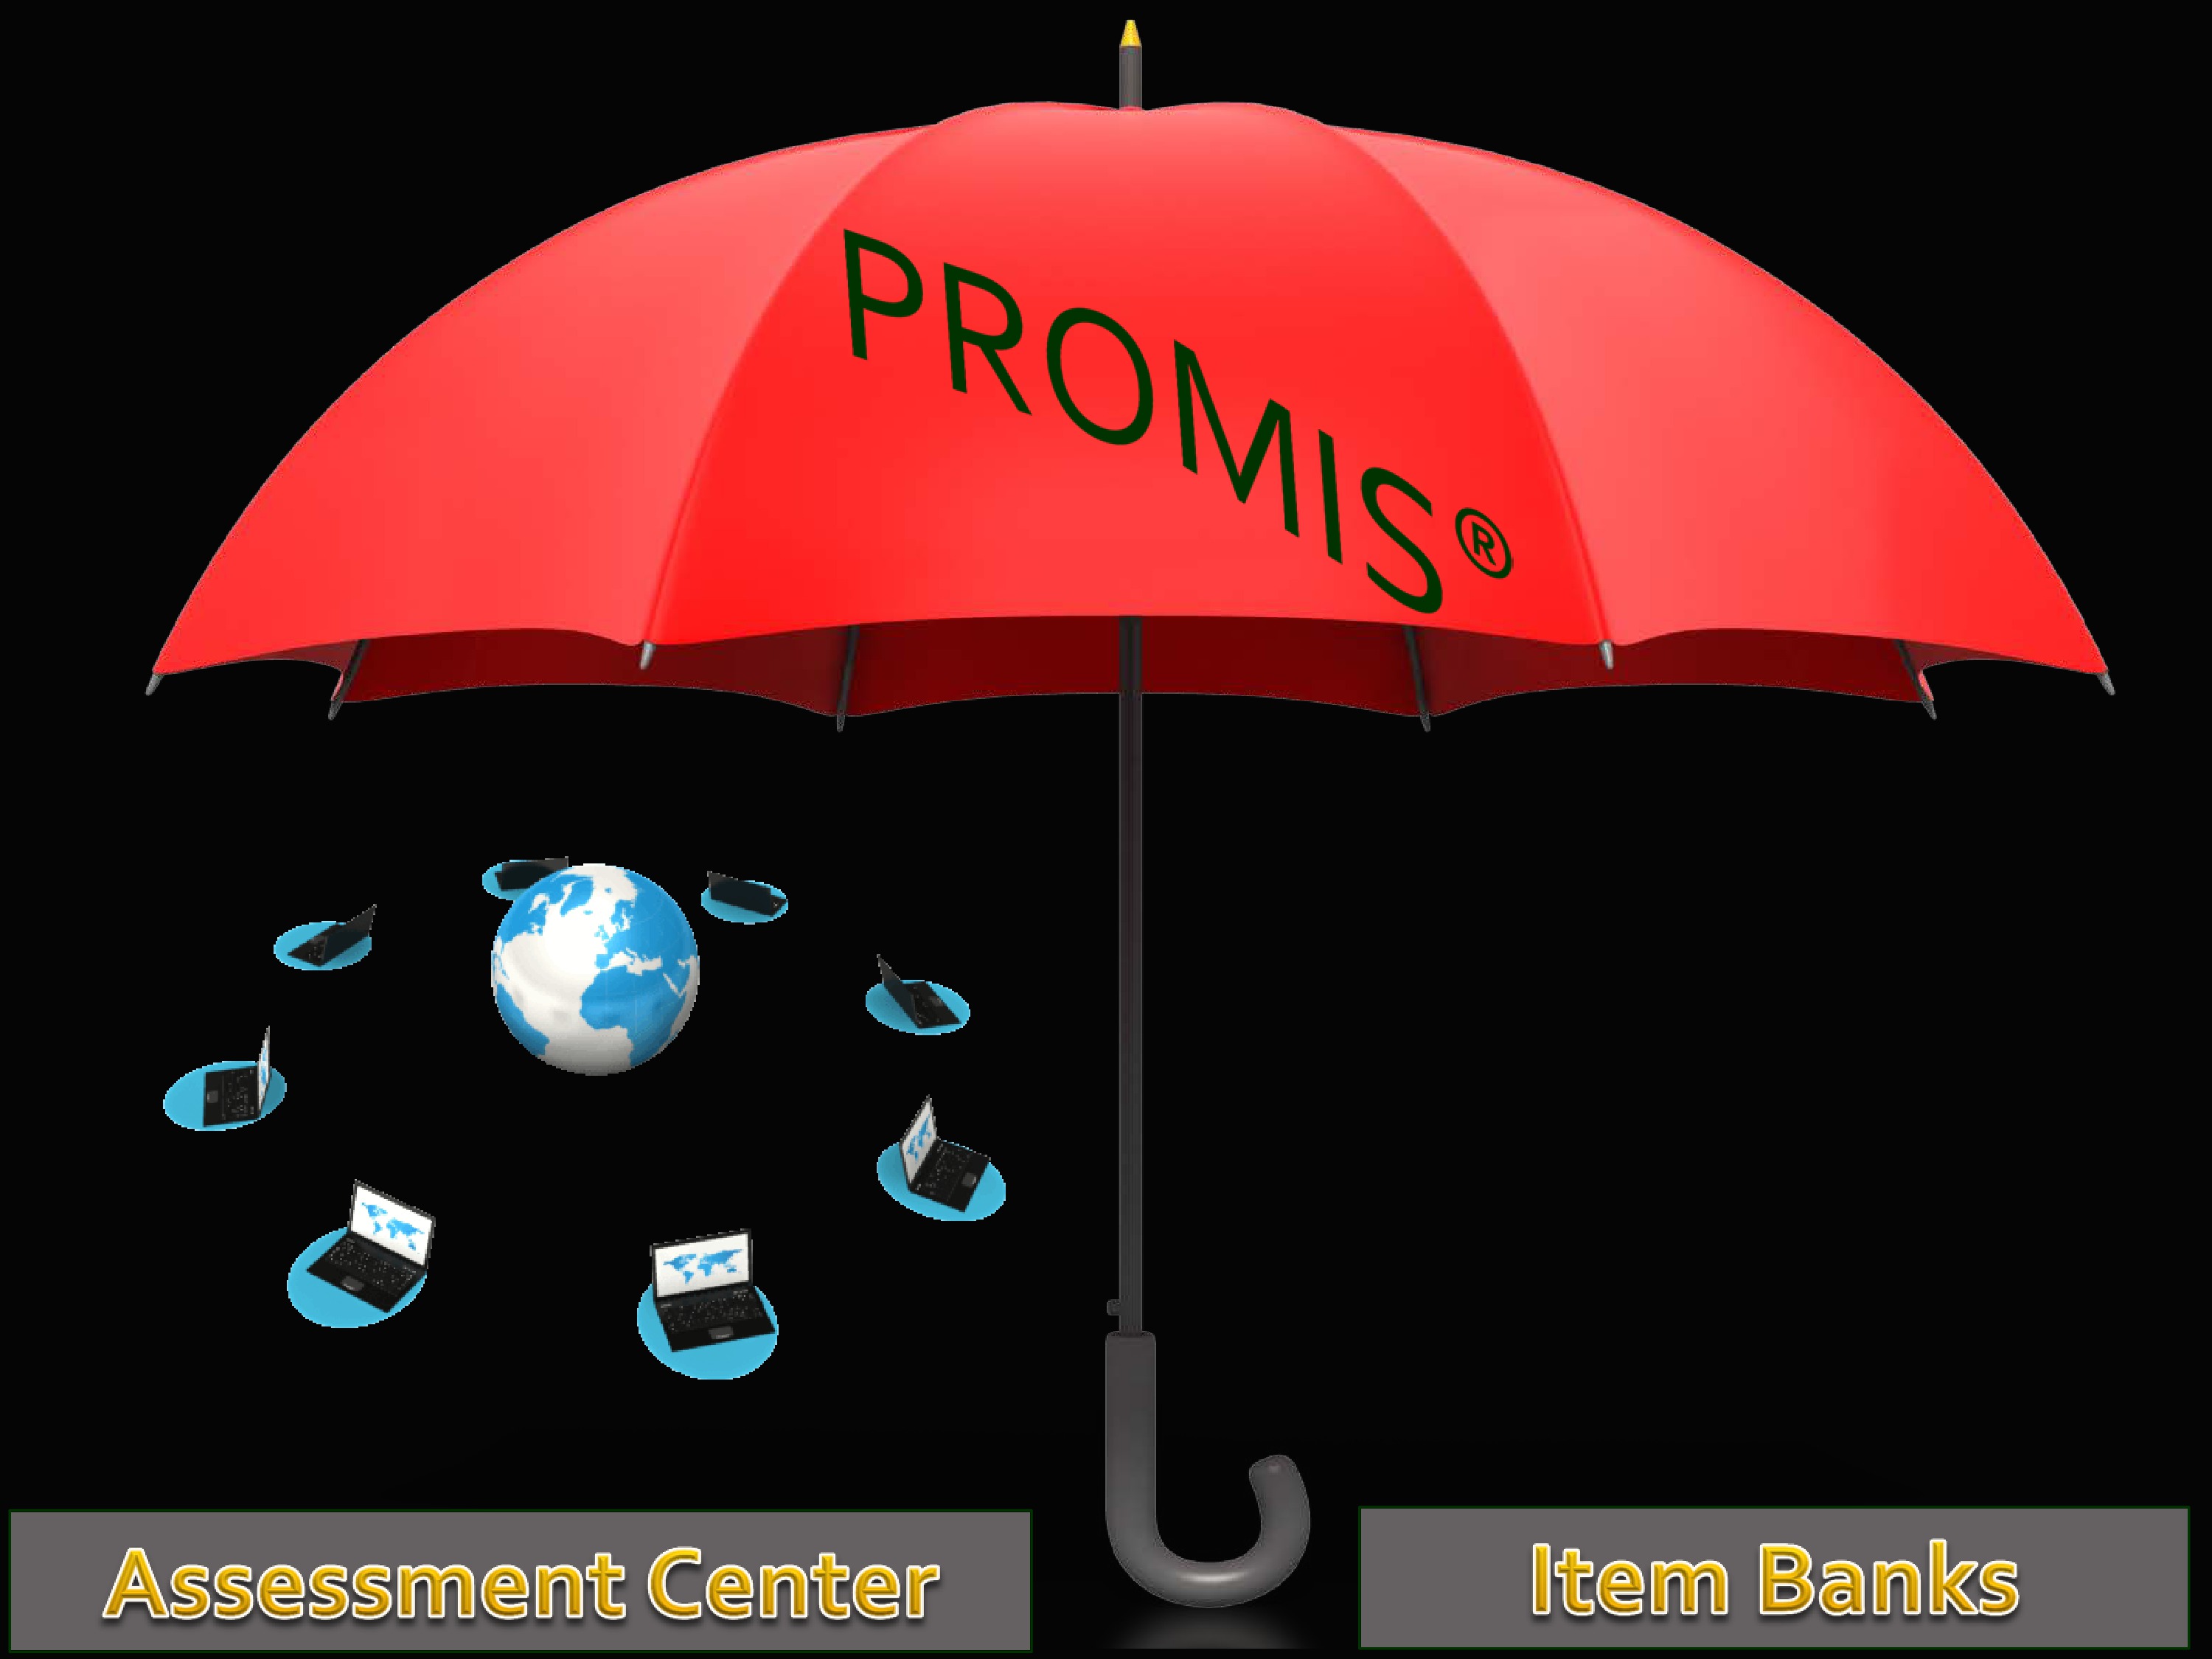
Let’s take a look at the PROMIS umbrella. Because there are a couple things in the PROMIS umbrella, and it’s easy to get it confused. Here’s where we’ve got some animations that may help make some sense of what I said earlier.
Under the PROMIS umbrella, you’ve got this collection of item banks that I’ve just described. These are sets of items, all measuring a single construct, they are unidimensional. They are all calibrated to a common mathematical metric.
The other side of PROMIS is called the Assessment Center, which I’ll tell you more about in a little bit. But I want you to know we’re talking about two different things. One is the content, what the actual measures are. The other is how they get delivered and administered.
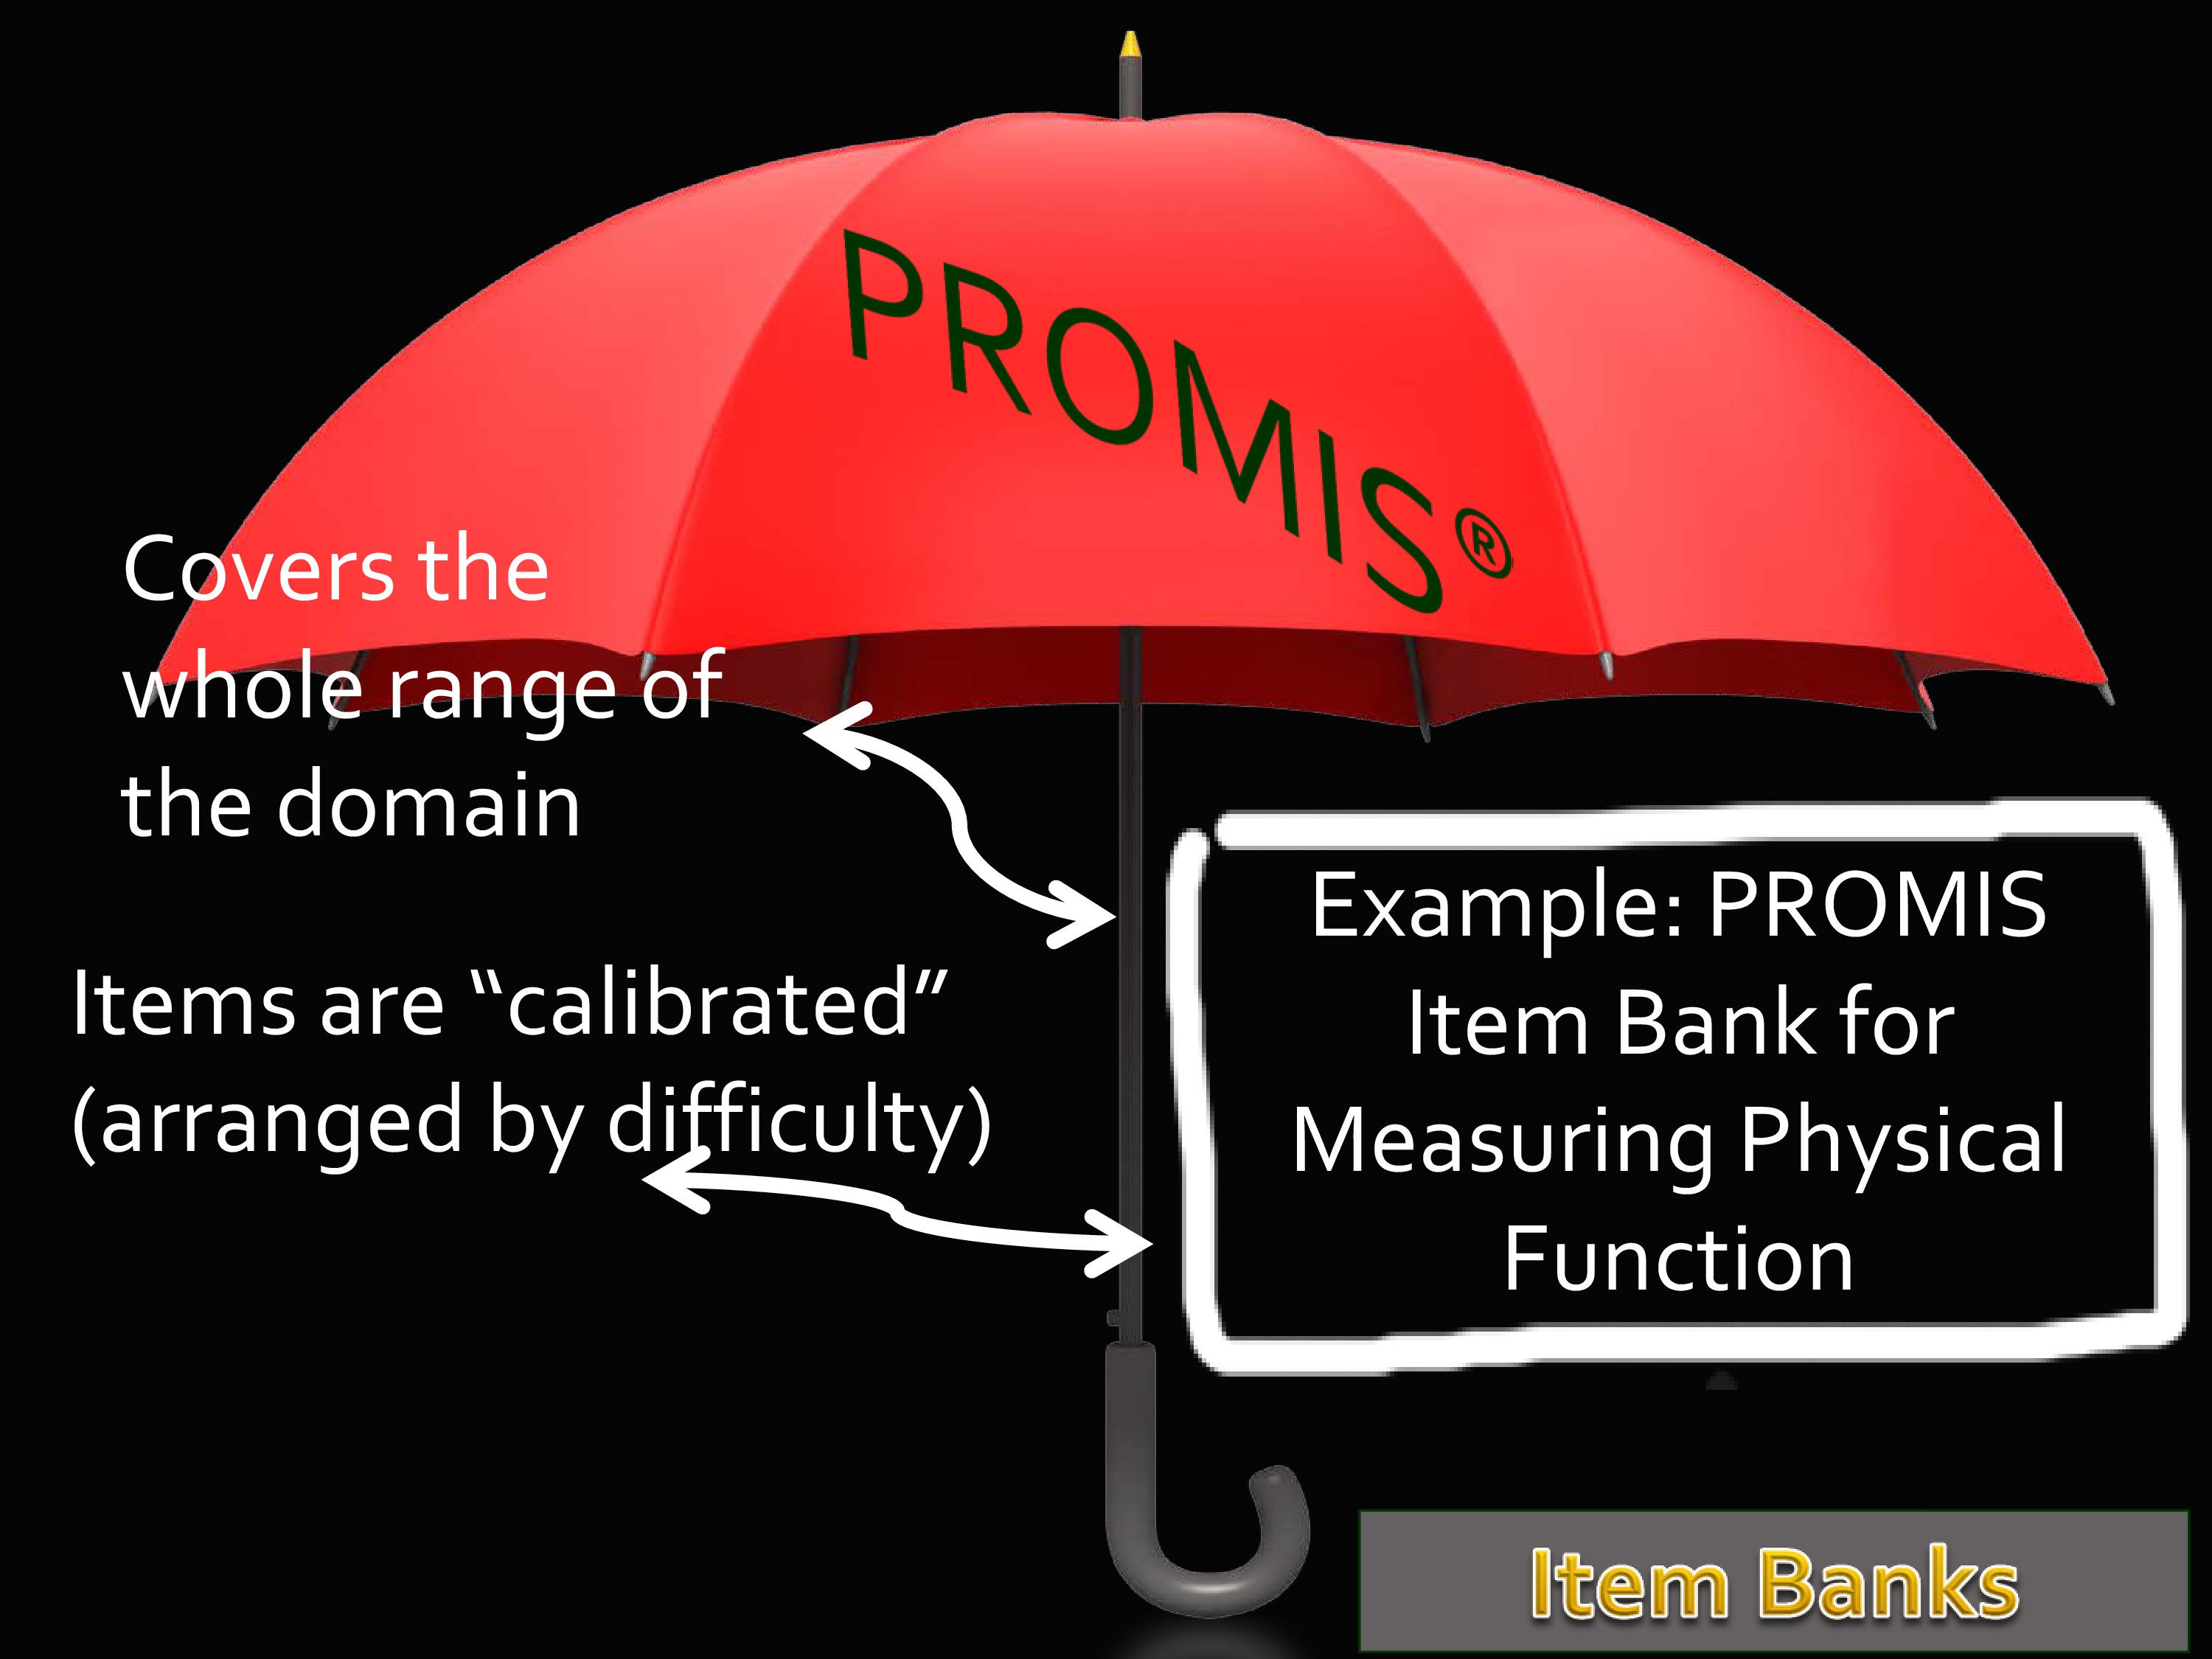
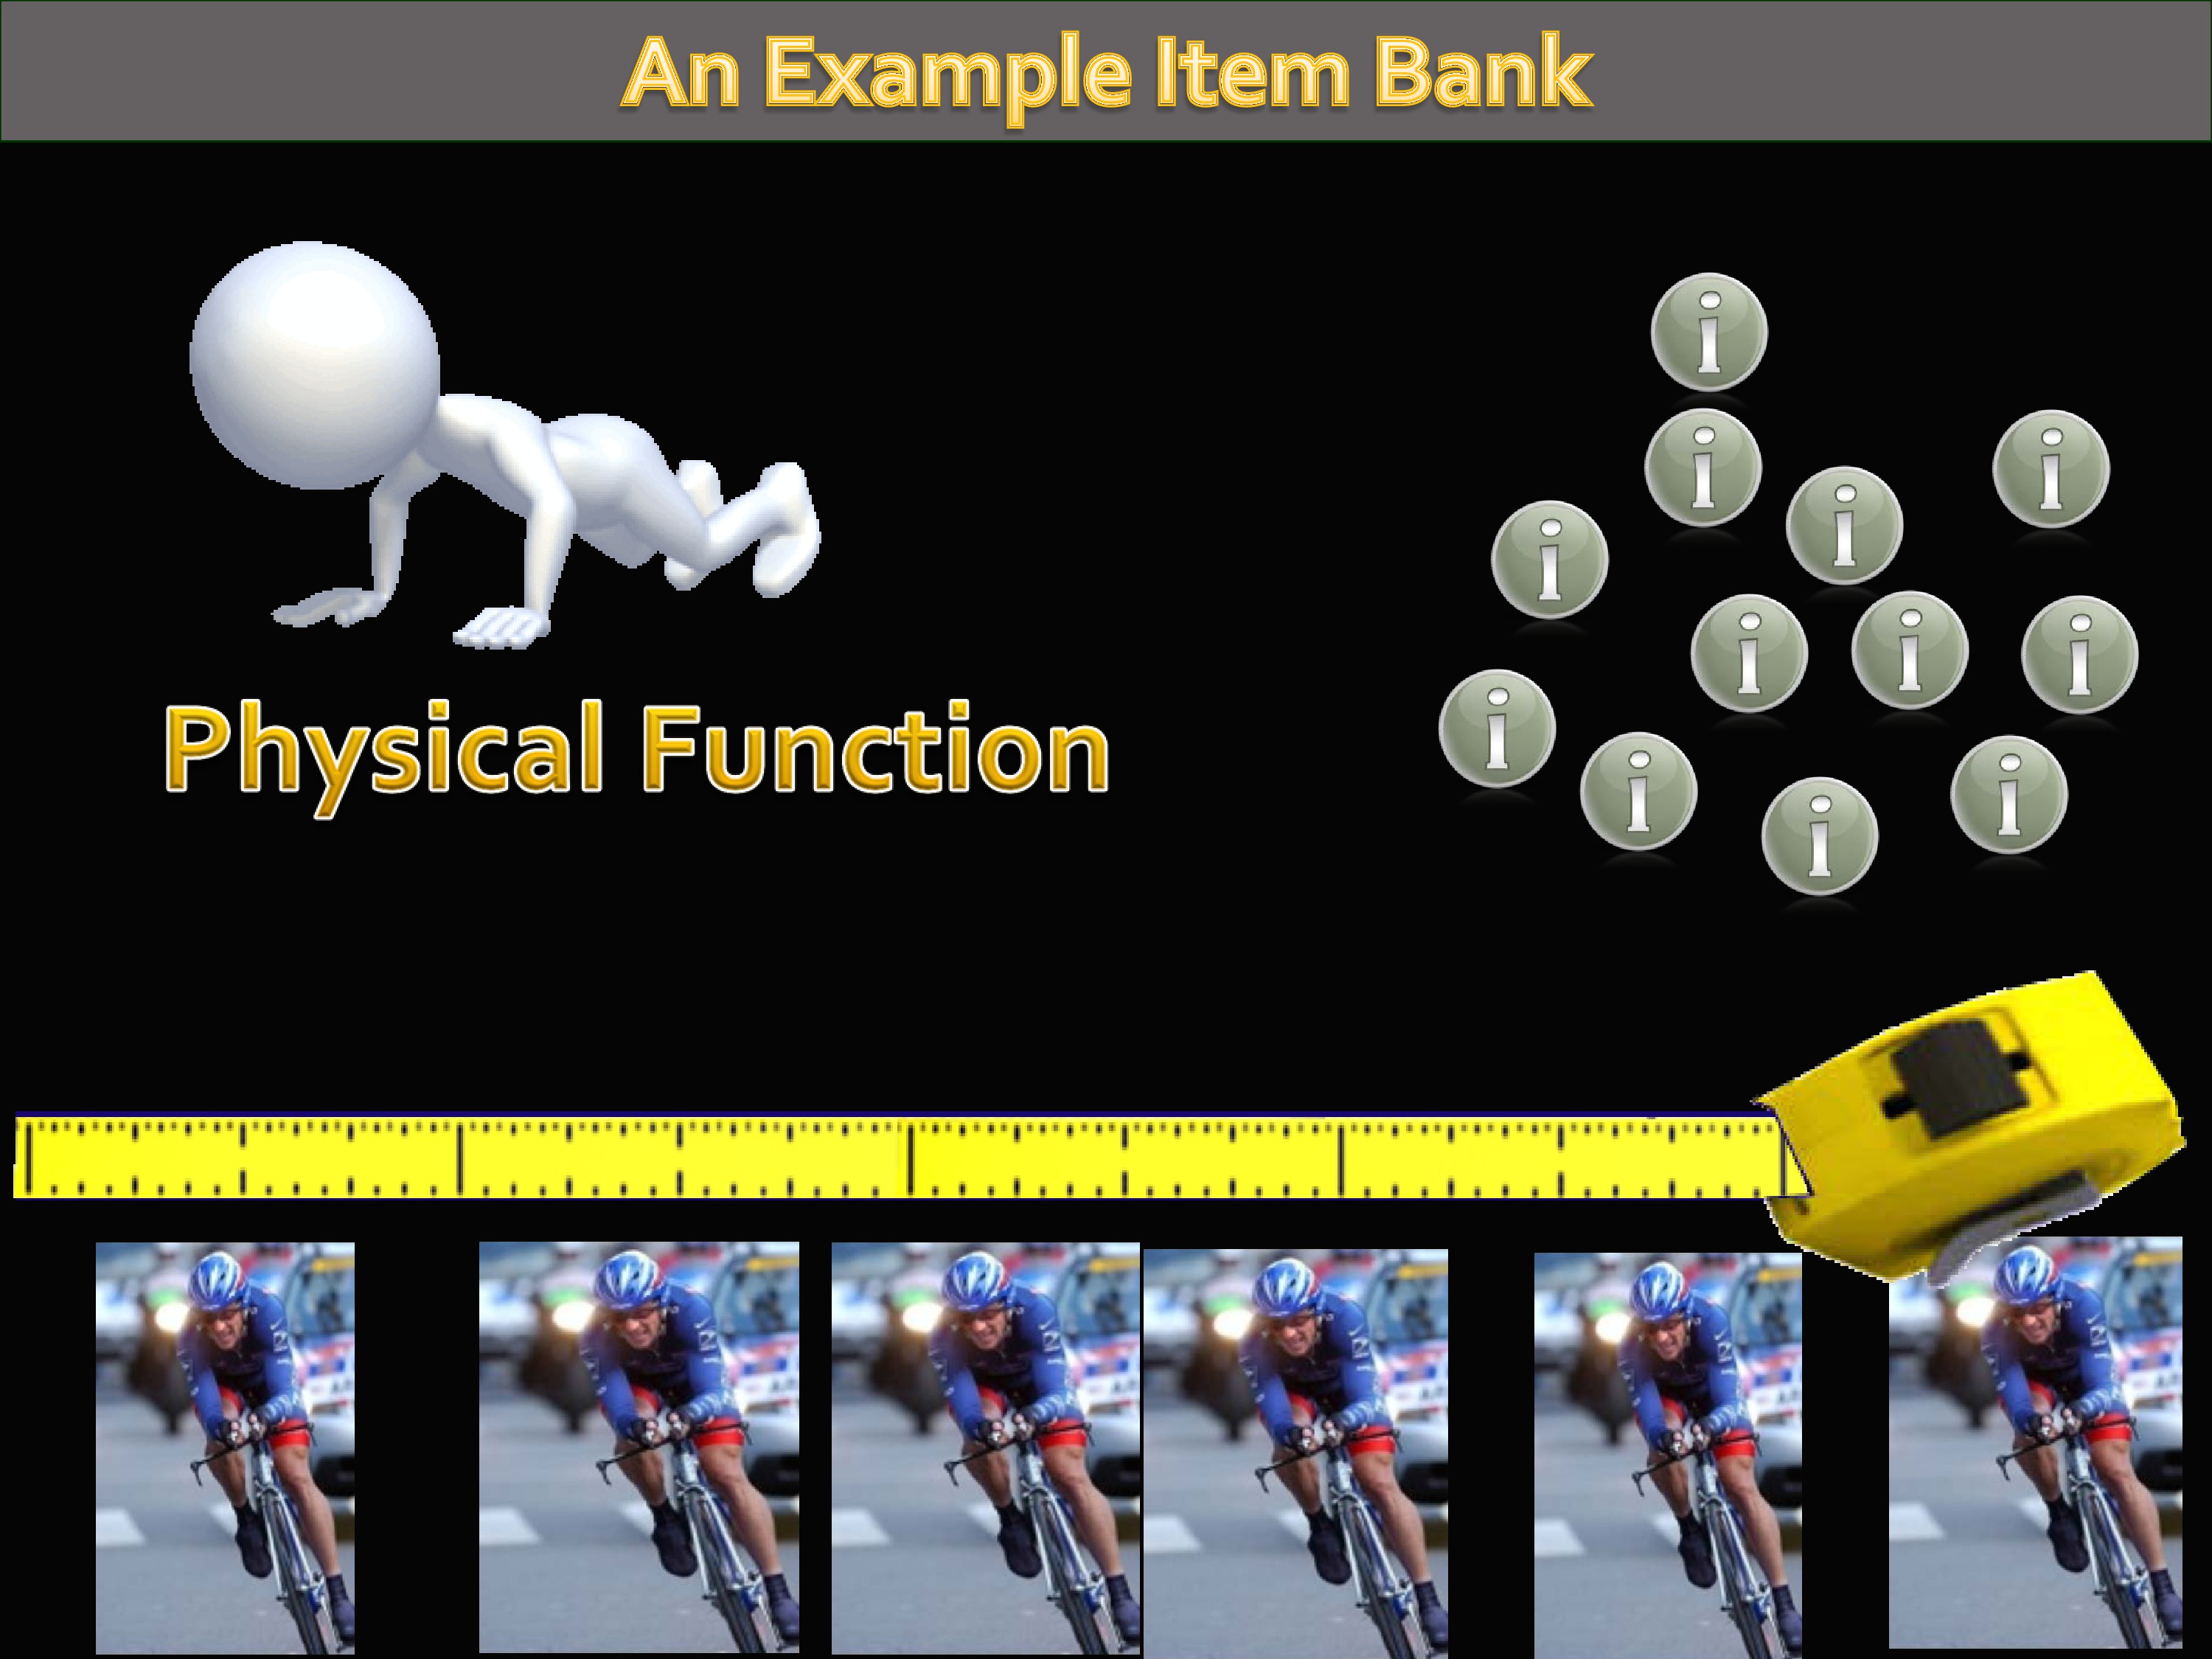
Lets start with item banks. I’m going to use for the next few slides the example of physical function, because it’s an easy one to make this make sense out of.
One thing about an item bank, in addition to having all the quality items like we talked about, we really want to make sure it covers the whole range of the domain. If you’re measuring physical function, it would not be appropriate to only include items about mobility. Because physical function includes things you do with your hands, it includes a lot of stuff. It’s important in terms of the construct validity that it is not limited to subsets of the domain that you are measuring.
It is possible to divide up. So you could have an upper body and lower body — in fact we’re working on that — physical function banks. But whatever you call it, it should include items that cover the full range.
Then next thing that happens is we apply some mathematics and items are calibrated to a common metric. Think about that as just being arranged by difficulty.
To view the animated demonstration for this slide, please refer to the presentation video at timecode 14:40.
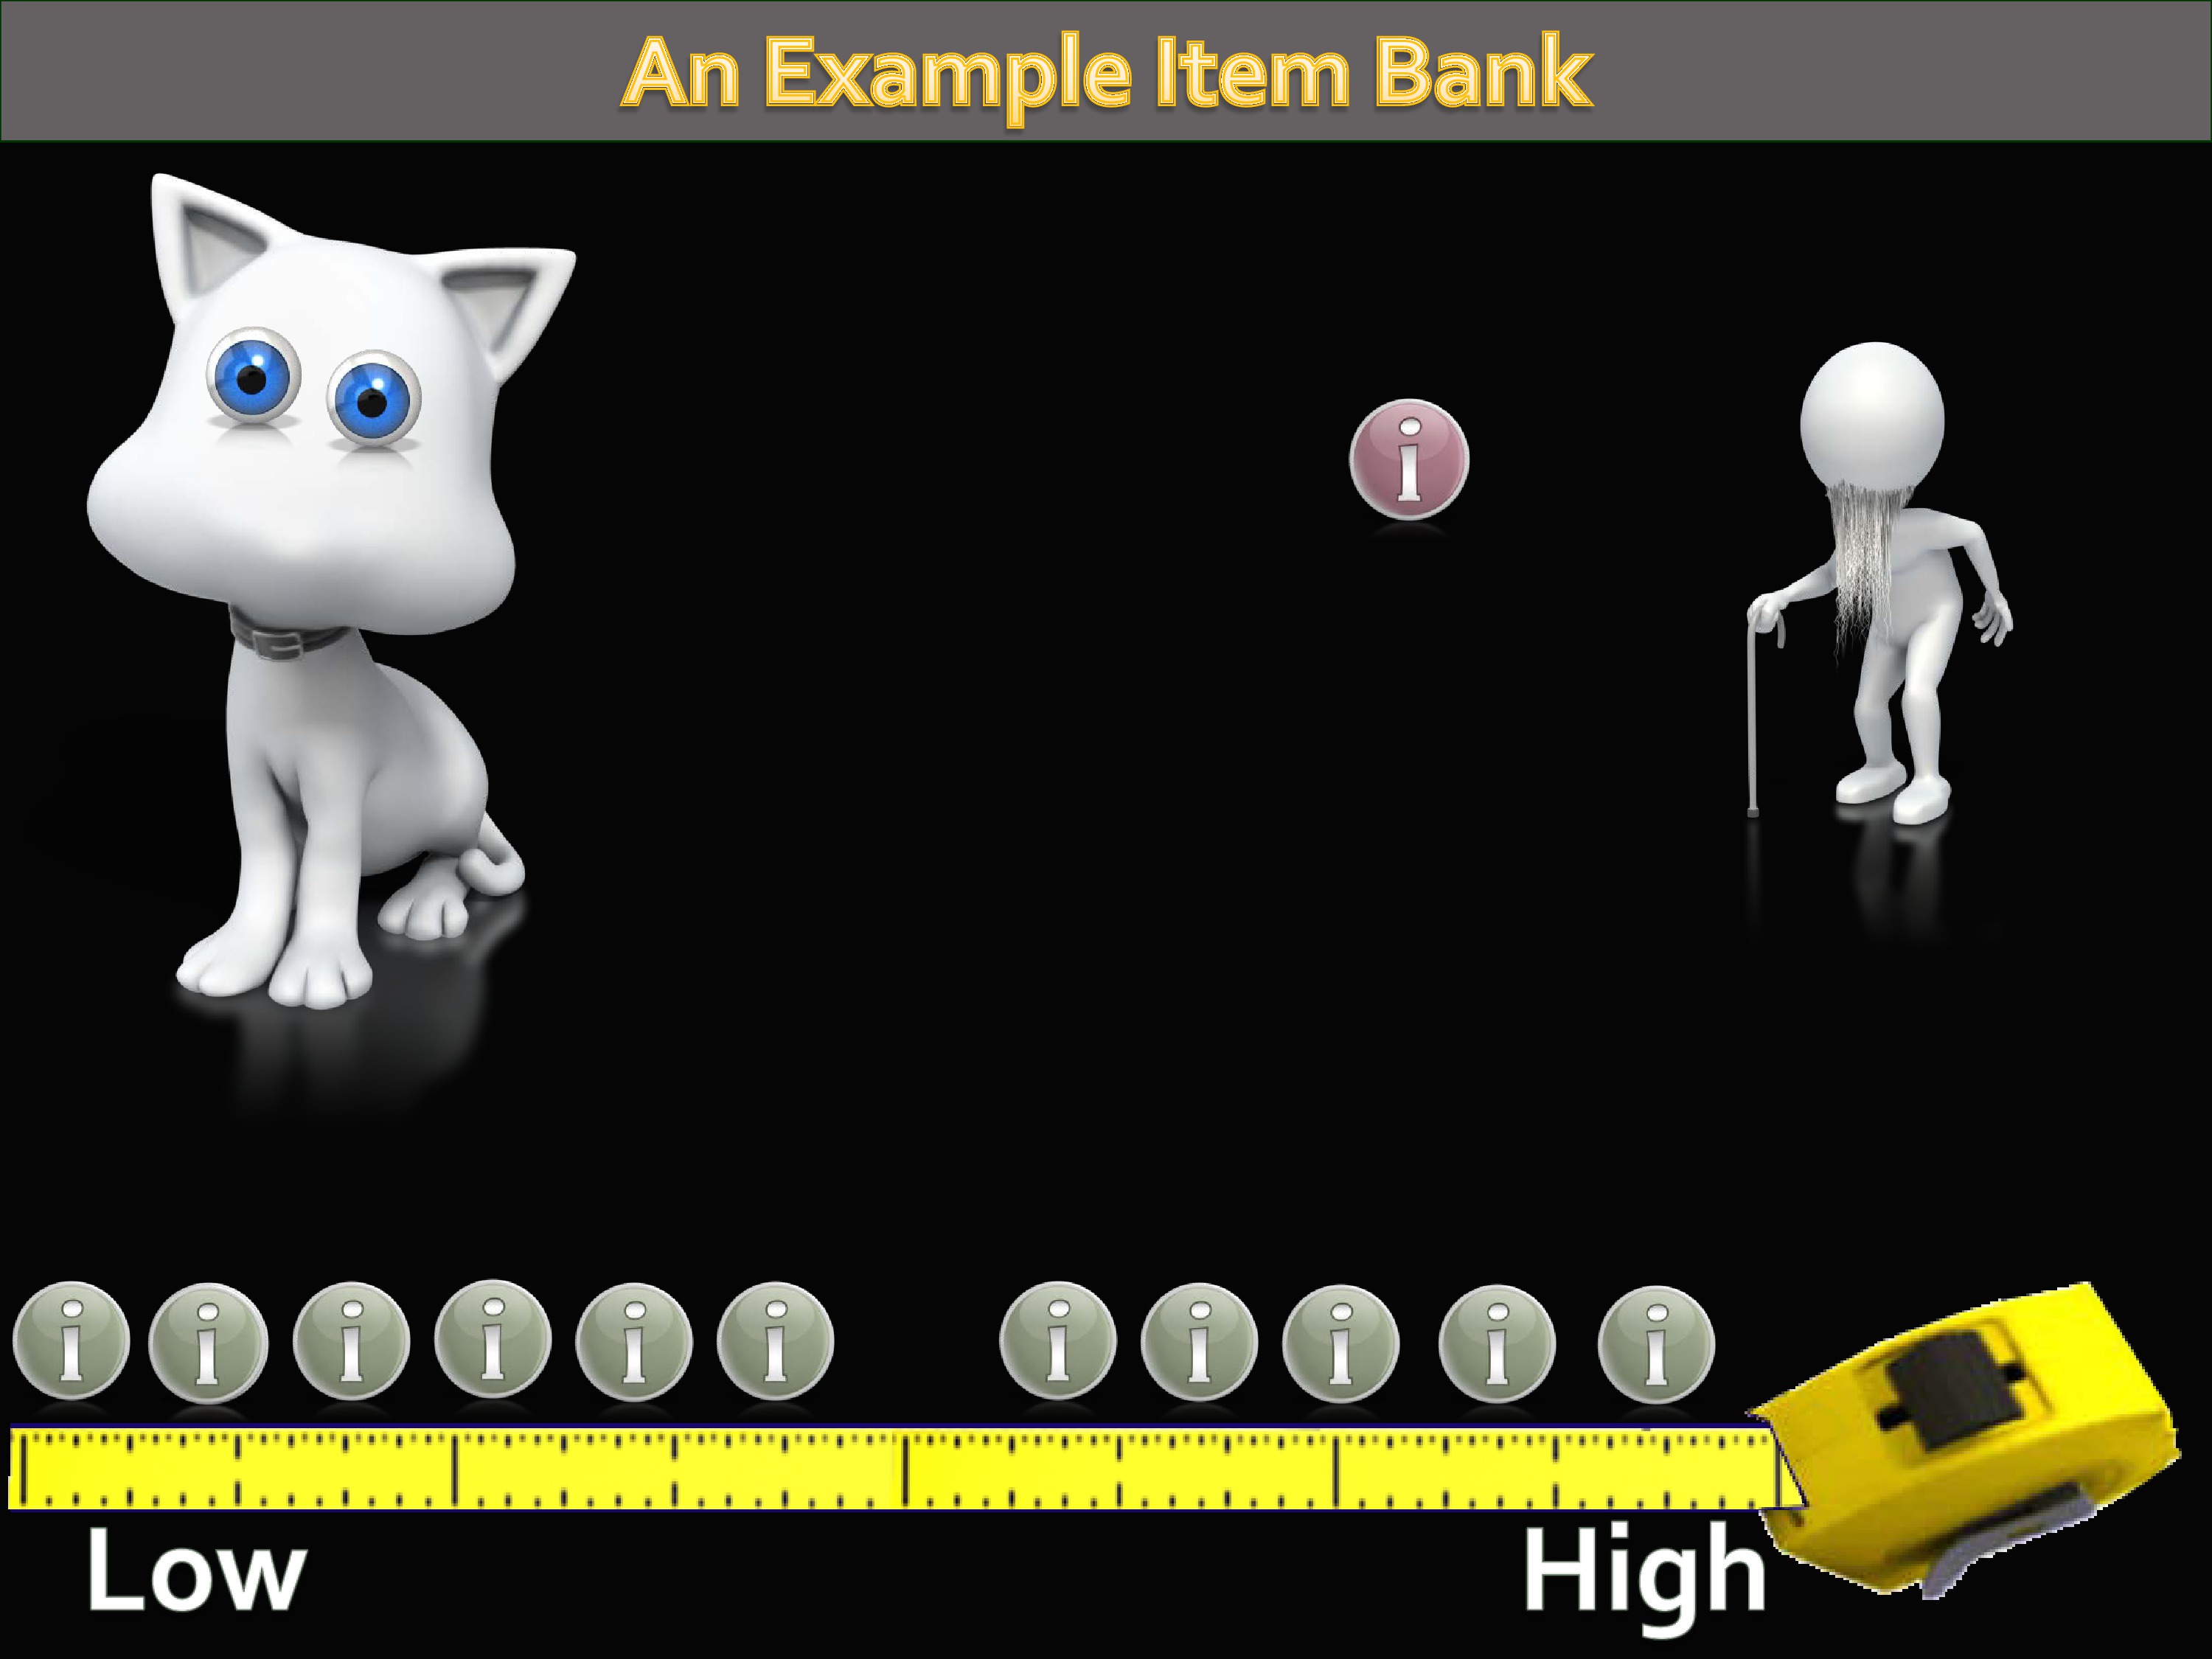
Let’s take the example of a physical function item bank.
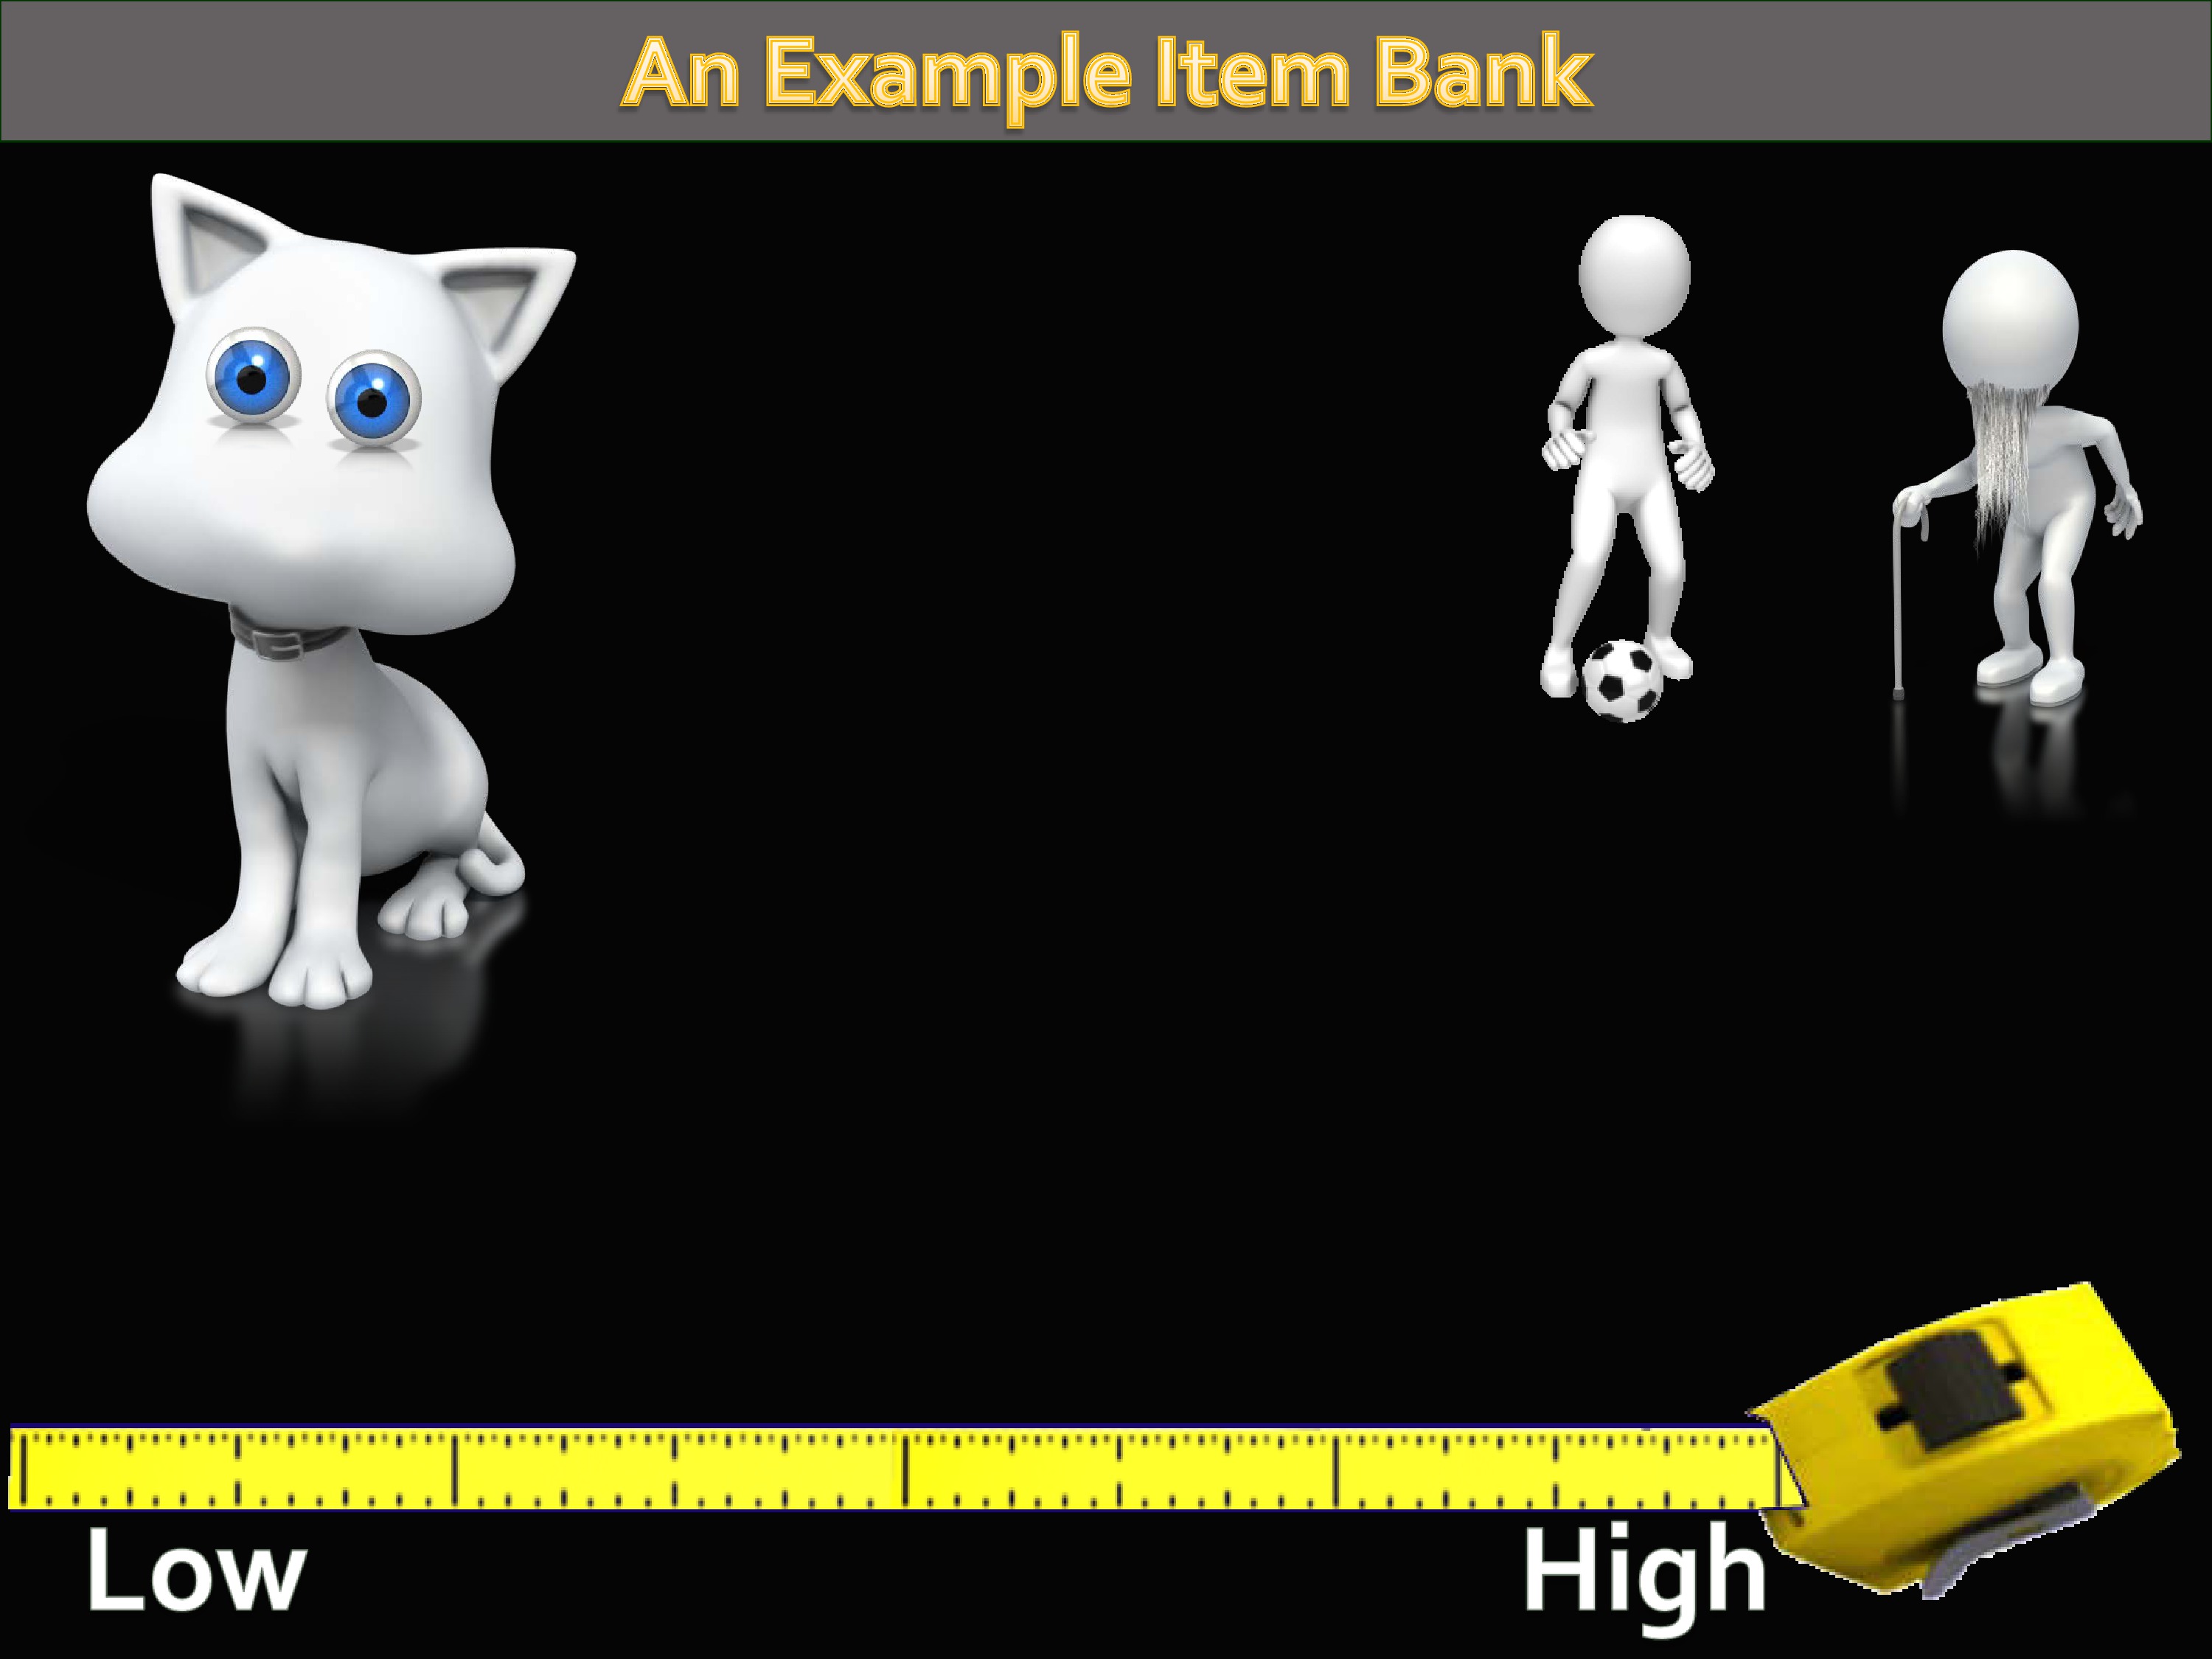
As you can imagine, there are a whole range of levels of physical function. From being, perhaps, confined to a bed to being a high-level athlete. We have a universe of items that could be written that address and target these levels of physical function. Whatever ones we’re using are a sample of that universe of items.
The next step that happens, then, is we’re defining a continuum from low to high functioning. The calibration process is lining these items all up along that mathematical metric.
To view the animated demonstration for this slide, please refer to the presentation video at timecode 15:30.
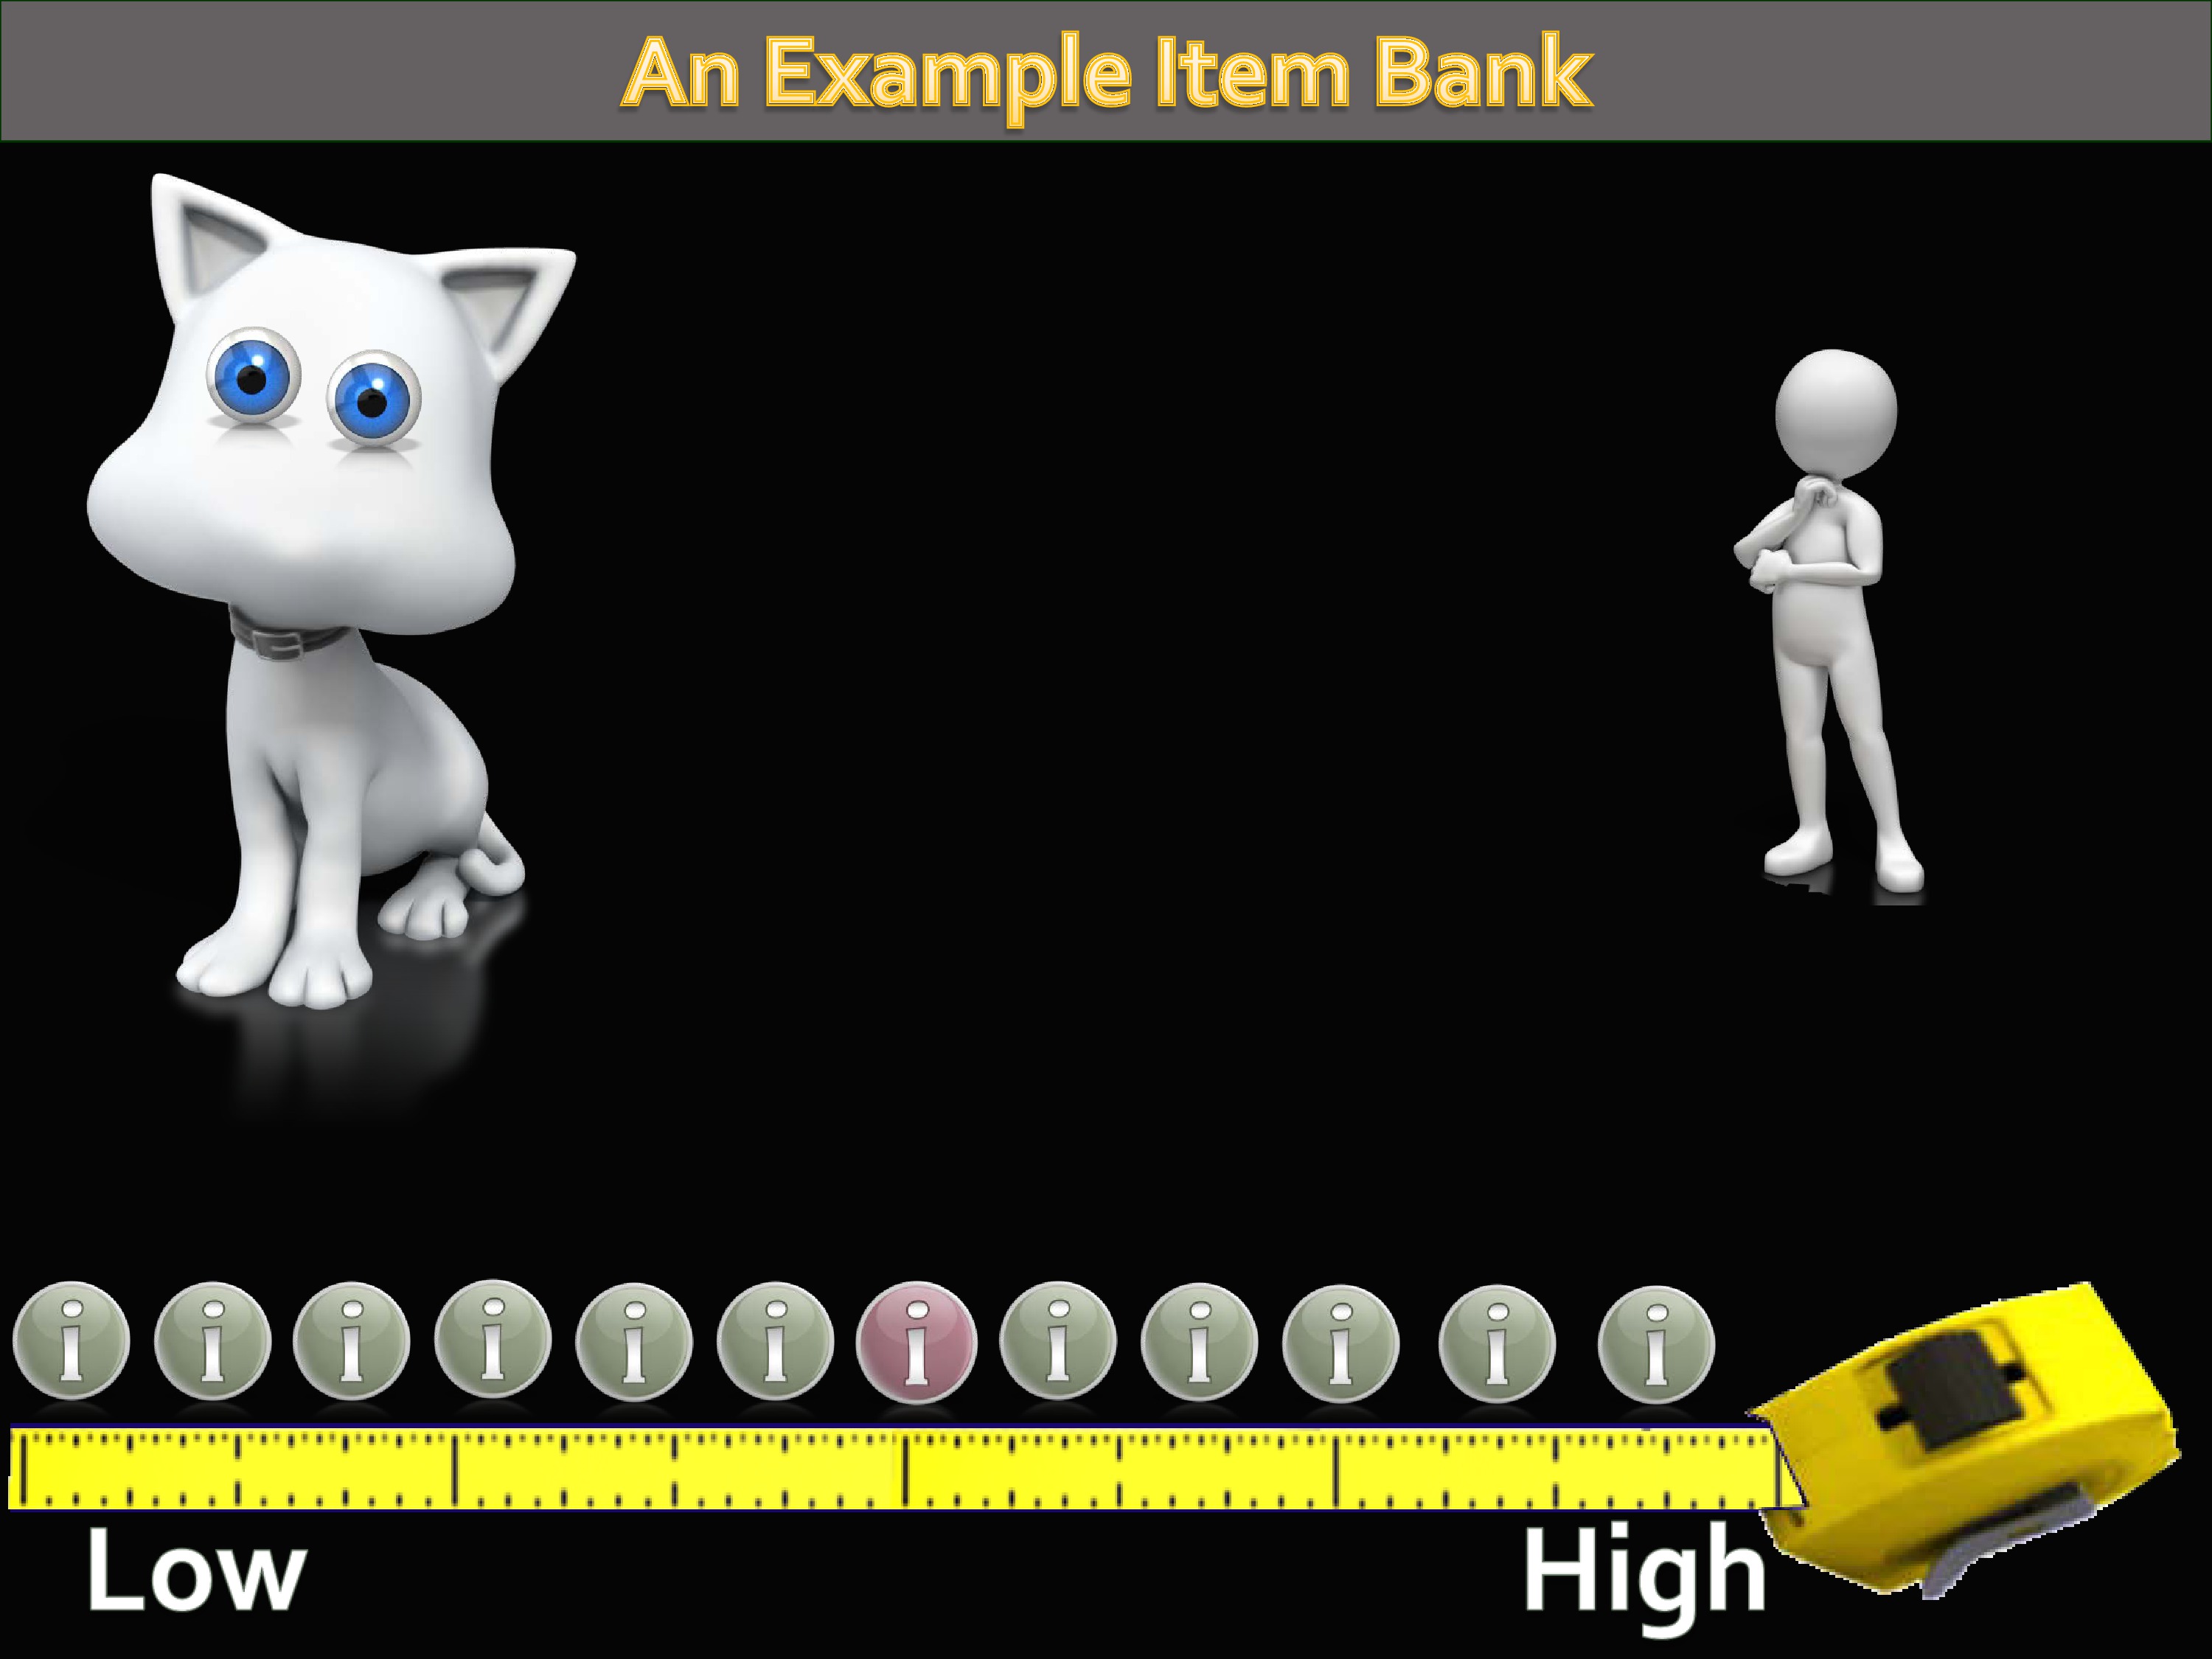
Let’s think about how the CAT works. It’s called computer adaptive testing. That’s because it adapts to how people answer the questions. If you went and took the graduate record examination today, this is how it would be administered to you.
If you and I go take the GRE, the first item would probably be a middle-difficulty item. If you got it right, the next item you got would be more difficult. If I got it wrong, the next item I got would be less difficult. By tailoring like this, you’re able to narrow in on a person’s trait level much more quickly than if you ask everybody all the same questions.
So, let’s see how this might work.
If you know nothing about a person, you tend to guess that they’re at the middle. So, it identifies a middle-level item, and administers it to this person we know nothing about.
Let’s suppose for a second that this person is, in fact, a high-level athlete. She’s going to answer that item in a way that says to the CAT algorithm, hey this person has higher (not lower) physical function.
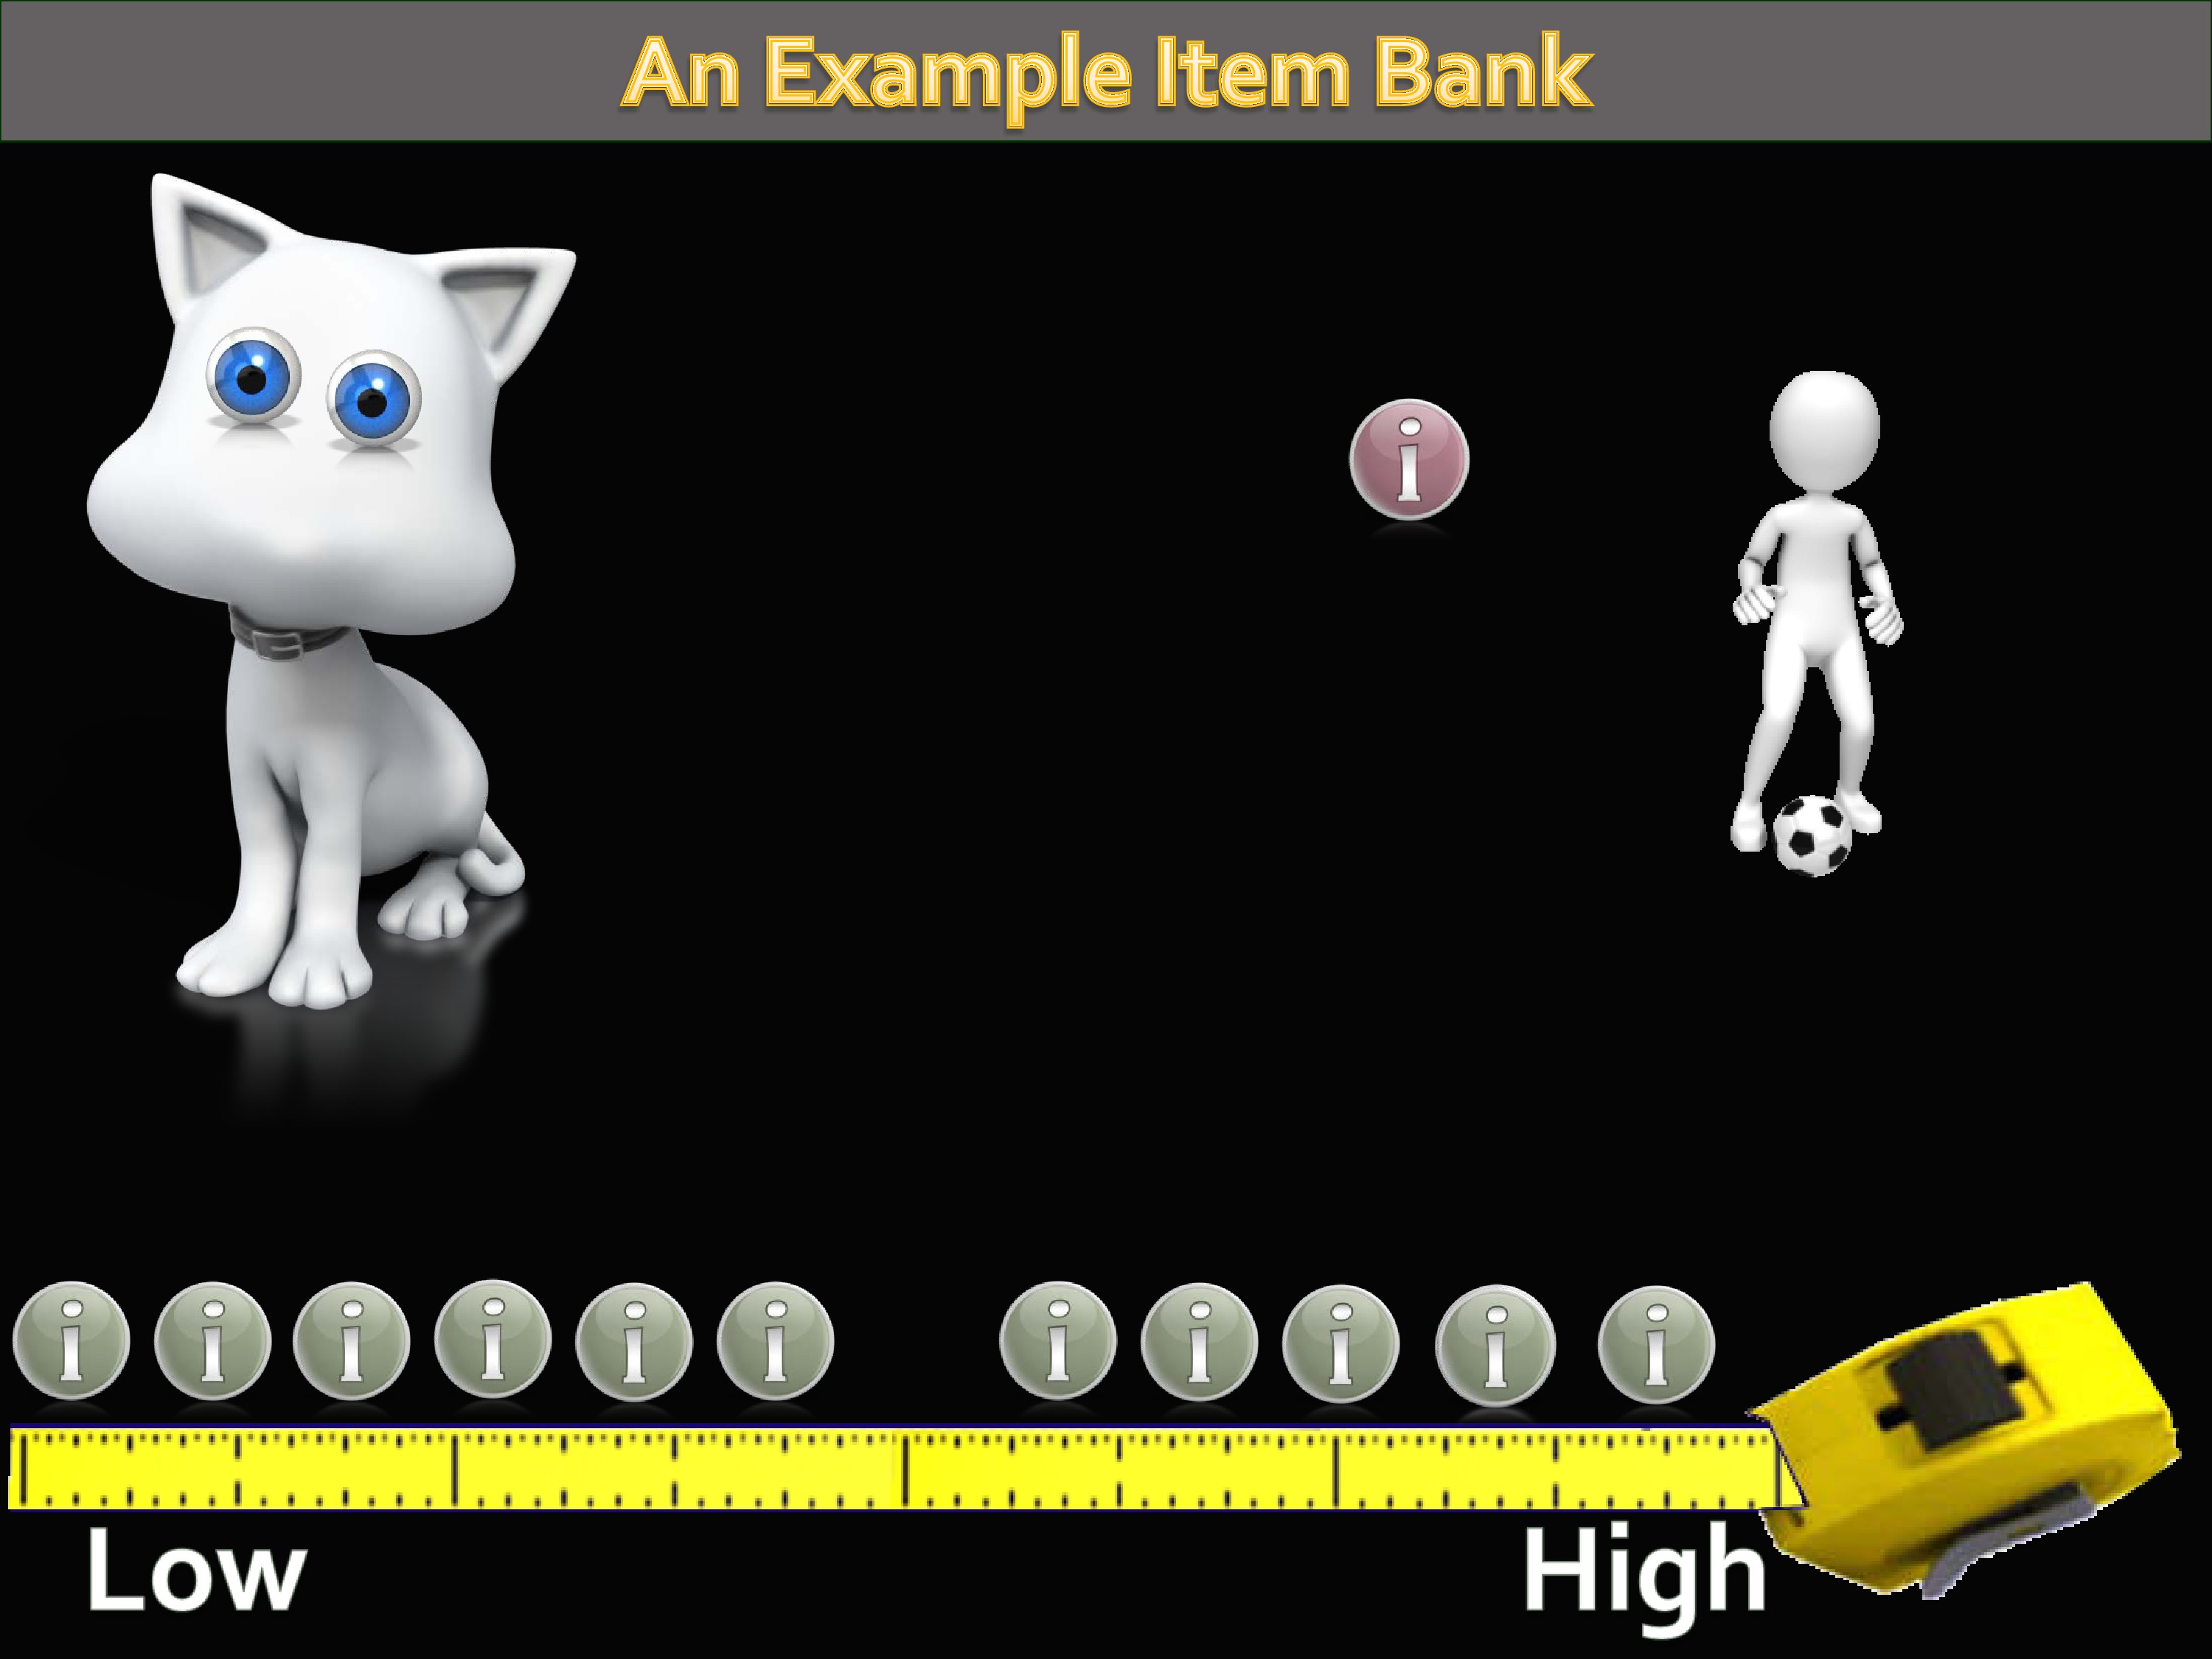
So the CAT algorithm goes and searches the item bank again, and picks a higher-level difficulty item, and administers that item. And depending on the response to that item, it continues to narrow down, picking items for this person until finally enough items have been administered so you can get a precise estimate of their level of the trait.
Let’s suppose, though, that the first item is answered by someone with a lower level of physical function. The same thing would happen.
But this time the CAT would go and identify a lower-level item and administer this. This would continue until we reached some level of precision.
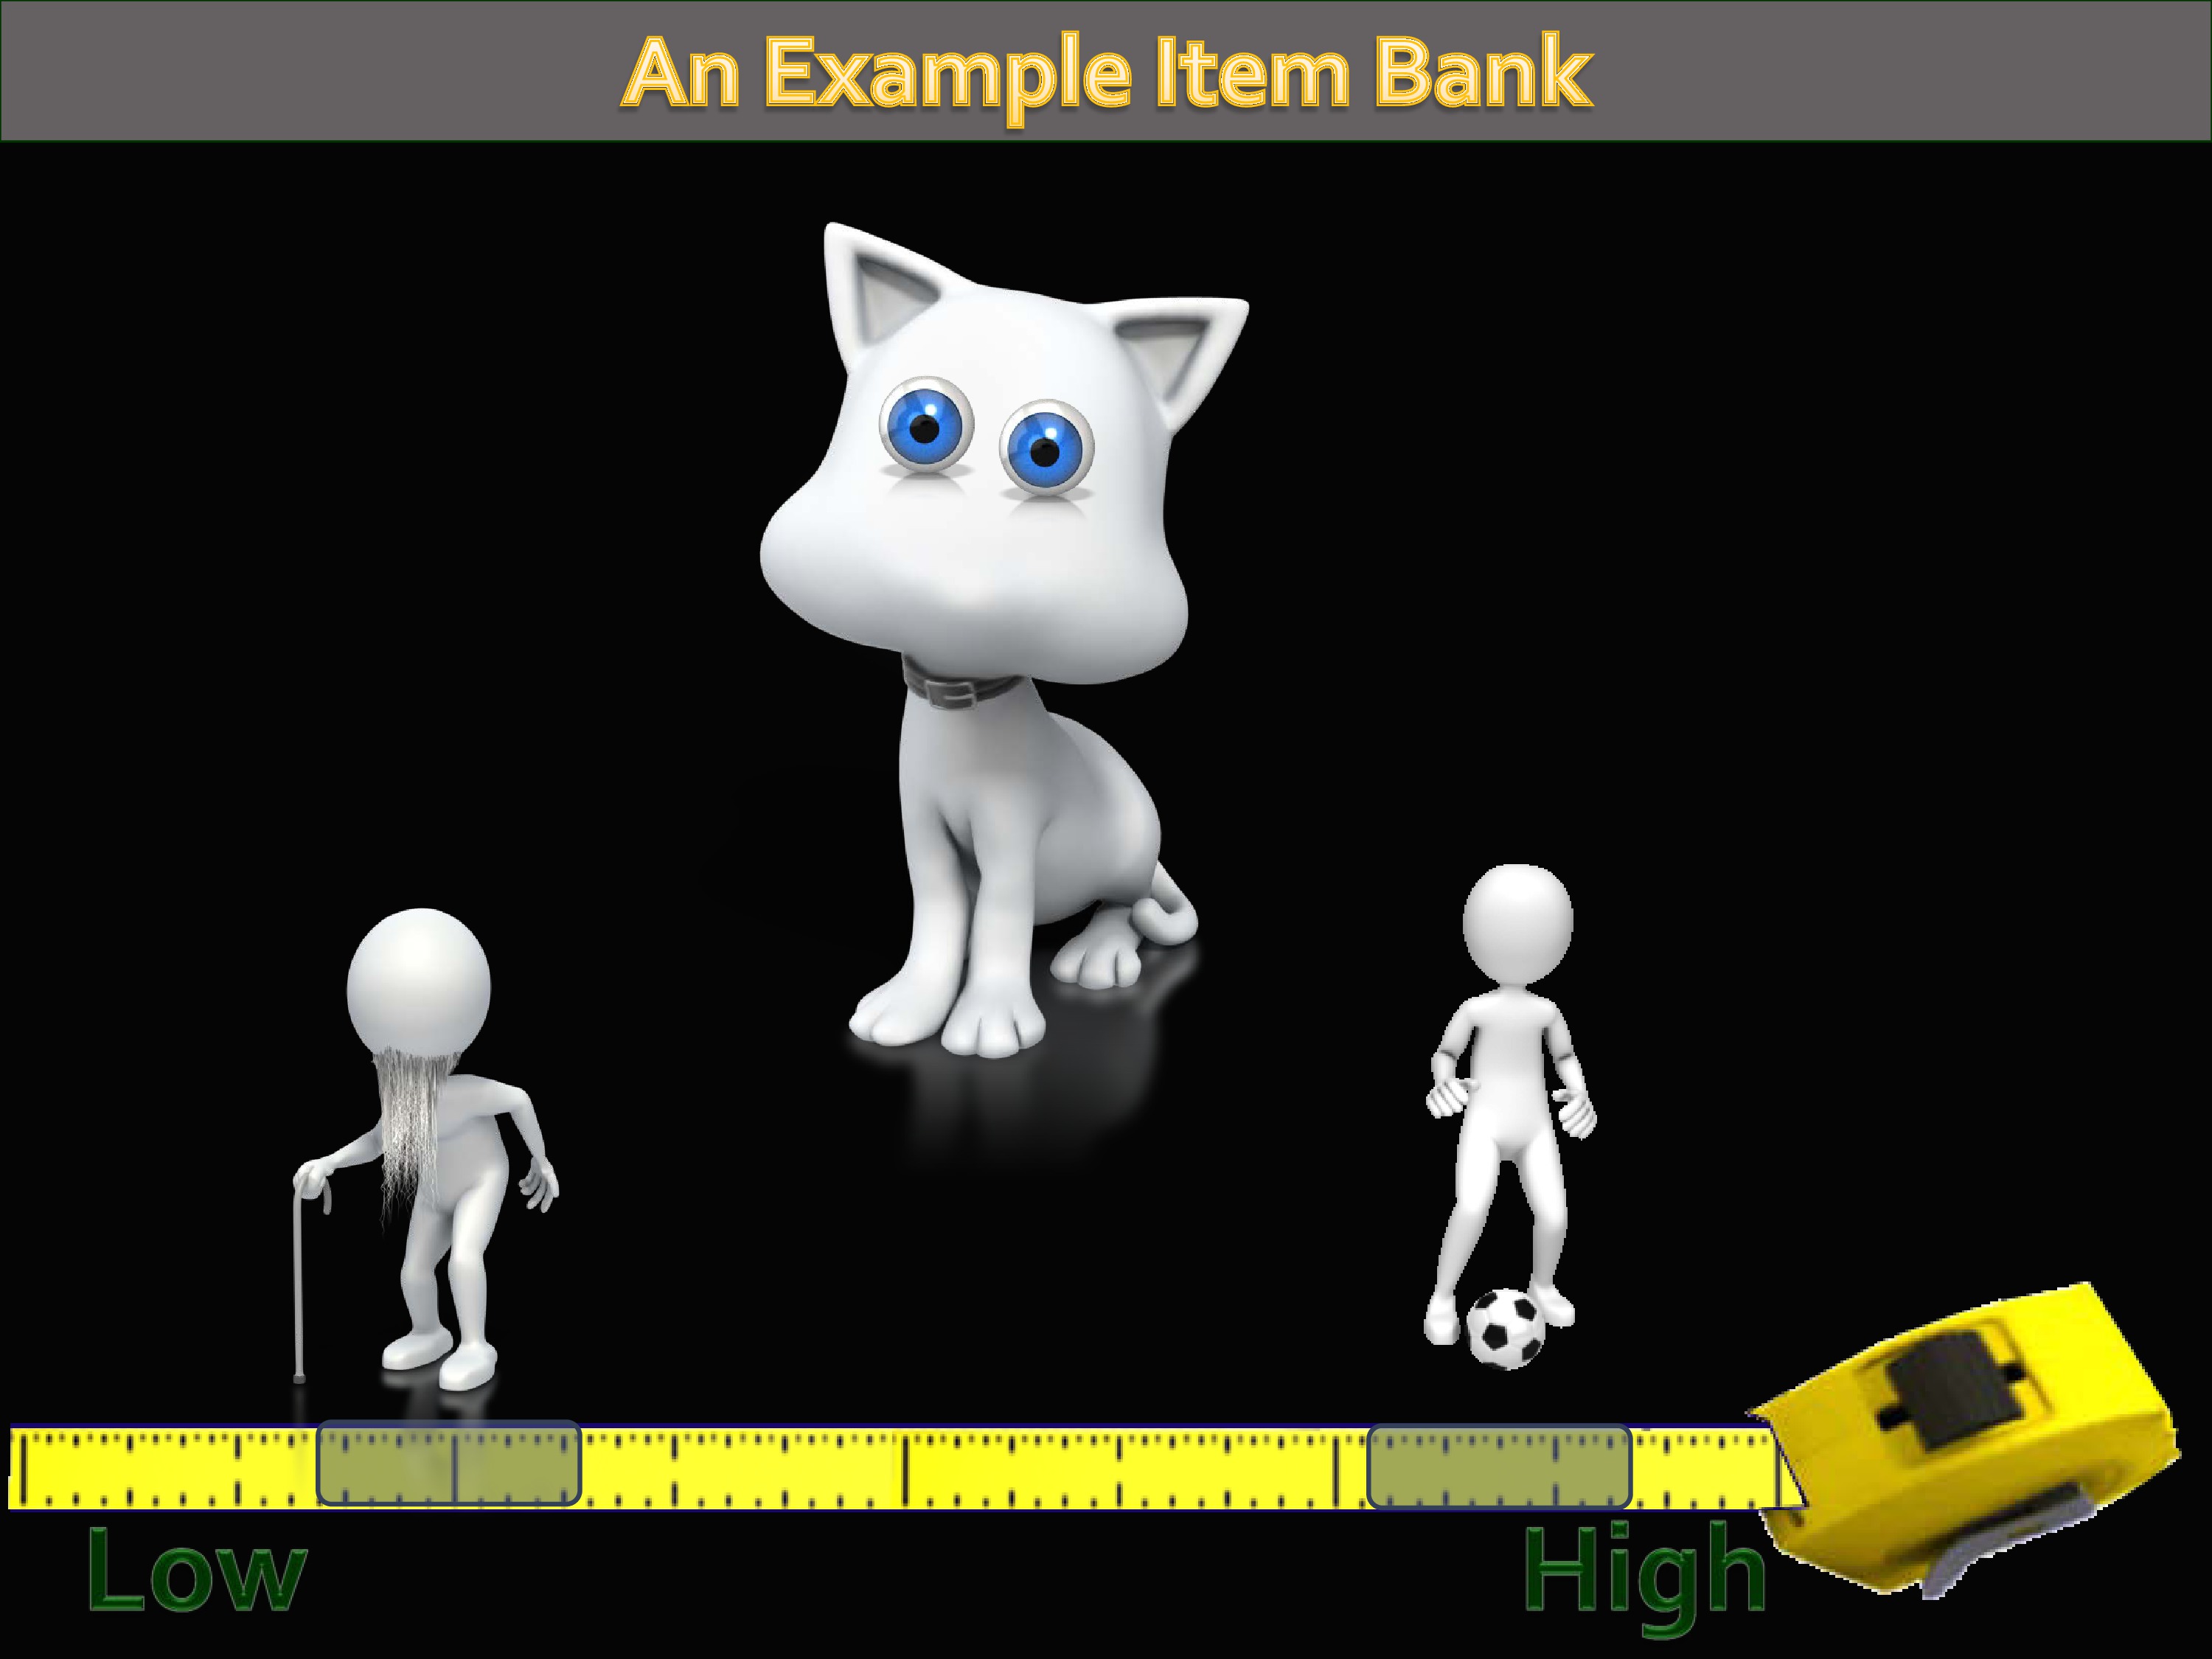
So the idea here is, even though you’ve got persons with low level of function and high level of function.
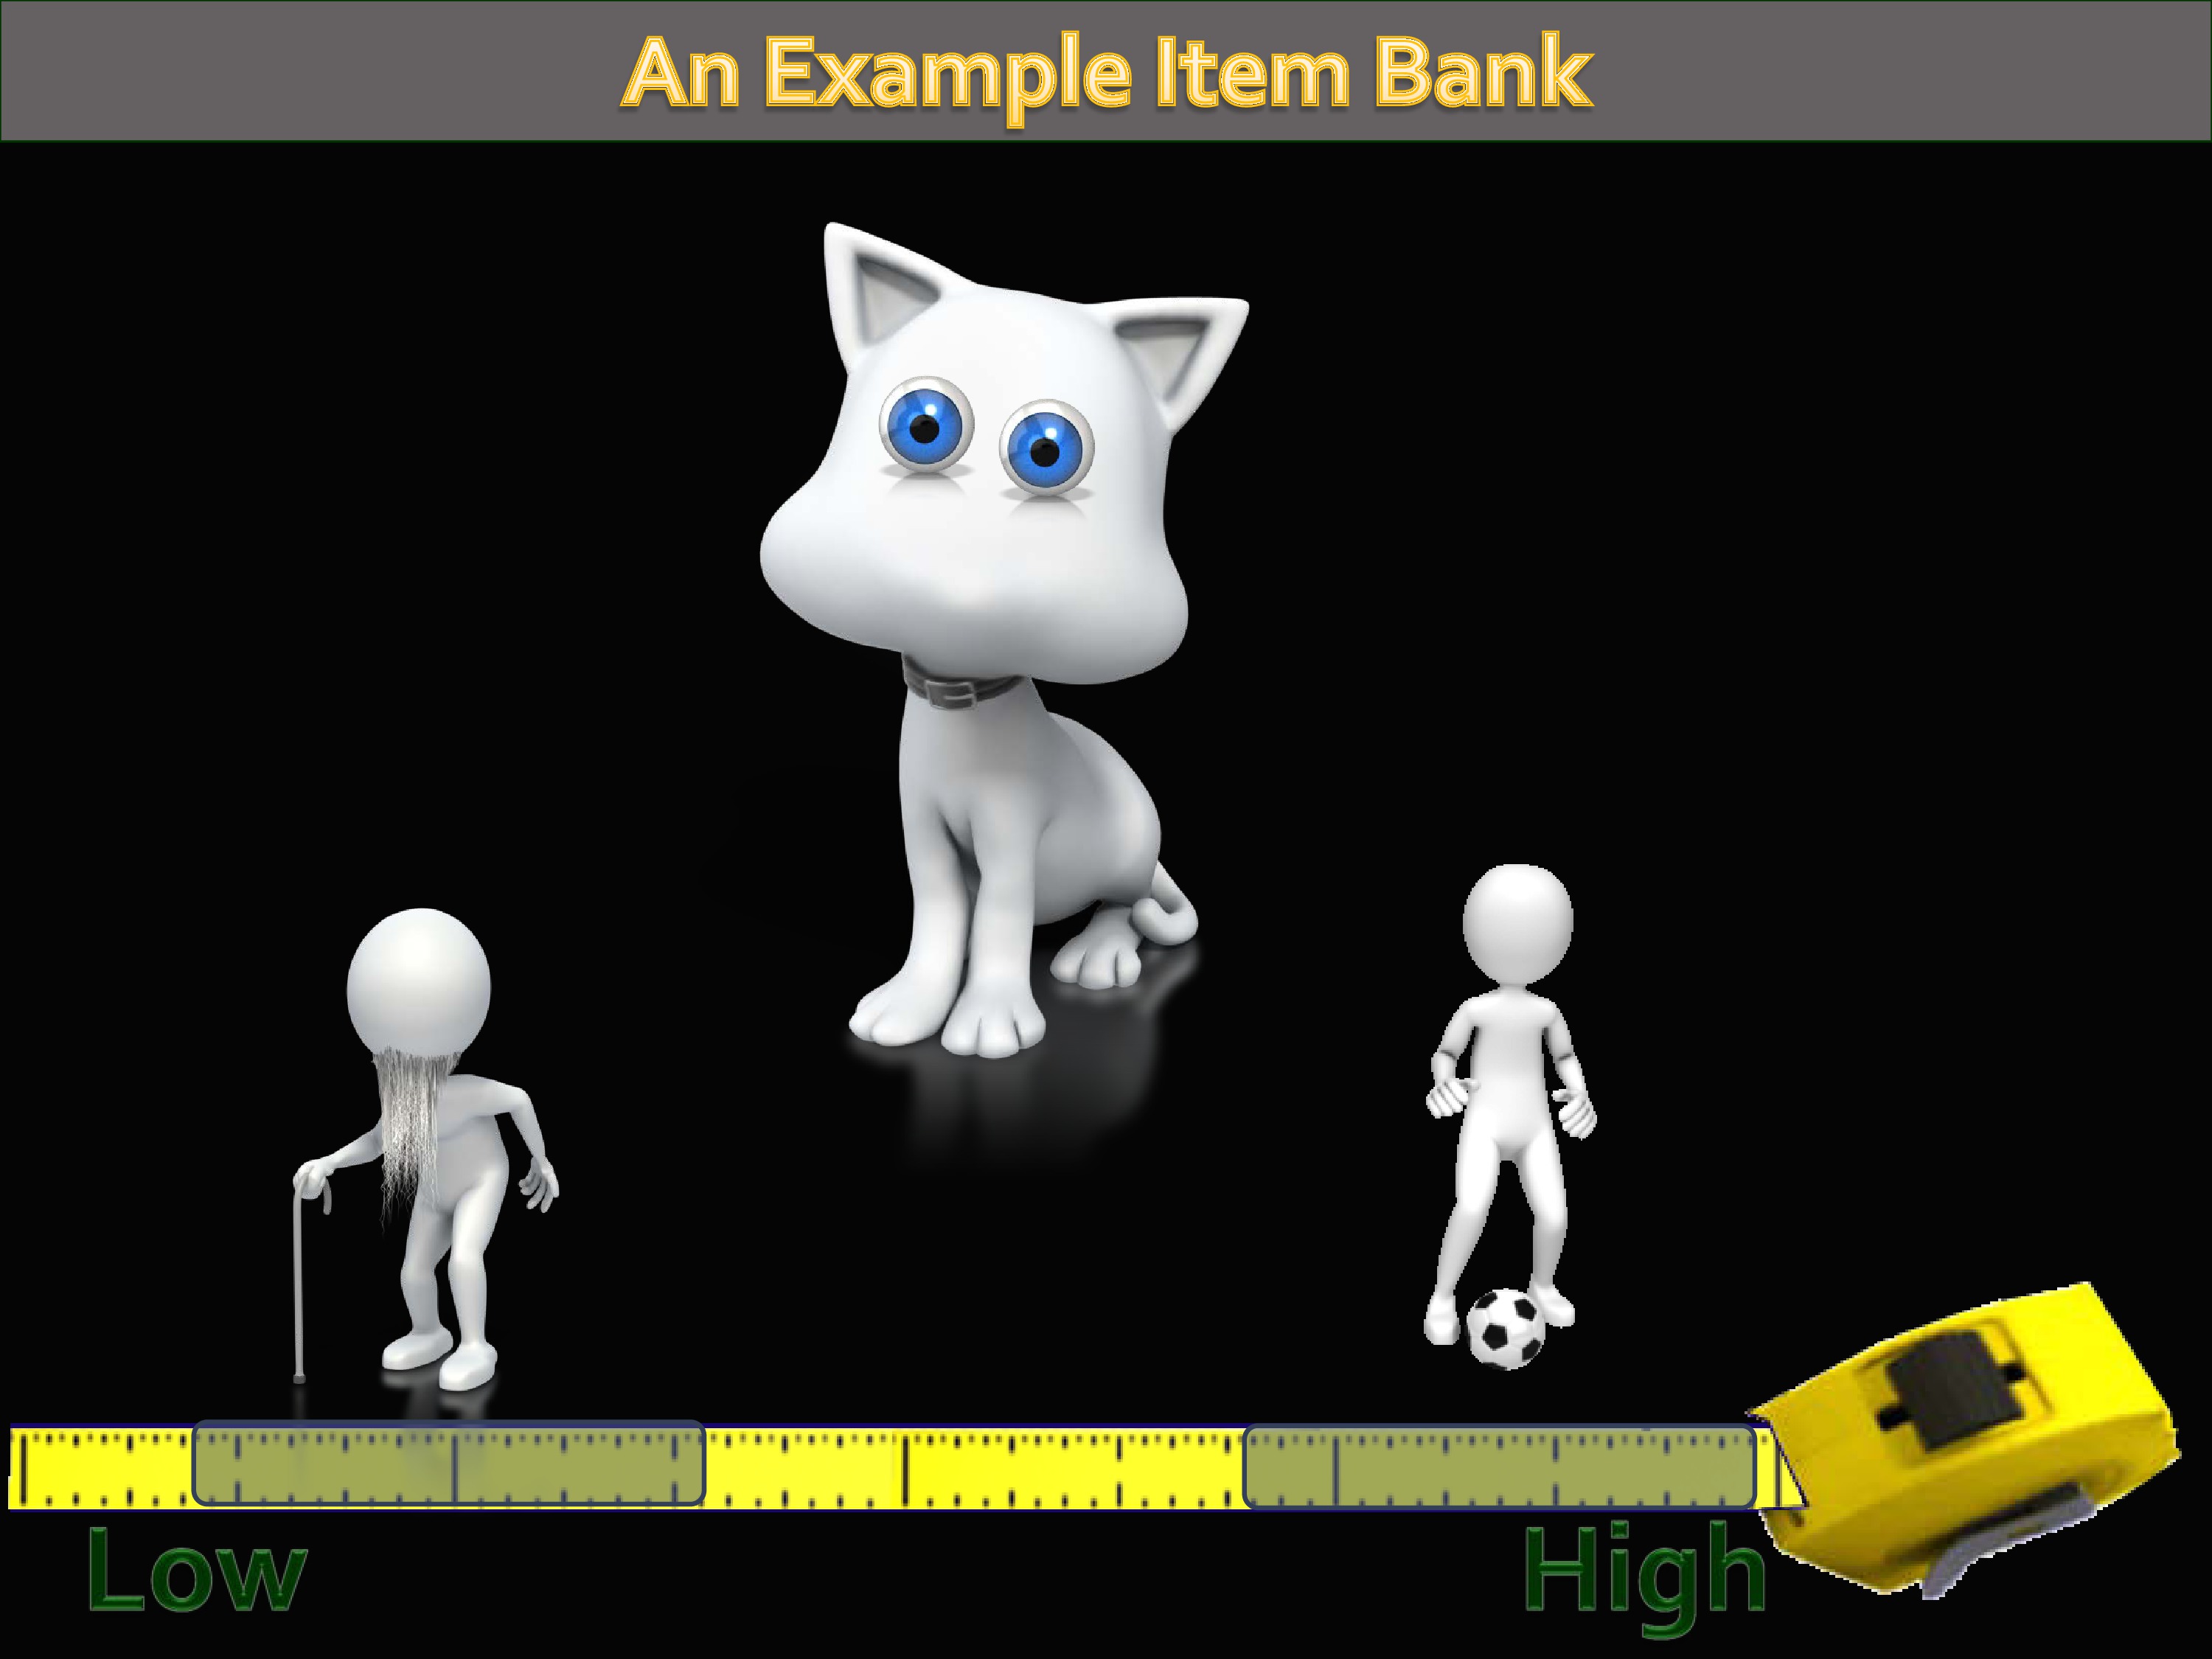
We’ve been able to use this approach to line them up on the same continuum, from low to high.
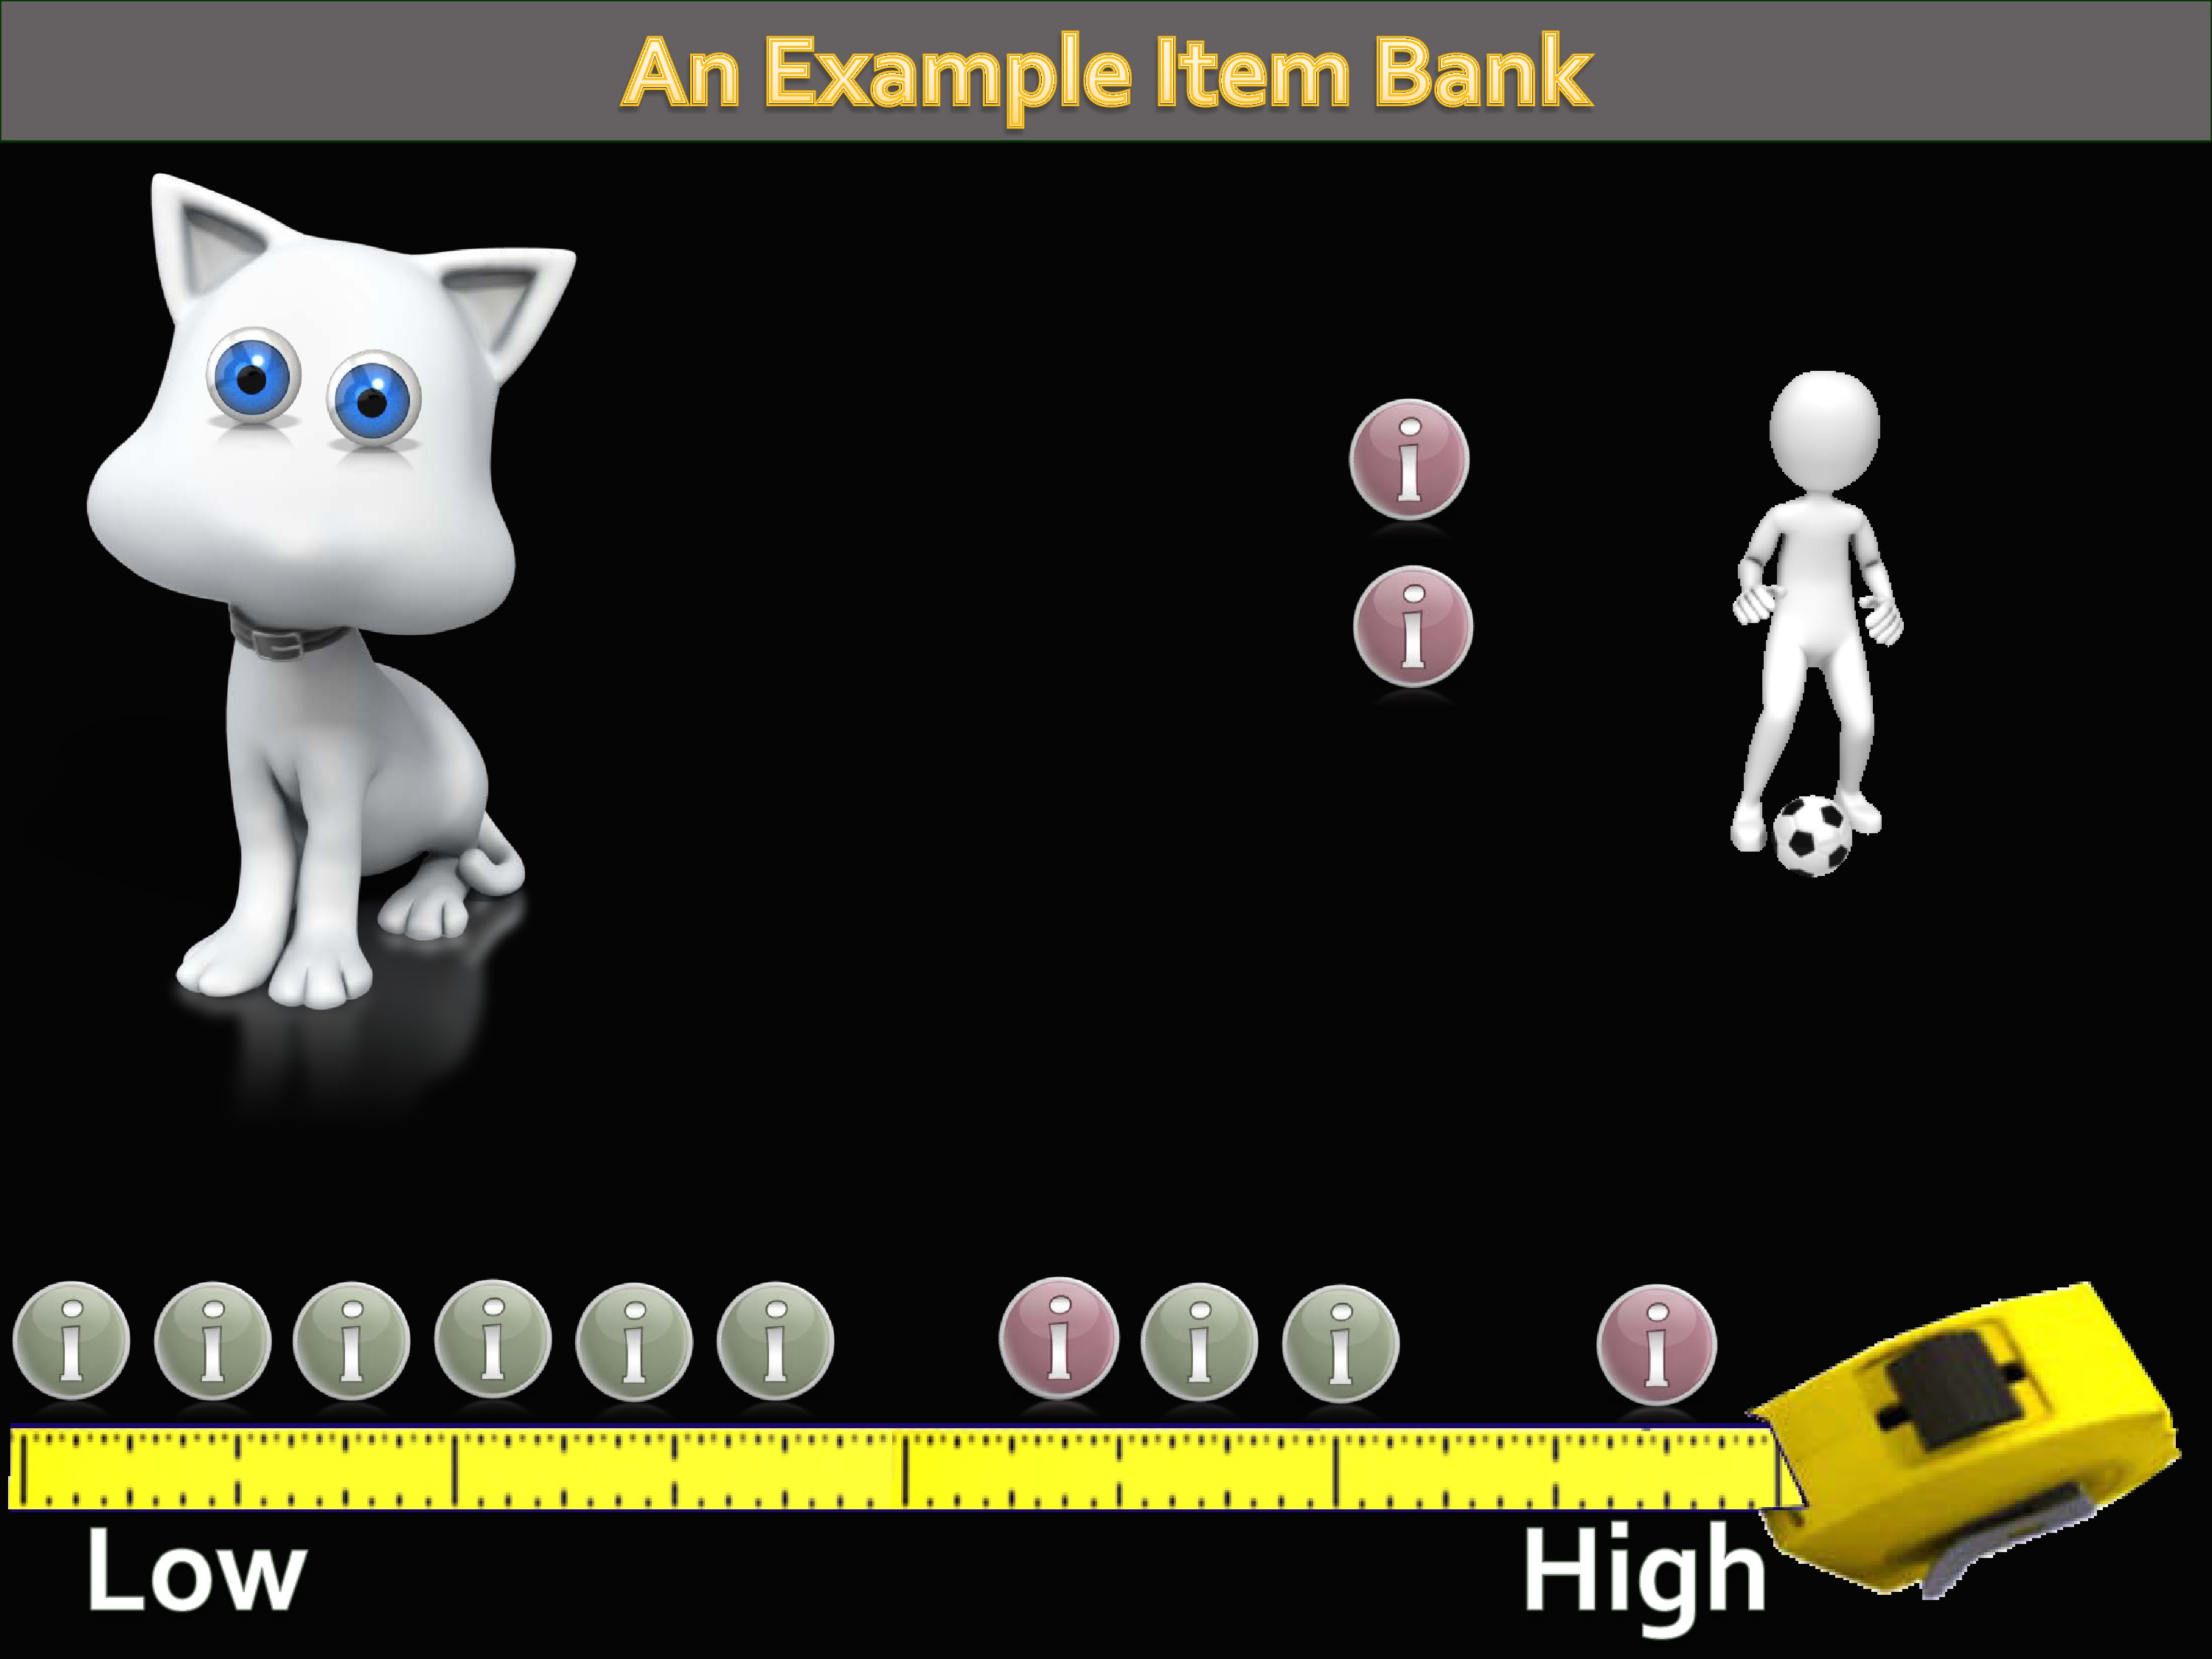
So the CAT algorithm when it first starts, it’s only asked one or two questions. So the range of confidence in this person’s trait is fairly large. You’ve only asked a couple questions.

But very quickly, and because it’s adaptive, that range of trait gets narrower.
And narrower.
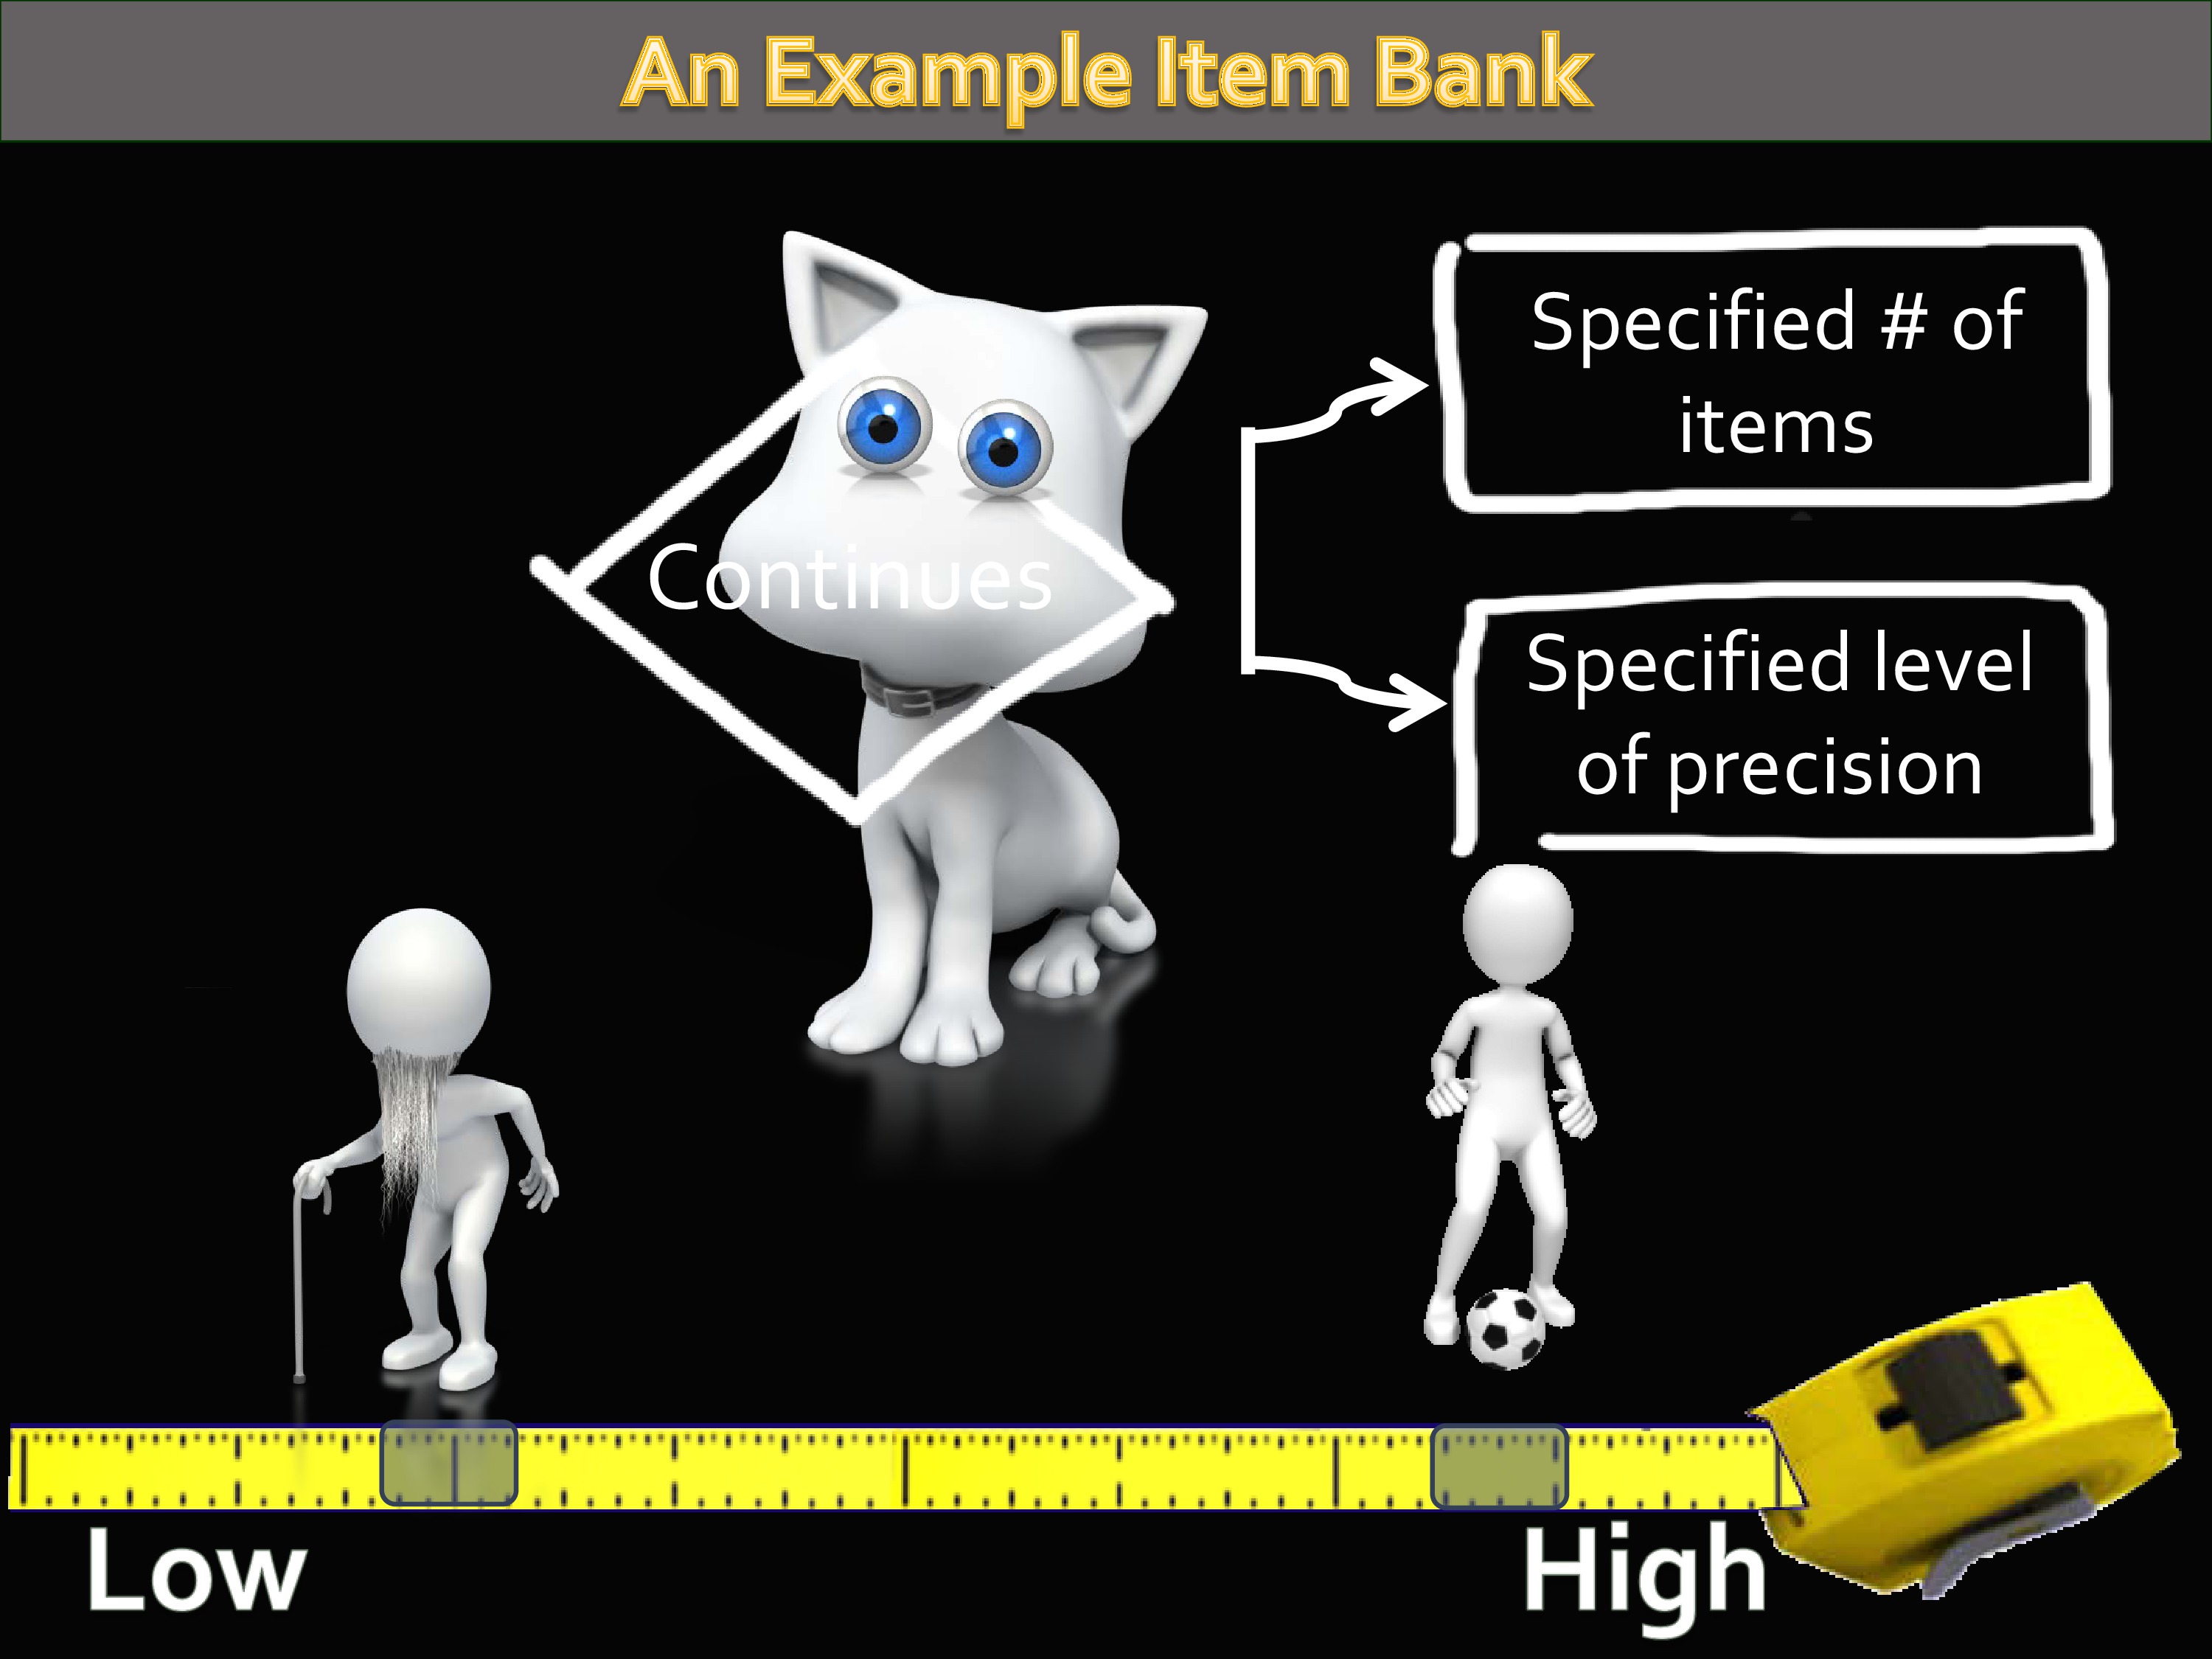
And this process continues until — and you can specify when you do a computer adaptive test, I want you to ask everybody eight items. Or you can say, I want you to continue until you reach a specified level of precision, until that confidence level around that estimate is this wide.
We call those rules “stopping rules.” Because it tells the CAT when to quit doing this. Because otherwise, it would just keep on going until it’s exhausted the whole bank.
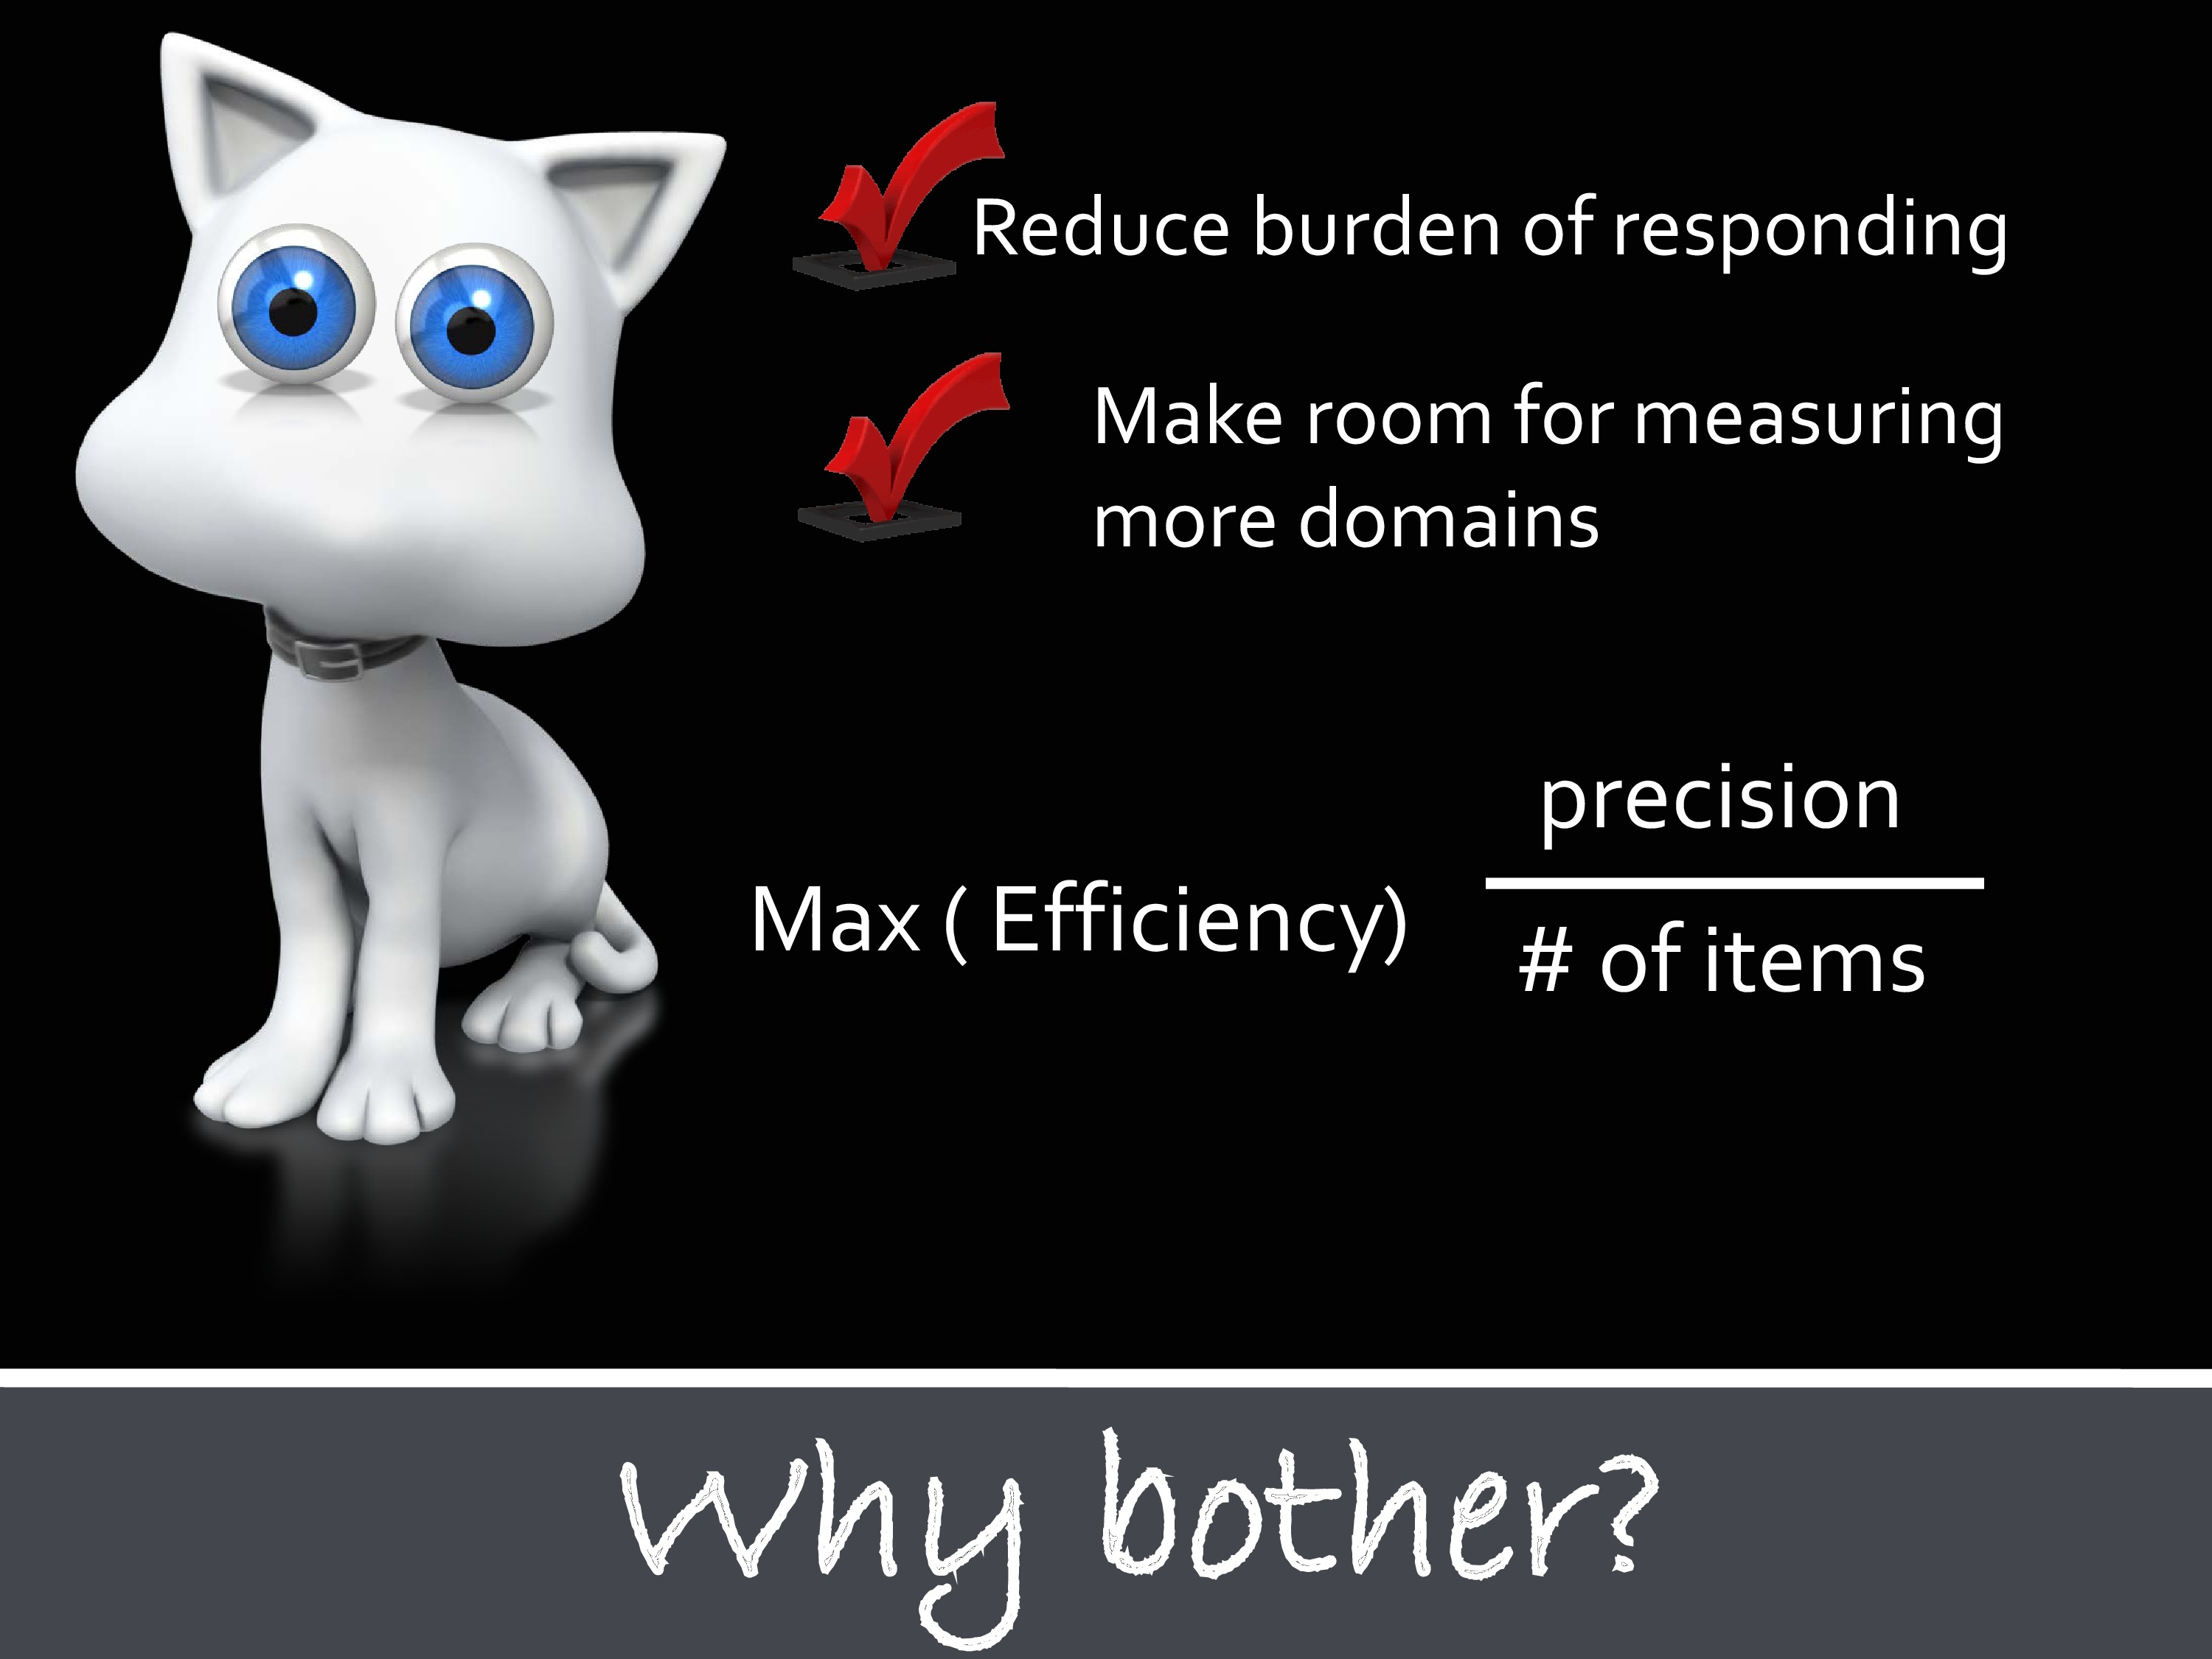
So, why bother?
I’ve just described a very sophisticated and technically intense approach to measurement.
This is one of the first questions I learned to ask in my academic career, because of some missteps early on: “Who cares?”
The reason PROMIS decided to care, Toolbox decided to care, is that if you think of measurement efficiency as the amount of precision in estimates that you get, compared to the number of items you administer, then what you really want to do is maximize that efficiency. Doing this kind of assessment computer adaptively allows you to maximize efficiency.
You’re reducing the respondent burden. Very important, that if you’re administering a measure of fatigue, that you don’t ask them 120 questions about fatigue.
The other thing is that by limiting the response burden, and yet still getting good precision, it makes room for measuring more domains. And more and more we realize just how many things are correlated with the stuff we want to measure. In order to capture that and really get a picture of how things are affecting patients, it doesn’t suffice to just measure a single thing.
To view the animated demonstration for this slide, please refer to the presentation video at timecode 20:00.
There’s one more advantage of PROMIS and Toolbox. And it’s this whole metric thing that I just described. You have this metric that goes from low to high. So you’ve got to get scores.
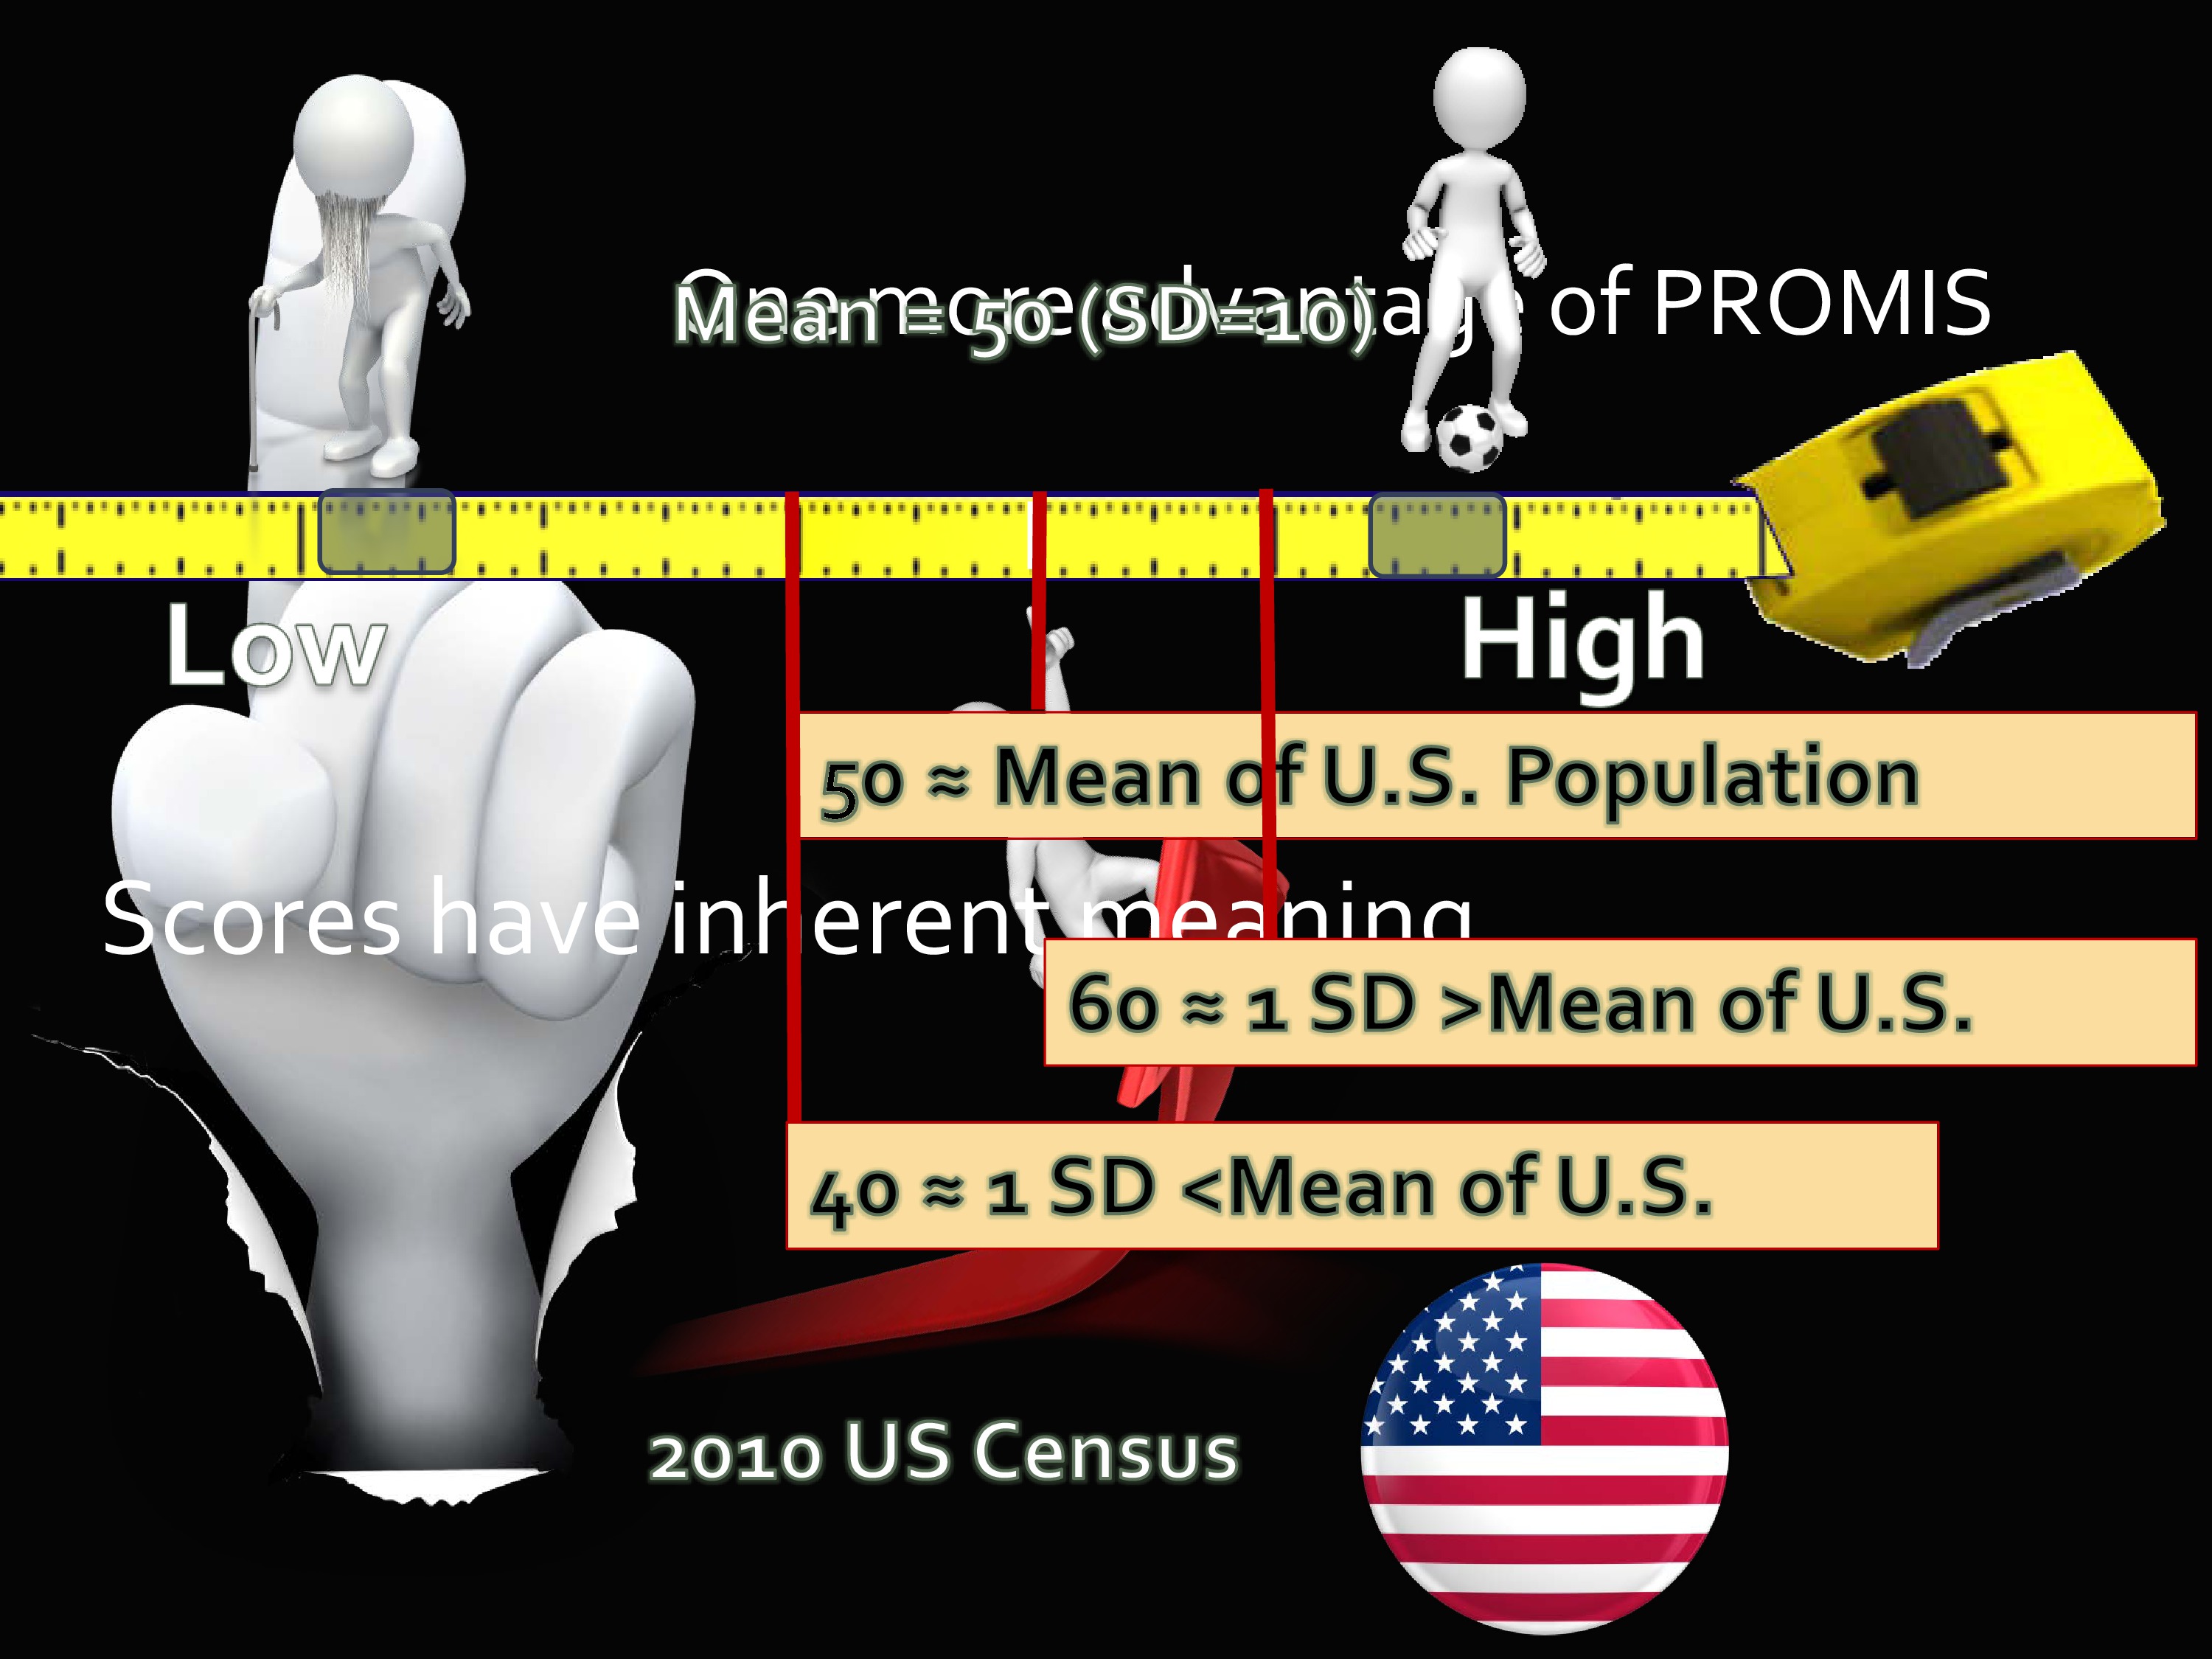
Well, the way that the scores were calibrated in PROMIS, and later I’ll show you in Toolbox, is that the middle, the center, was calibrated to a 2000 US Census sample.
You’ve got these 20,000 people that I mentioned in Wave 1. And a sub-sample of those was taken that matched the US Census in age, gender, and race/ethnicity. Important for you to know, it did not match the US population in education, in SES, it did not do that. That would be a very expensive undertaking to get that level of norming. But it did, at least, account for several variables that do happen to be impactful on health outcomes.
So the scores of PROMIS and Toolbox are on what’s called a T-score metric. You may know about this — it has a mean of 50 and a standard deviation of 10. What’s really nice about this is, because it’s on this metric, when you get a score of 60 you have some inherent understanding of what that means. You know that a score of 60 is a standard deviation above the population mean.
As opposed to when you get a raw score on some measure and it says you got a 16. It’s like, is that good? Is that bad? Usually, the way we get some sense of interpretability of measures is that we use them for a long time, so we develop this sense of what level is a problem, what level should I be worried about.
But it this case it really gives you a marker, some standard to compare it to. A score of 40 would be a standard deviation below the mean. And the scores have inherent meaning.
Let’s talk about the other part of the PROMIS umbrella. That’s the Assessment Center. So you have these huge items banks. You have this nifty way of assessing, if you want to, through computer adaptive testing. Also, by the way, you can print out short forms and administer them, too, and with a concordance table you can get a score that’s on the same metric.
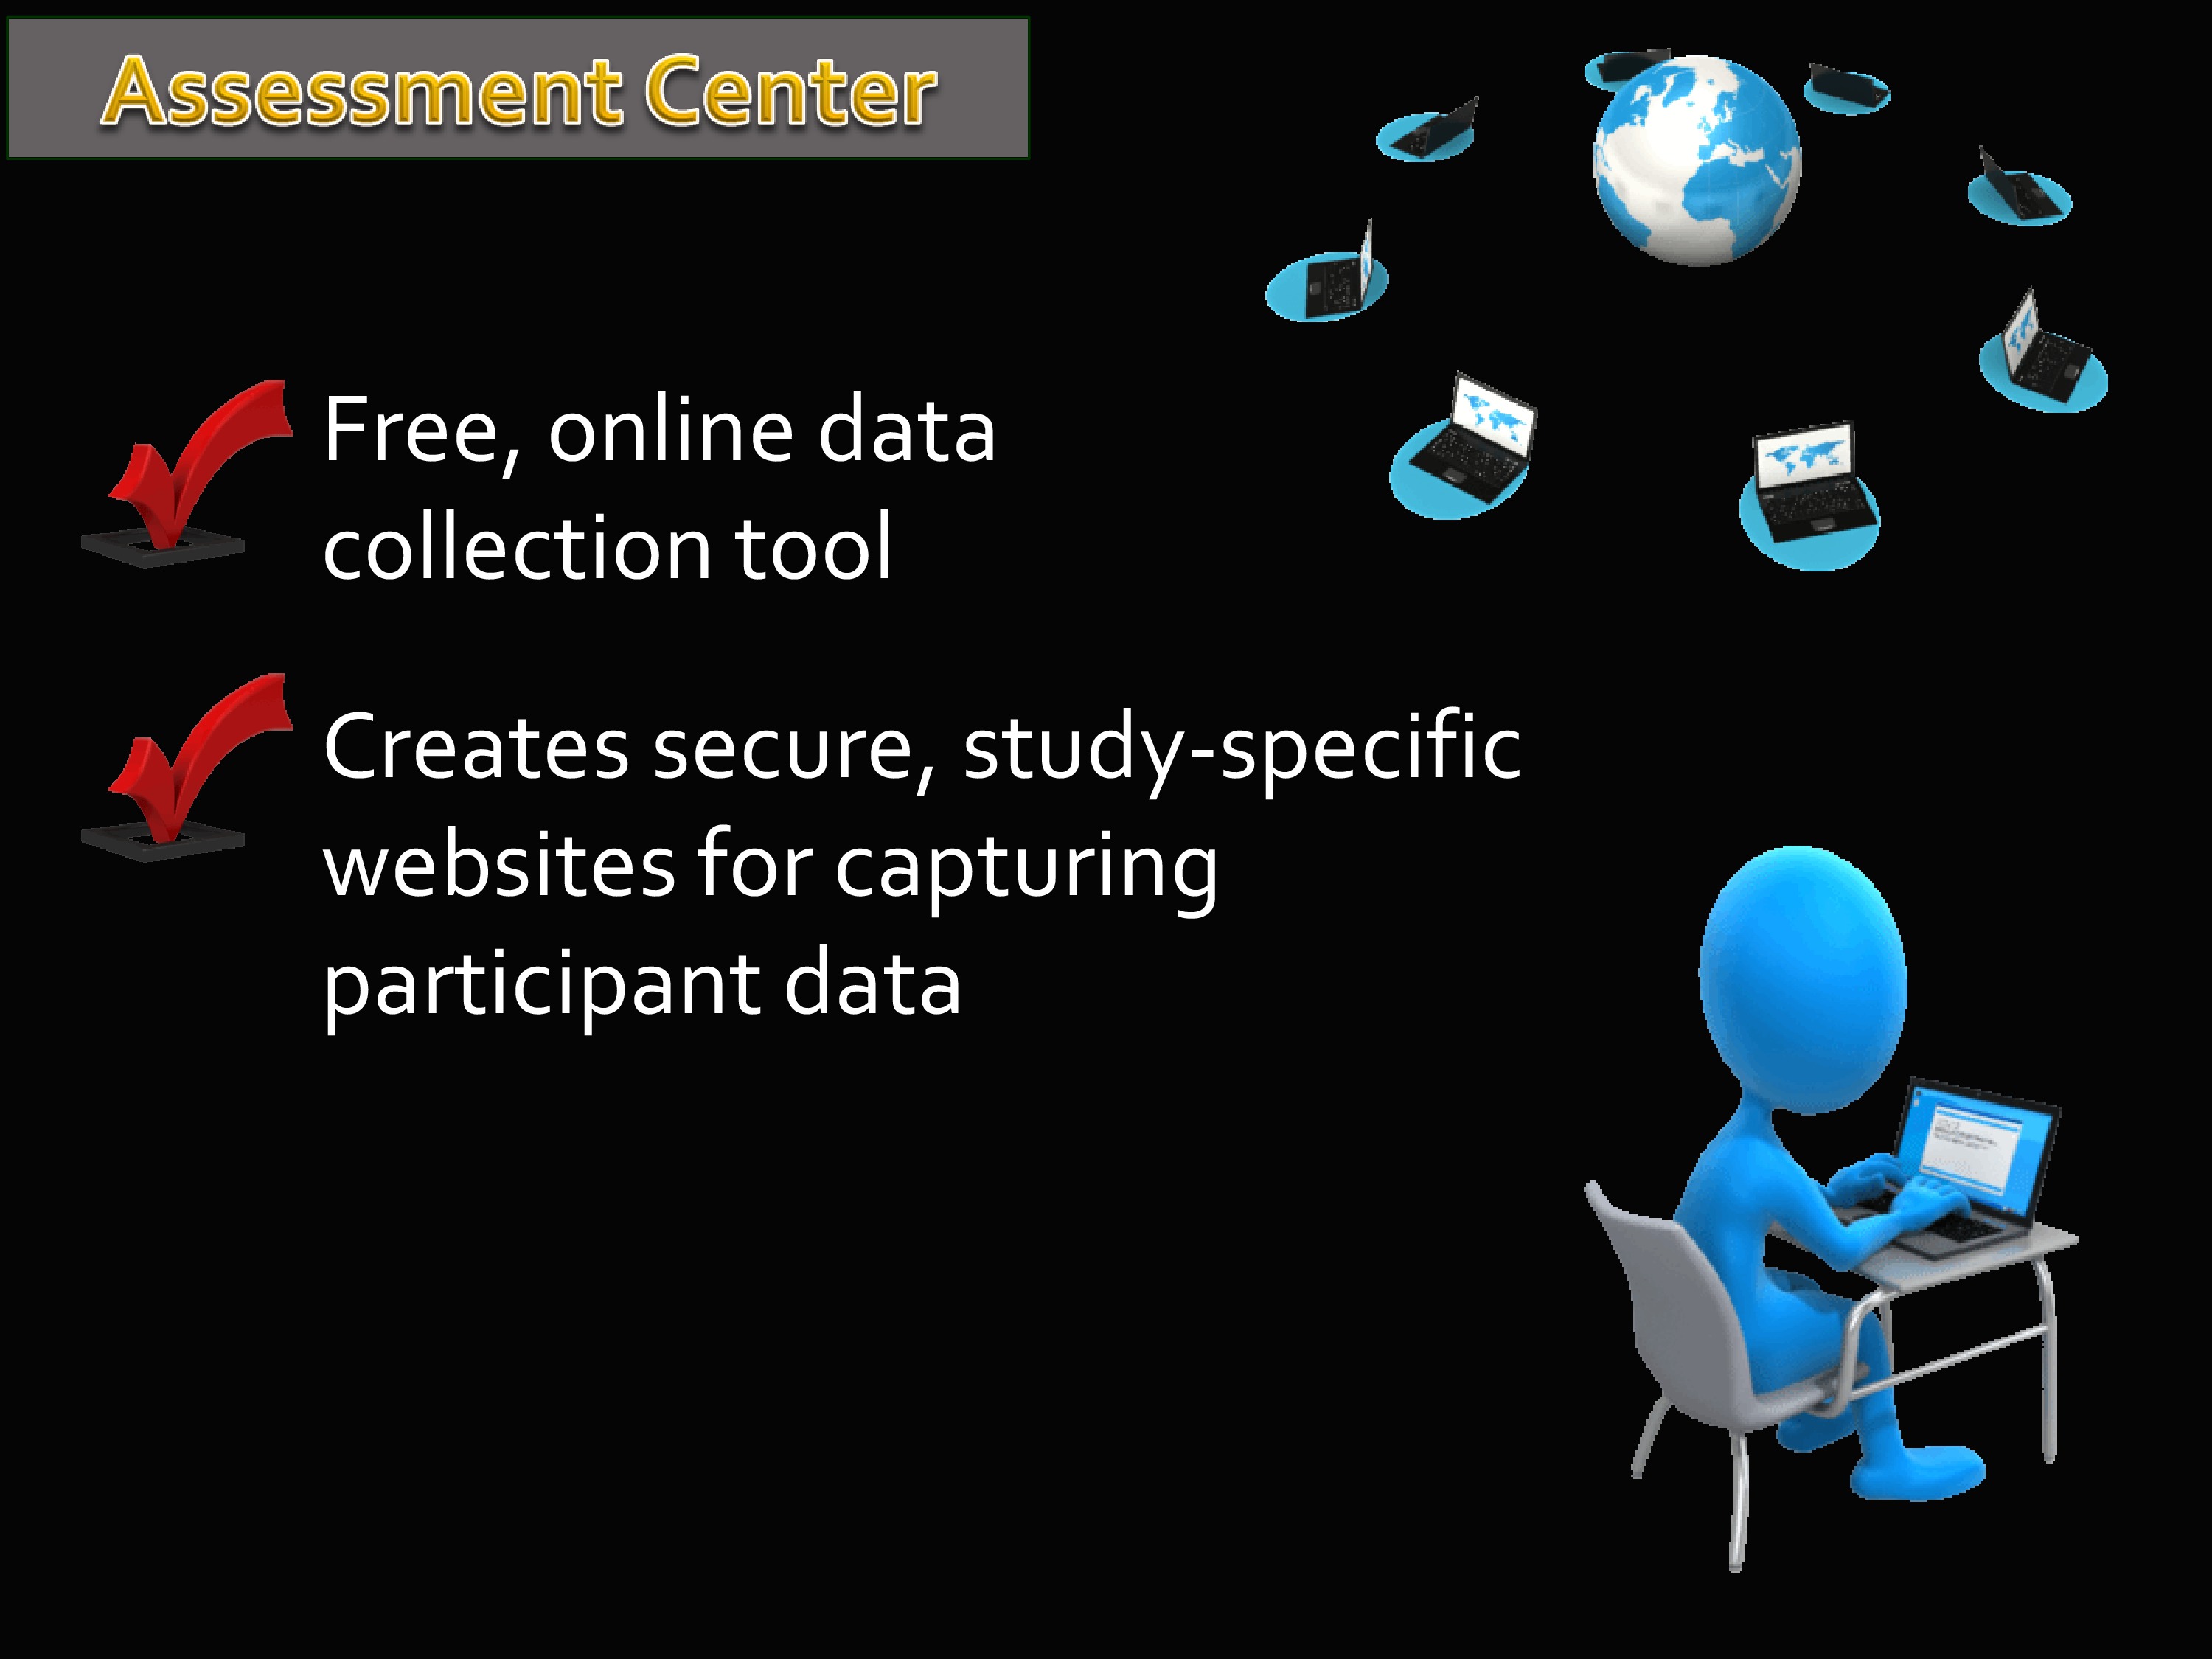
But what about the Assessment Center? The Assessment Center is this free, online data collection tool. And it really is free. If you set up a study, you could go online and decide which measures to use, and what it does is it creates a secure, study-specific website for capturing participant data.
You can include your own introduction page. You can include informed consent. You can add your own measures that are not part of PROMIS. And then, once it’s published, you have a link that patients can go to and take that assessment. You can also put in parameters like — suppose you’re paying people to take it, and you only have a certain amount of money to spend, and you want to limit it so you stop administering after you get to 100 people. You can make that kind of decision.
And you can decide to do short forms, you can decide to do computer adaptively.
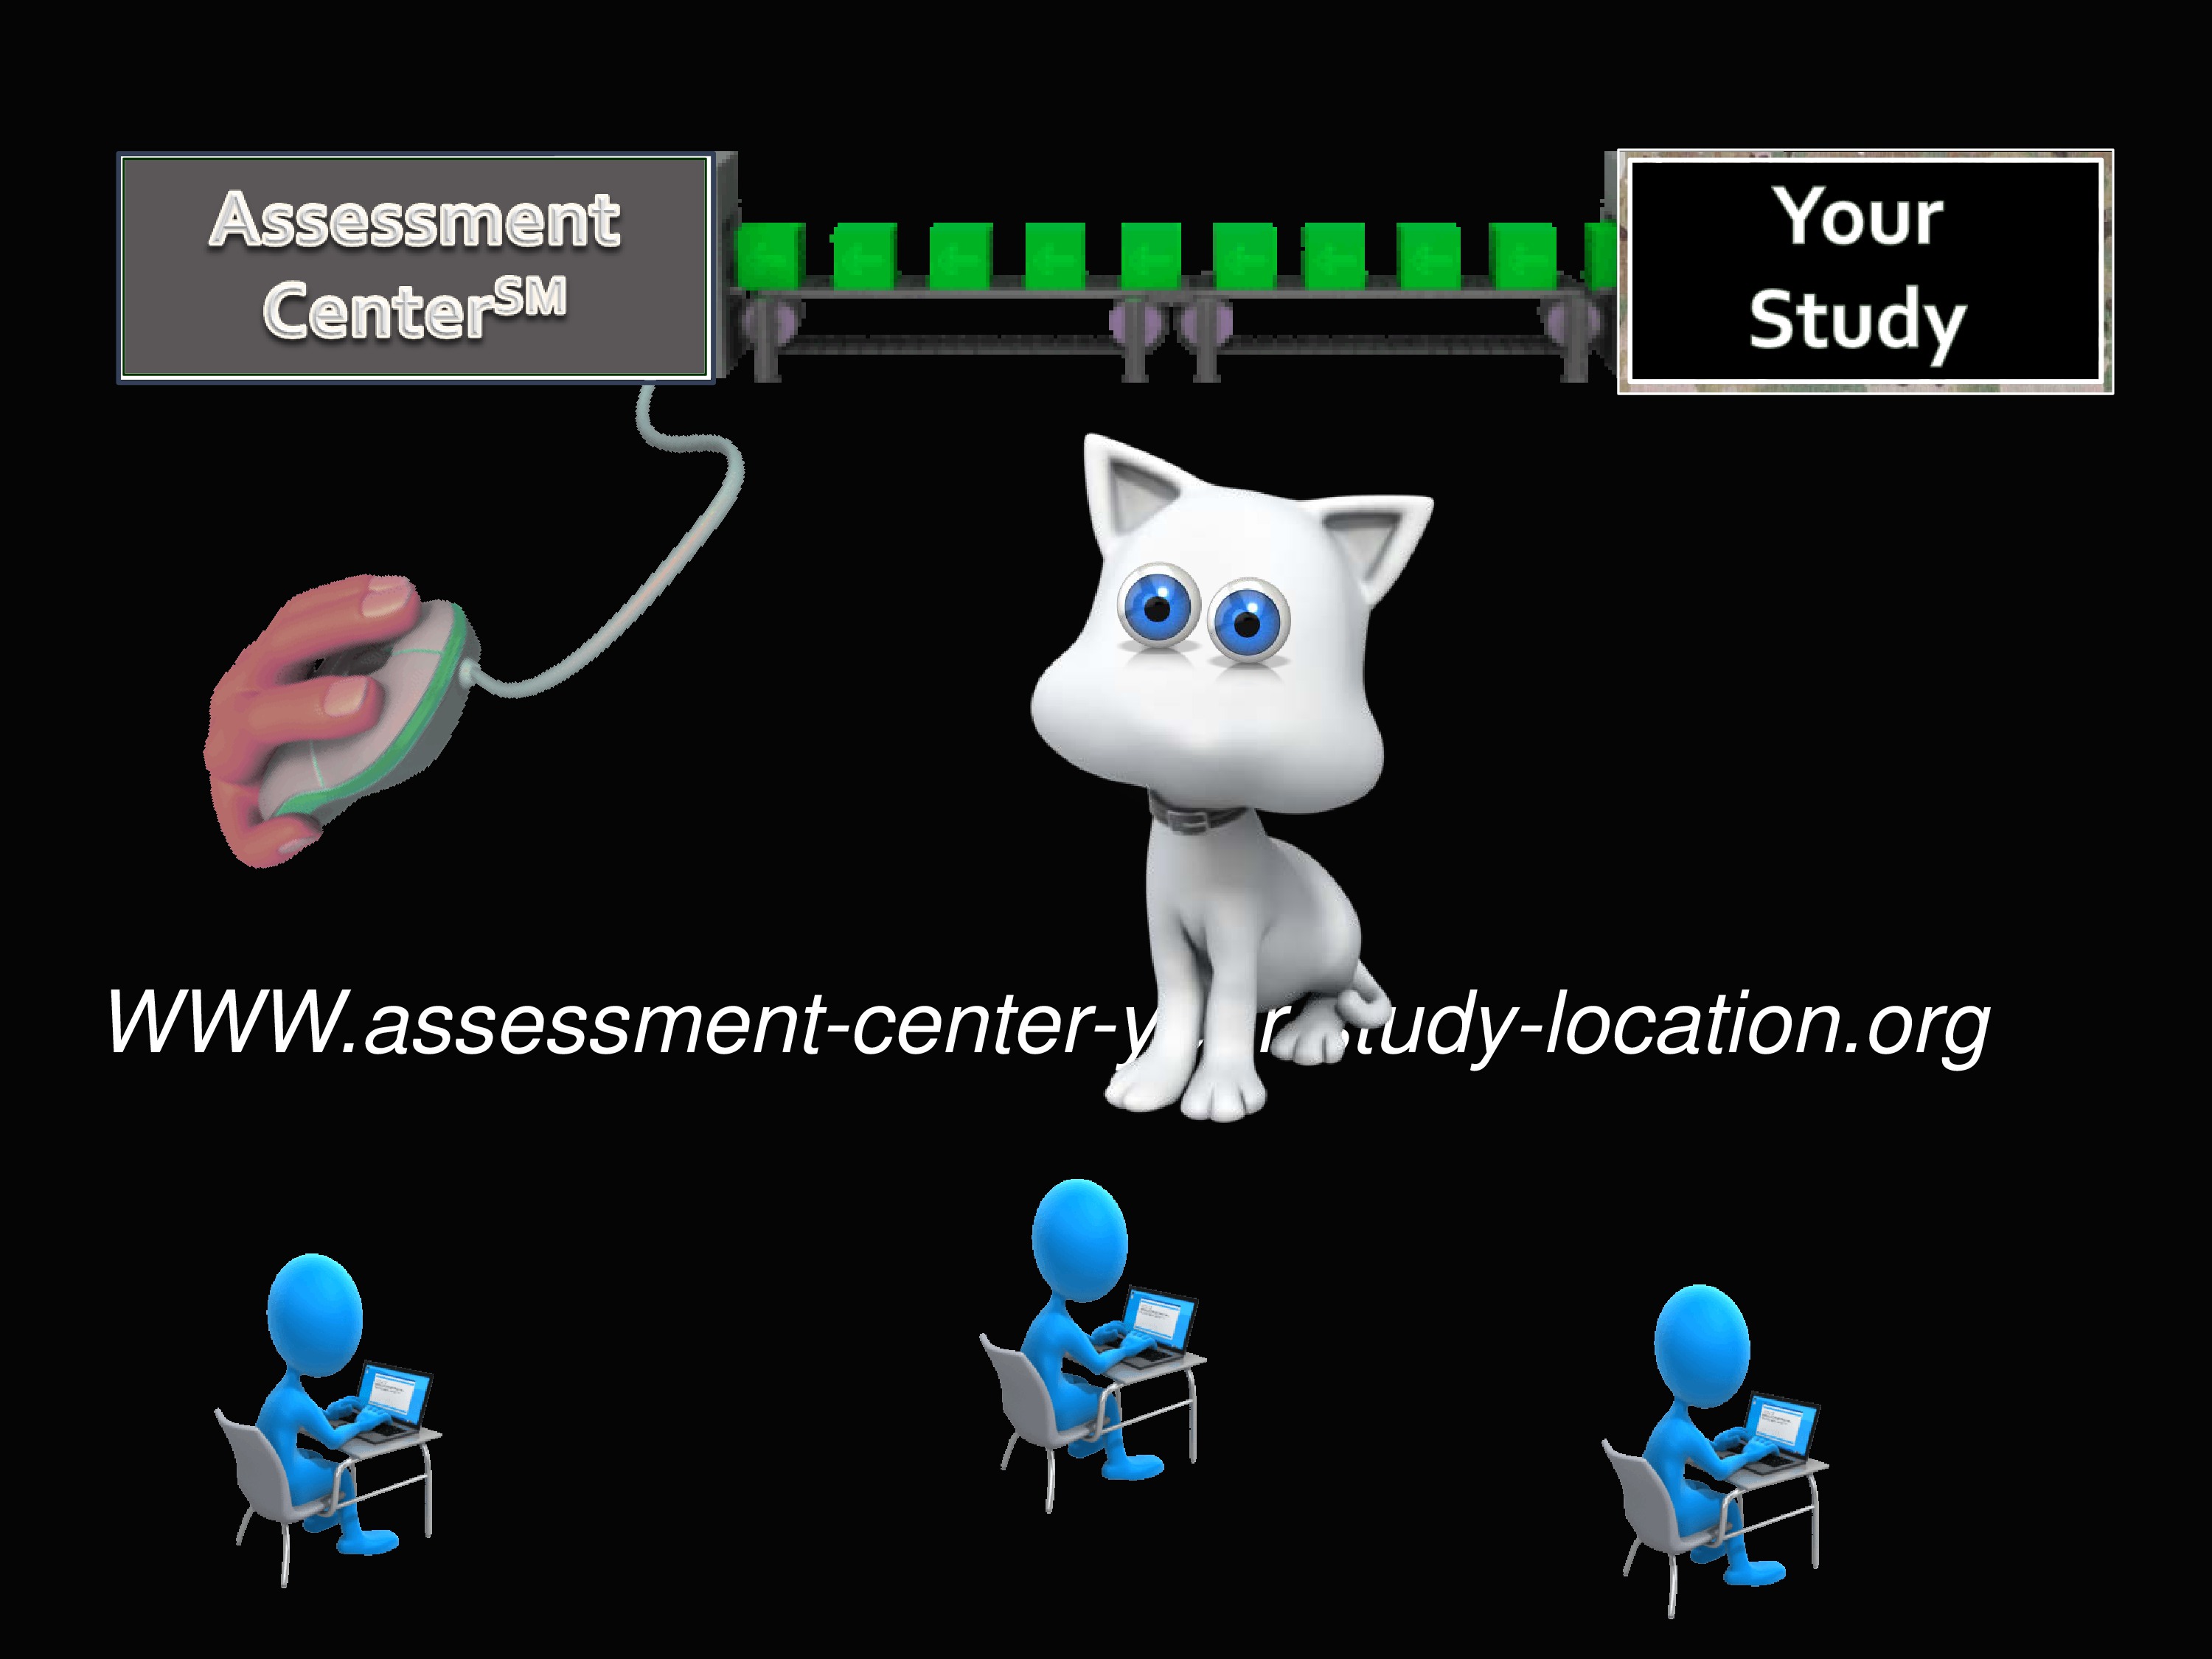
Again, once your study is loaded into the Assessment Center with its own particular hybridization, you get your website. Everybody you give that link to is able to go to that website and take your assessment.
And you can do it by CAT.
Toolbox Scope and Strategy
Now I’m going to shift to NIH Toolbox a little bit. There is the website.
The Toolbox scope is a little different than PROMIS. The idea behind PROMIS was to develop measures of outcomes that were important to a lot of different chronic conditions. Toolbox, on the other hand, was funded by the NINDS. Their focus is much more narrow in terms of sets of things. But in some ways, the things that are measured are broader. I’ll show you what I mean in a minute.
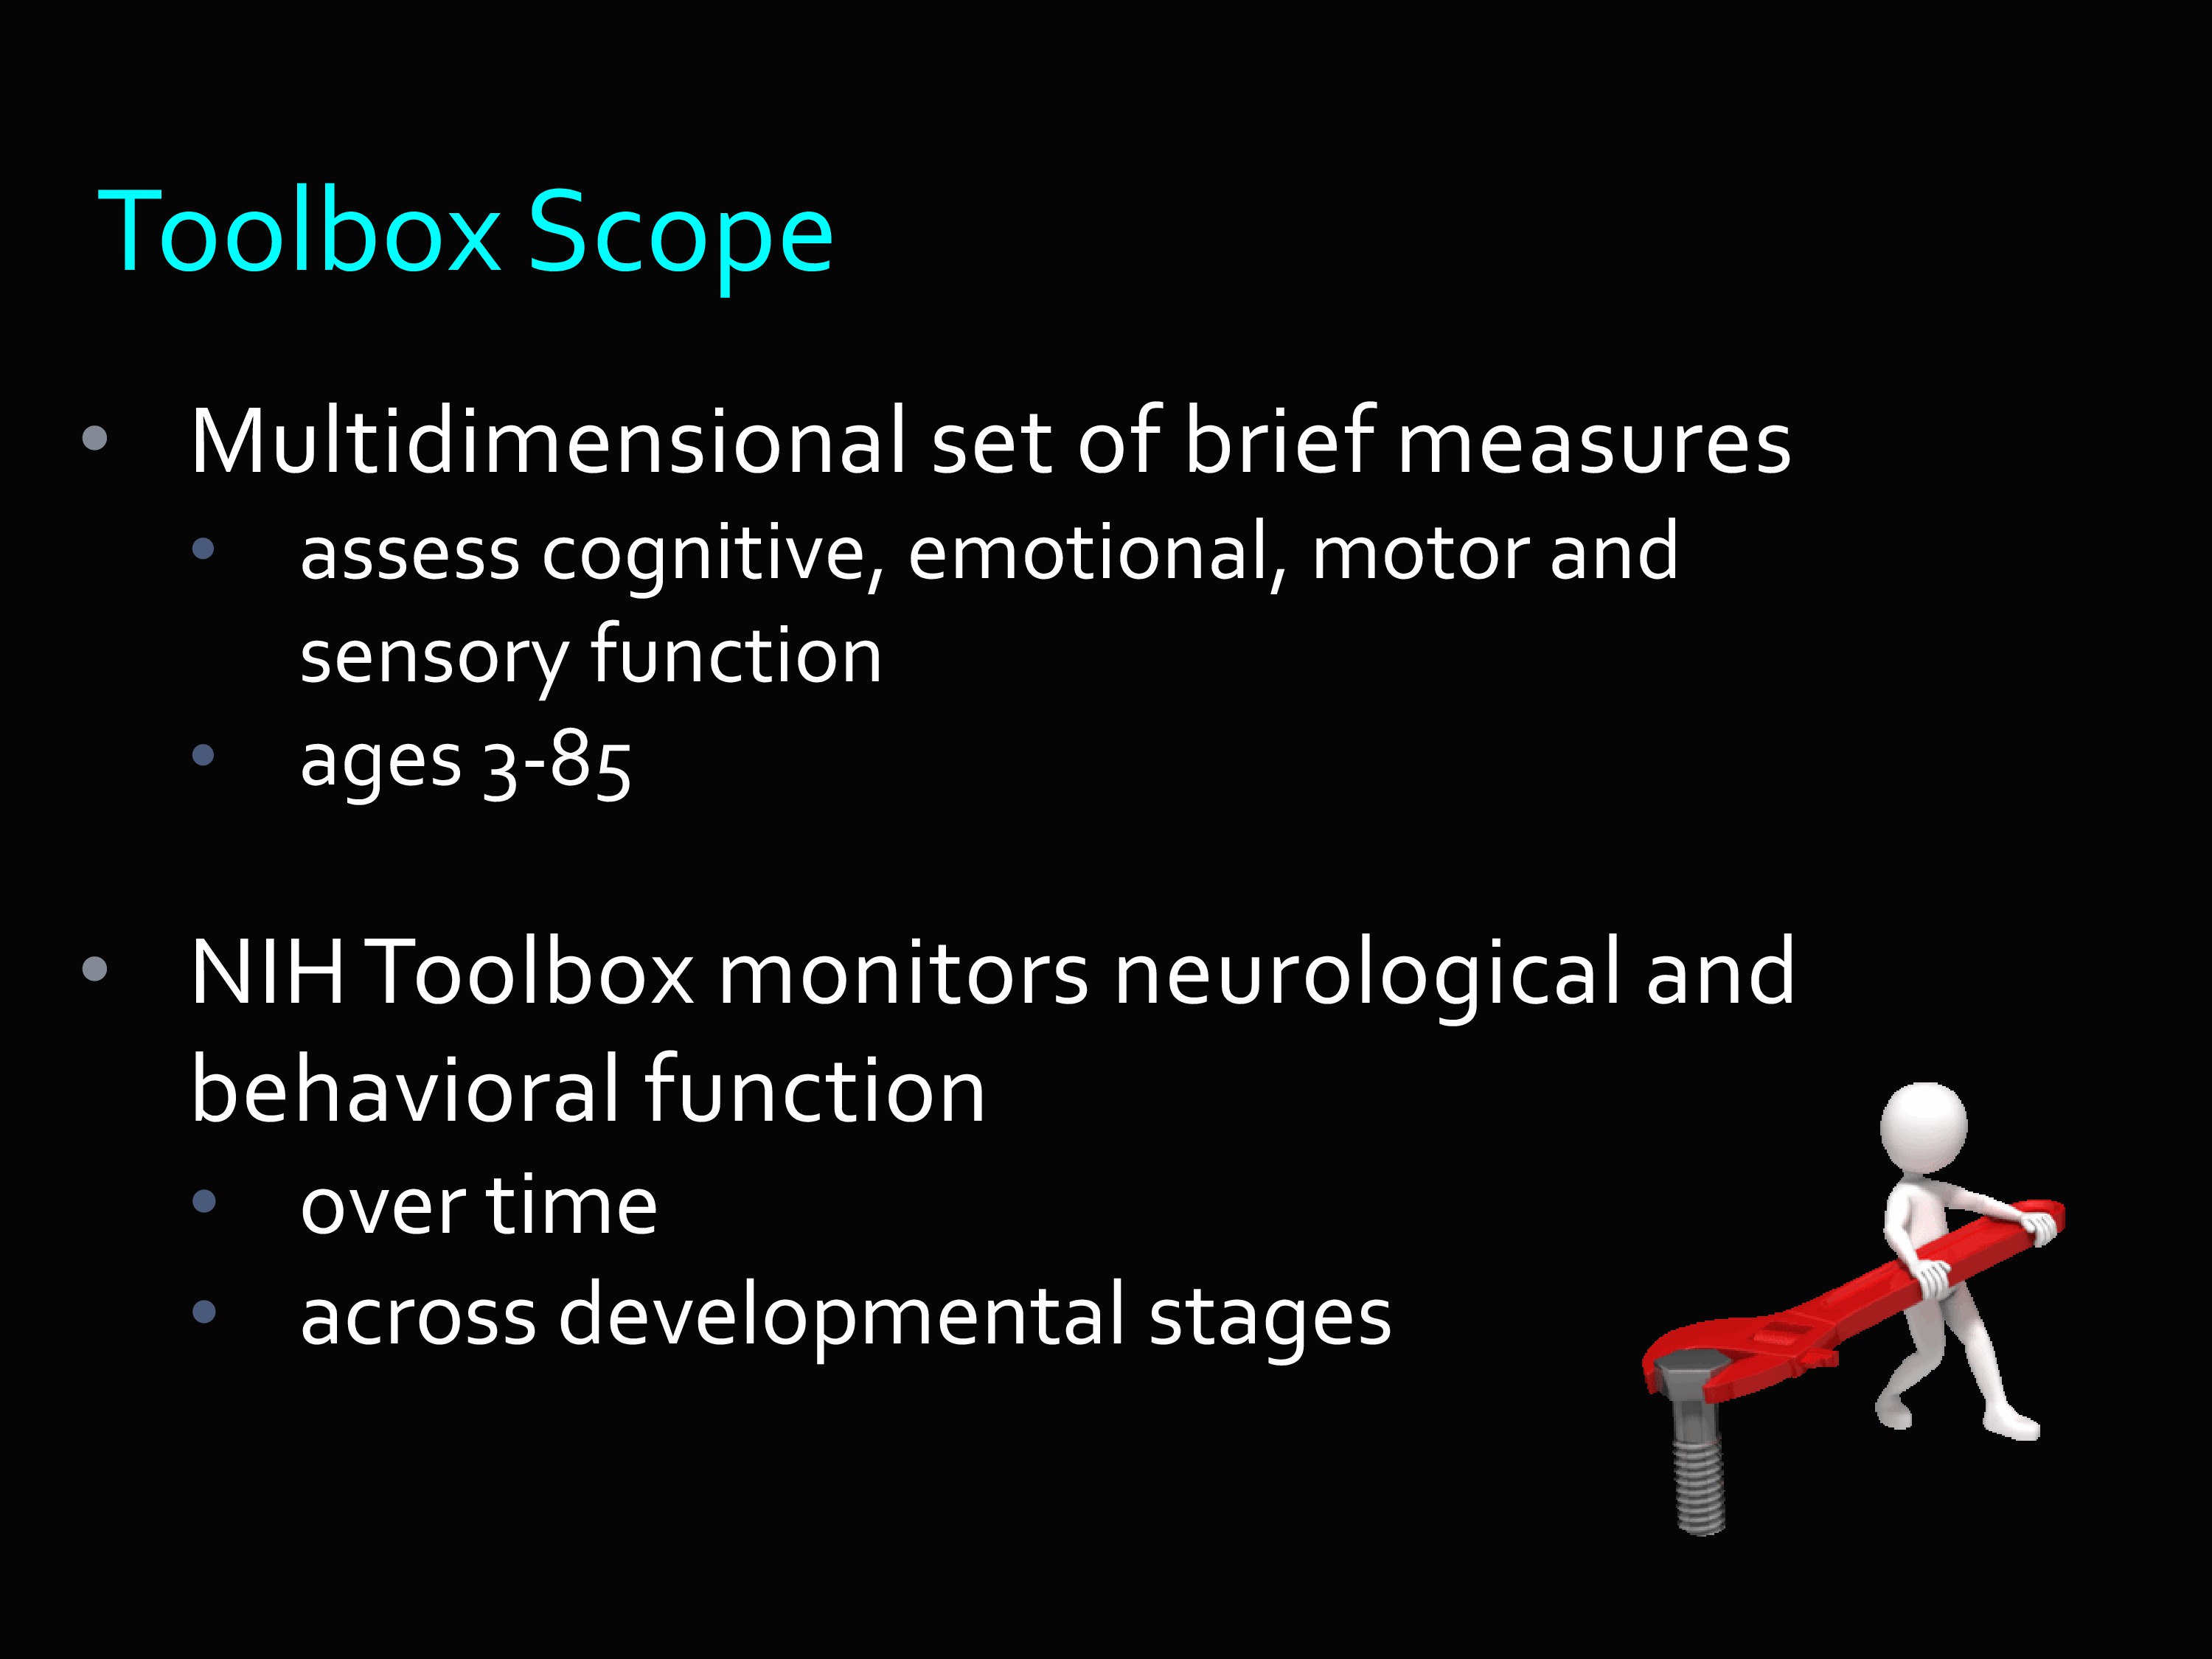
The idea was to get multidimensional sets of brief measures that could assess cognitive, emotional, motor and sensory function.
And it was very important that it could do it across the lifespan. From age 3 to 85.
NIH Toolbox is a collection of neurological and behavioral measures, over time and across developmental stages.
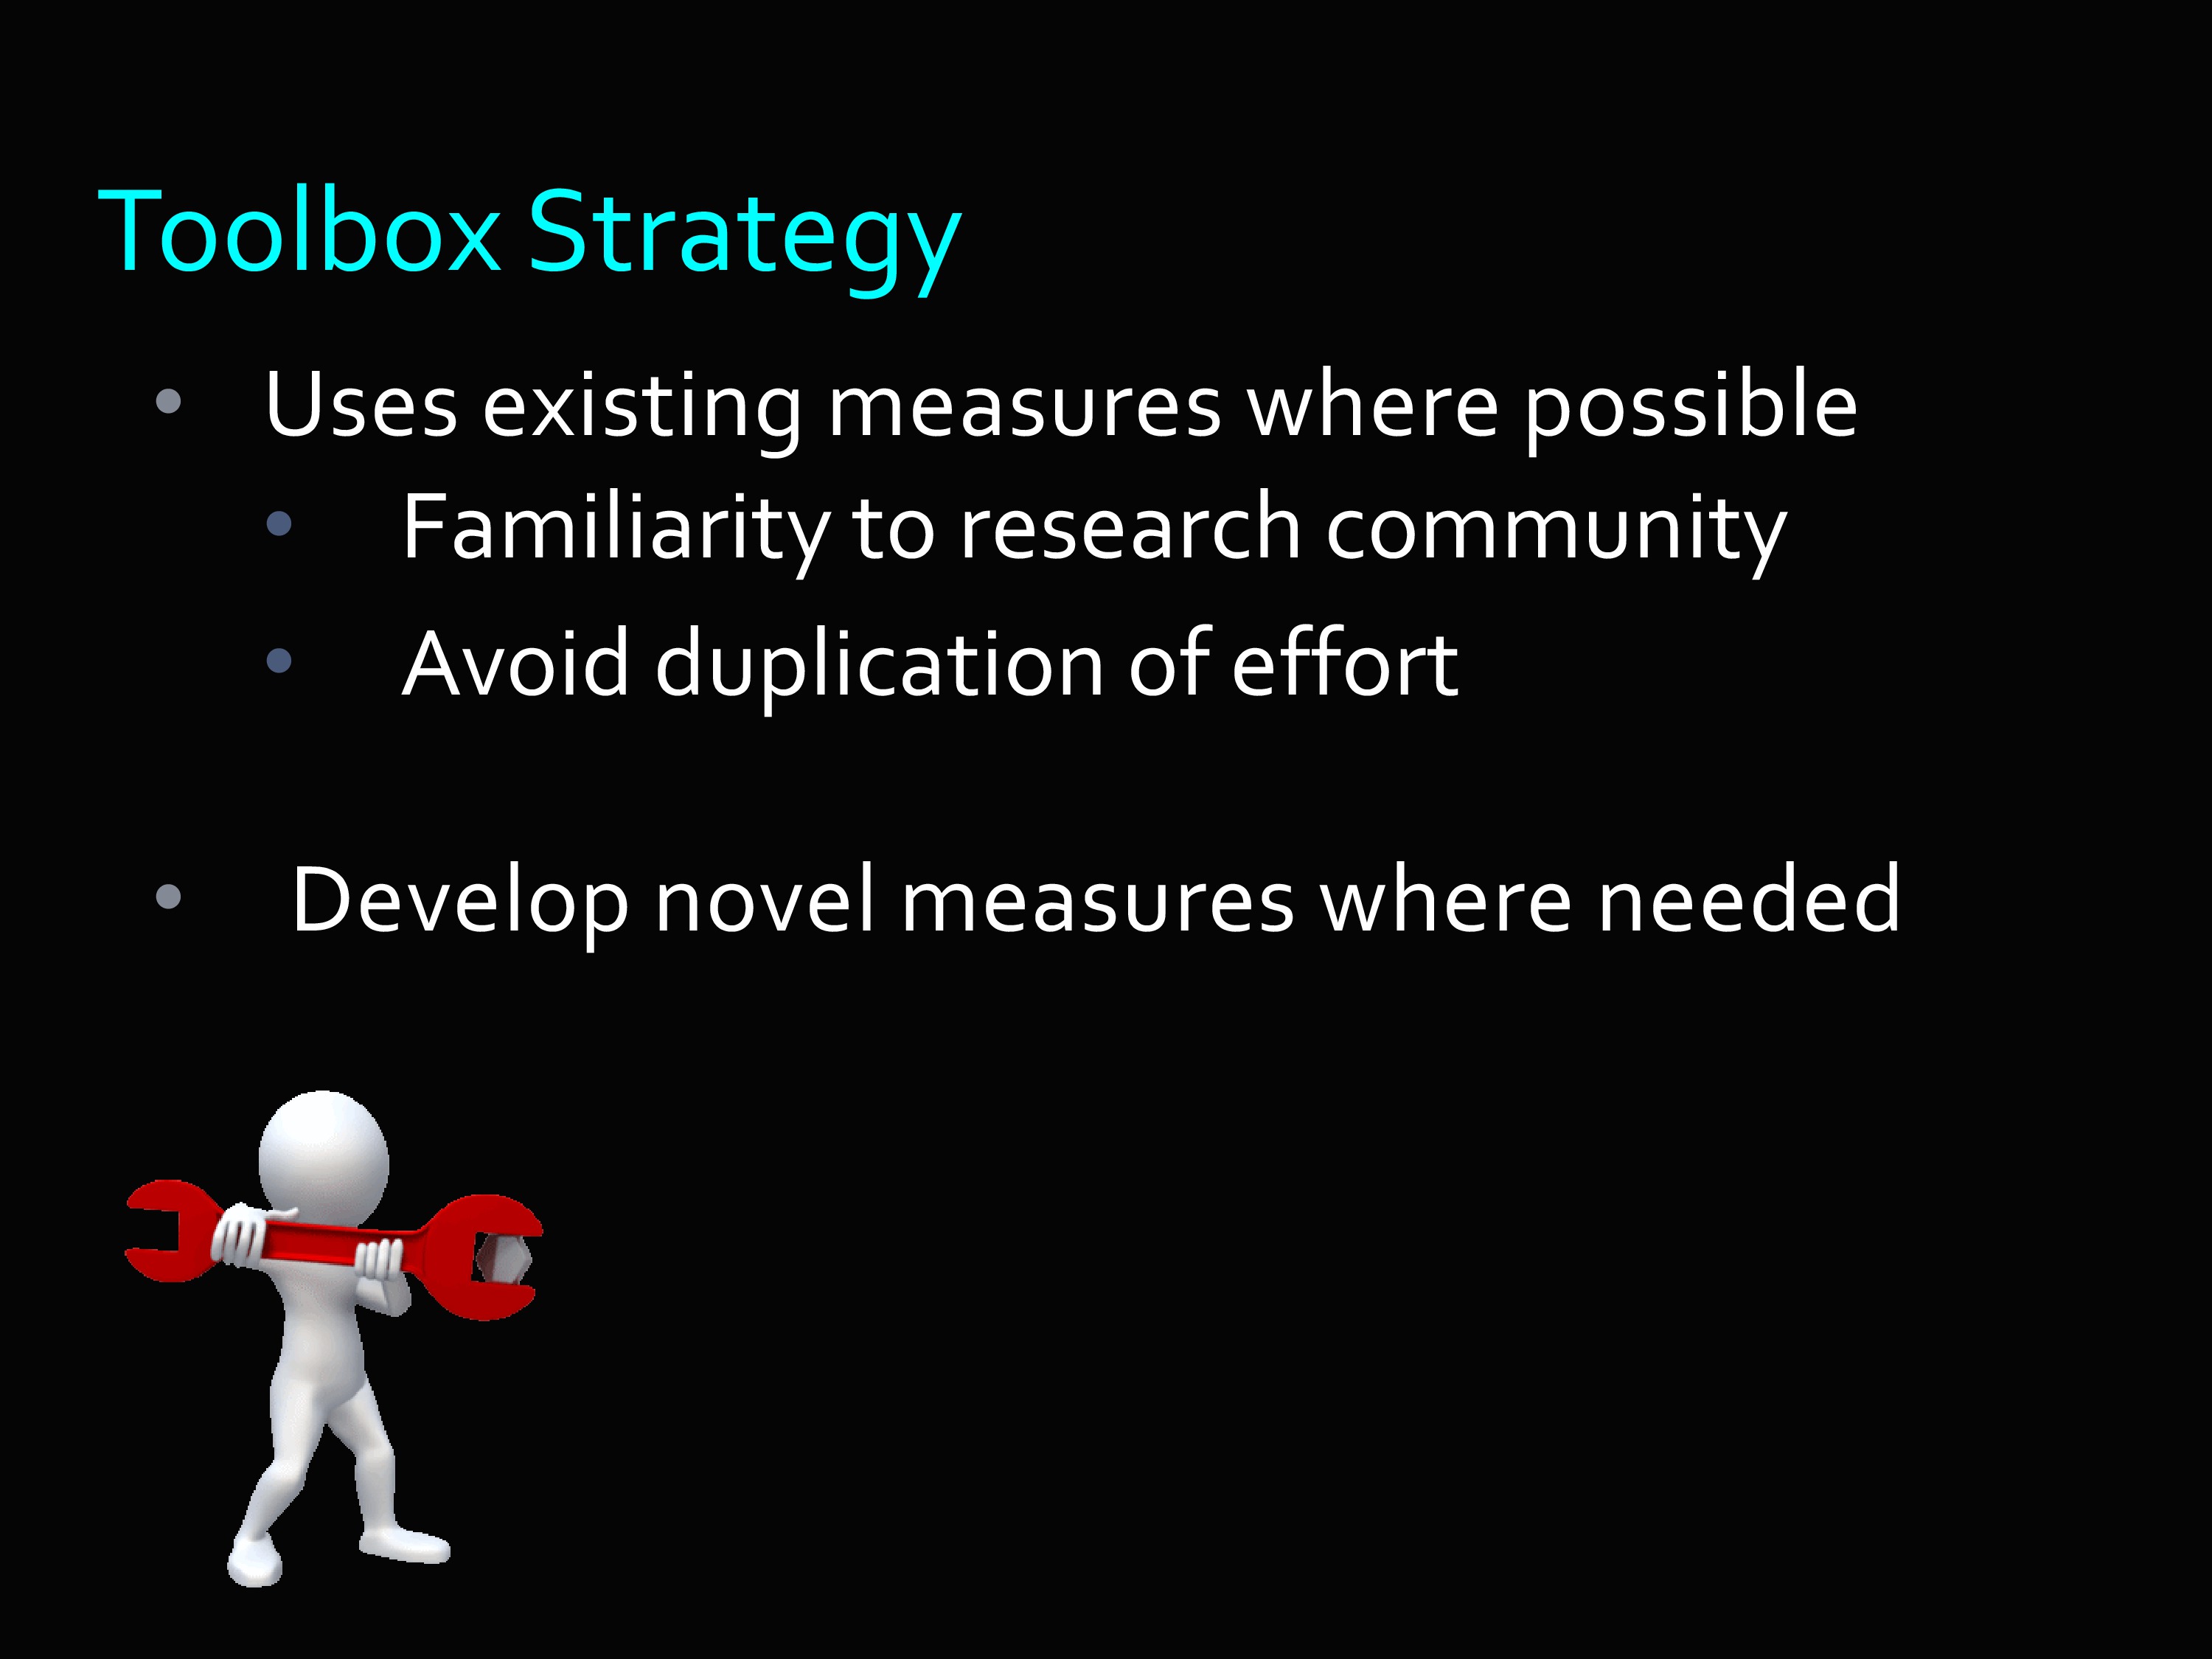
The strategy of developing the Toolbox was first — if there is an existing measure out there that does a good job, then great. Adopt it.
The reason is, it’s familiar already to the research community, and it avoids duplication of effort.
By the way, all of the Toolbox measures — there’s no royalty fees or anything associated with it. This is literally your tax dollars at work.
When, in fact, there was no good option, Toolbox used novel strategies to develop measures where needed.
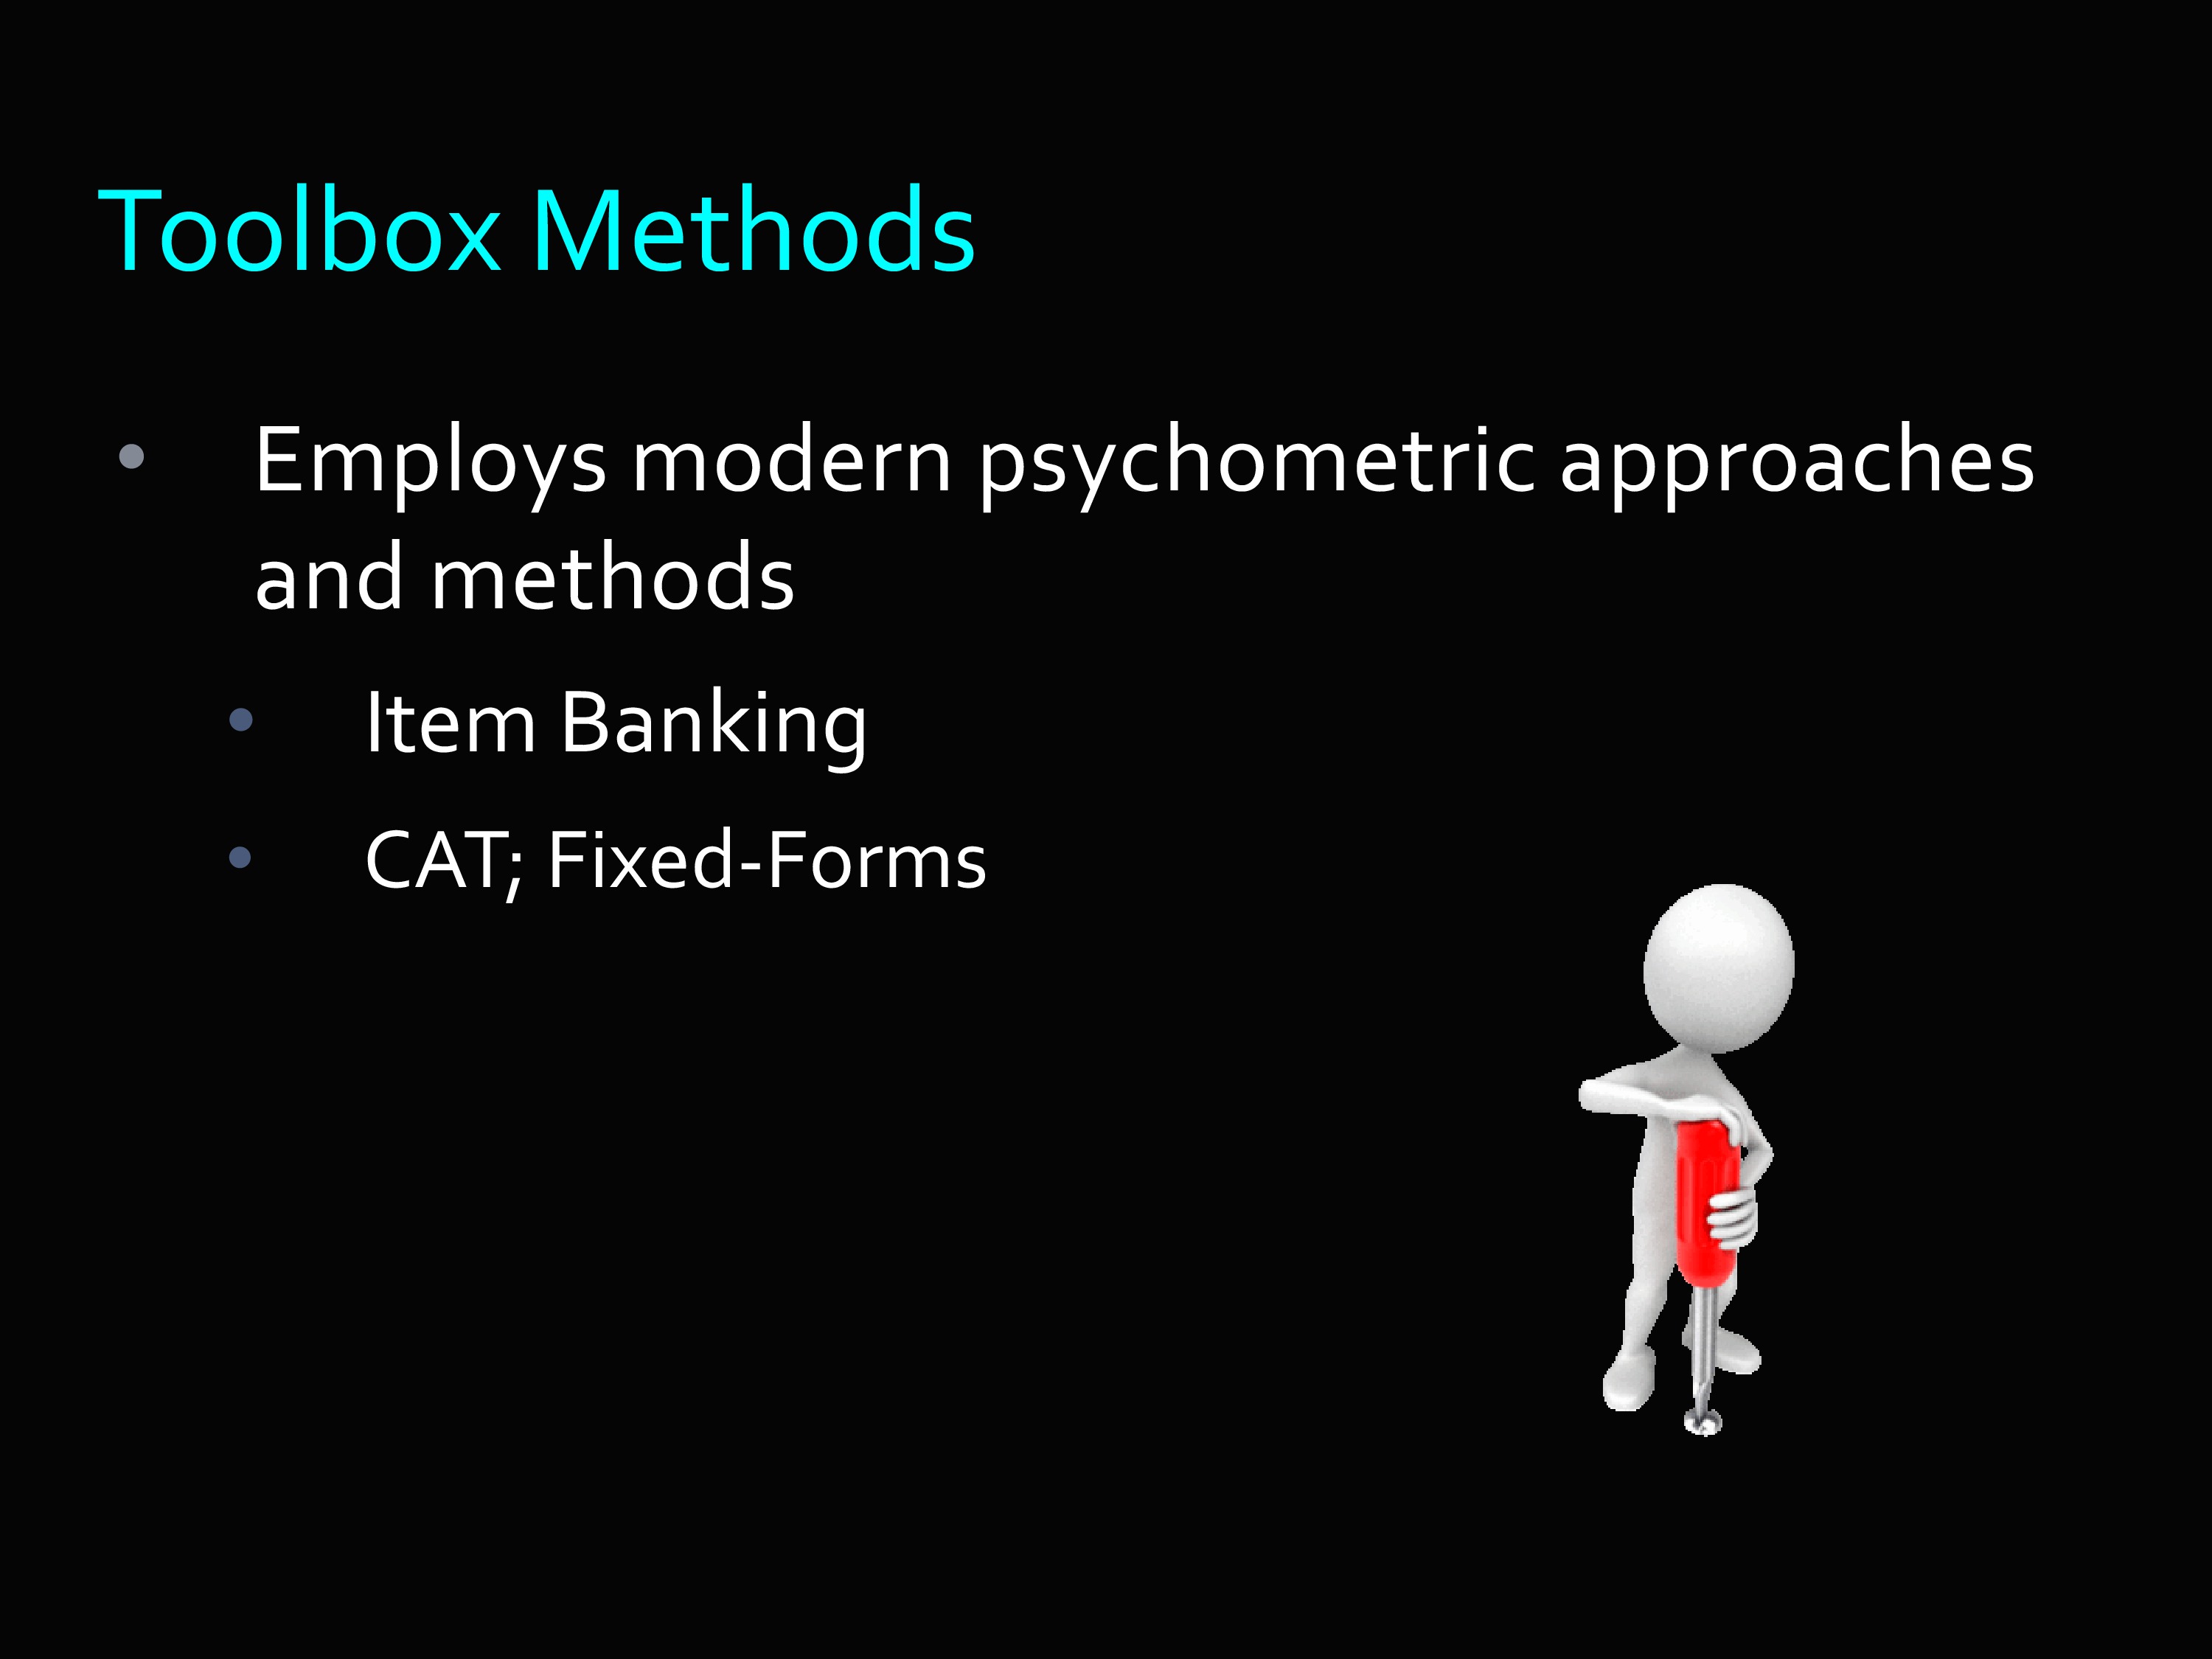
Just like PROMIS, Toolbox used modern psychometric approaches and methods by developing item banks, by making it so you could administer using CAT and fixed forms.
I really think that, though, there are some advantages to CAT and the tools that PROMIS uses, where you really see CAT shine is in the NIH Toolbox.
And the reason is the kinds of things that are measured — including things that are right/wrong like memory and vocabulary and things like that. CAT makes it more efficient to use self-report measures about emotion, fatigue and things like that. But on the right/wrong measures, it really increases efficiency.
In fact, you can get similar efficiency with right/wrong or yes/no type answers with about a tenth the number of items when using a CAT. You get maybe a 40% increase with self-report Likert-type items, because those items are really spreading across a whole range or trait. But dichotomous items are targeting one level of trait at a time.

Which reminds me of this cartoon. You see the test examiner behind the desk: “For a fair selection, everybody has to take the same exam. Please climb that tree.”
Toolbox is trying to avoid everybody climbing that tree.
Toolbox Framework

I mentioned that this is across the lifespan. Which means that some of the measures for the younger group are self-administered, but some are also parent report — parent or proxy.
The age divisions for the Toolbox are adult, defined as over 18. Then 13-17, 8-12, 3-7. So there are often different measures or different ways it’s administered depending on the age.
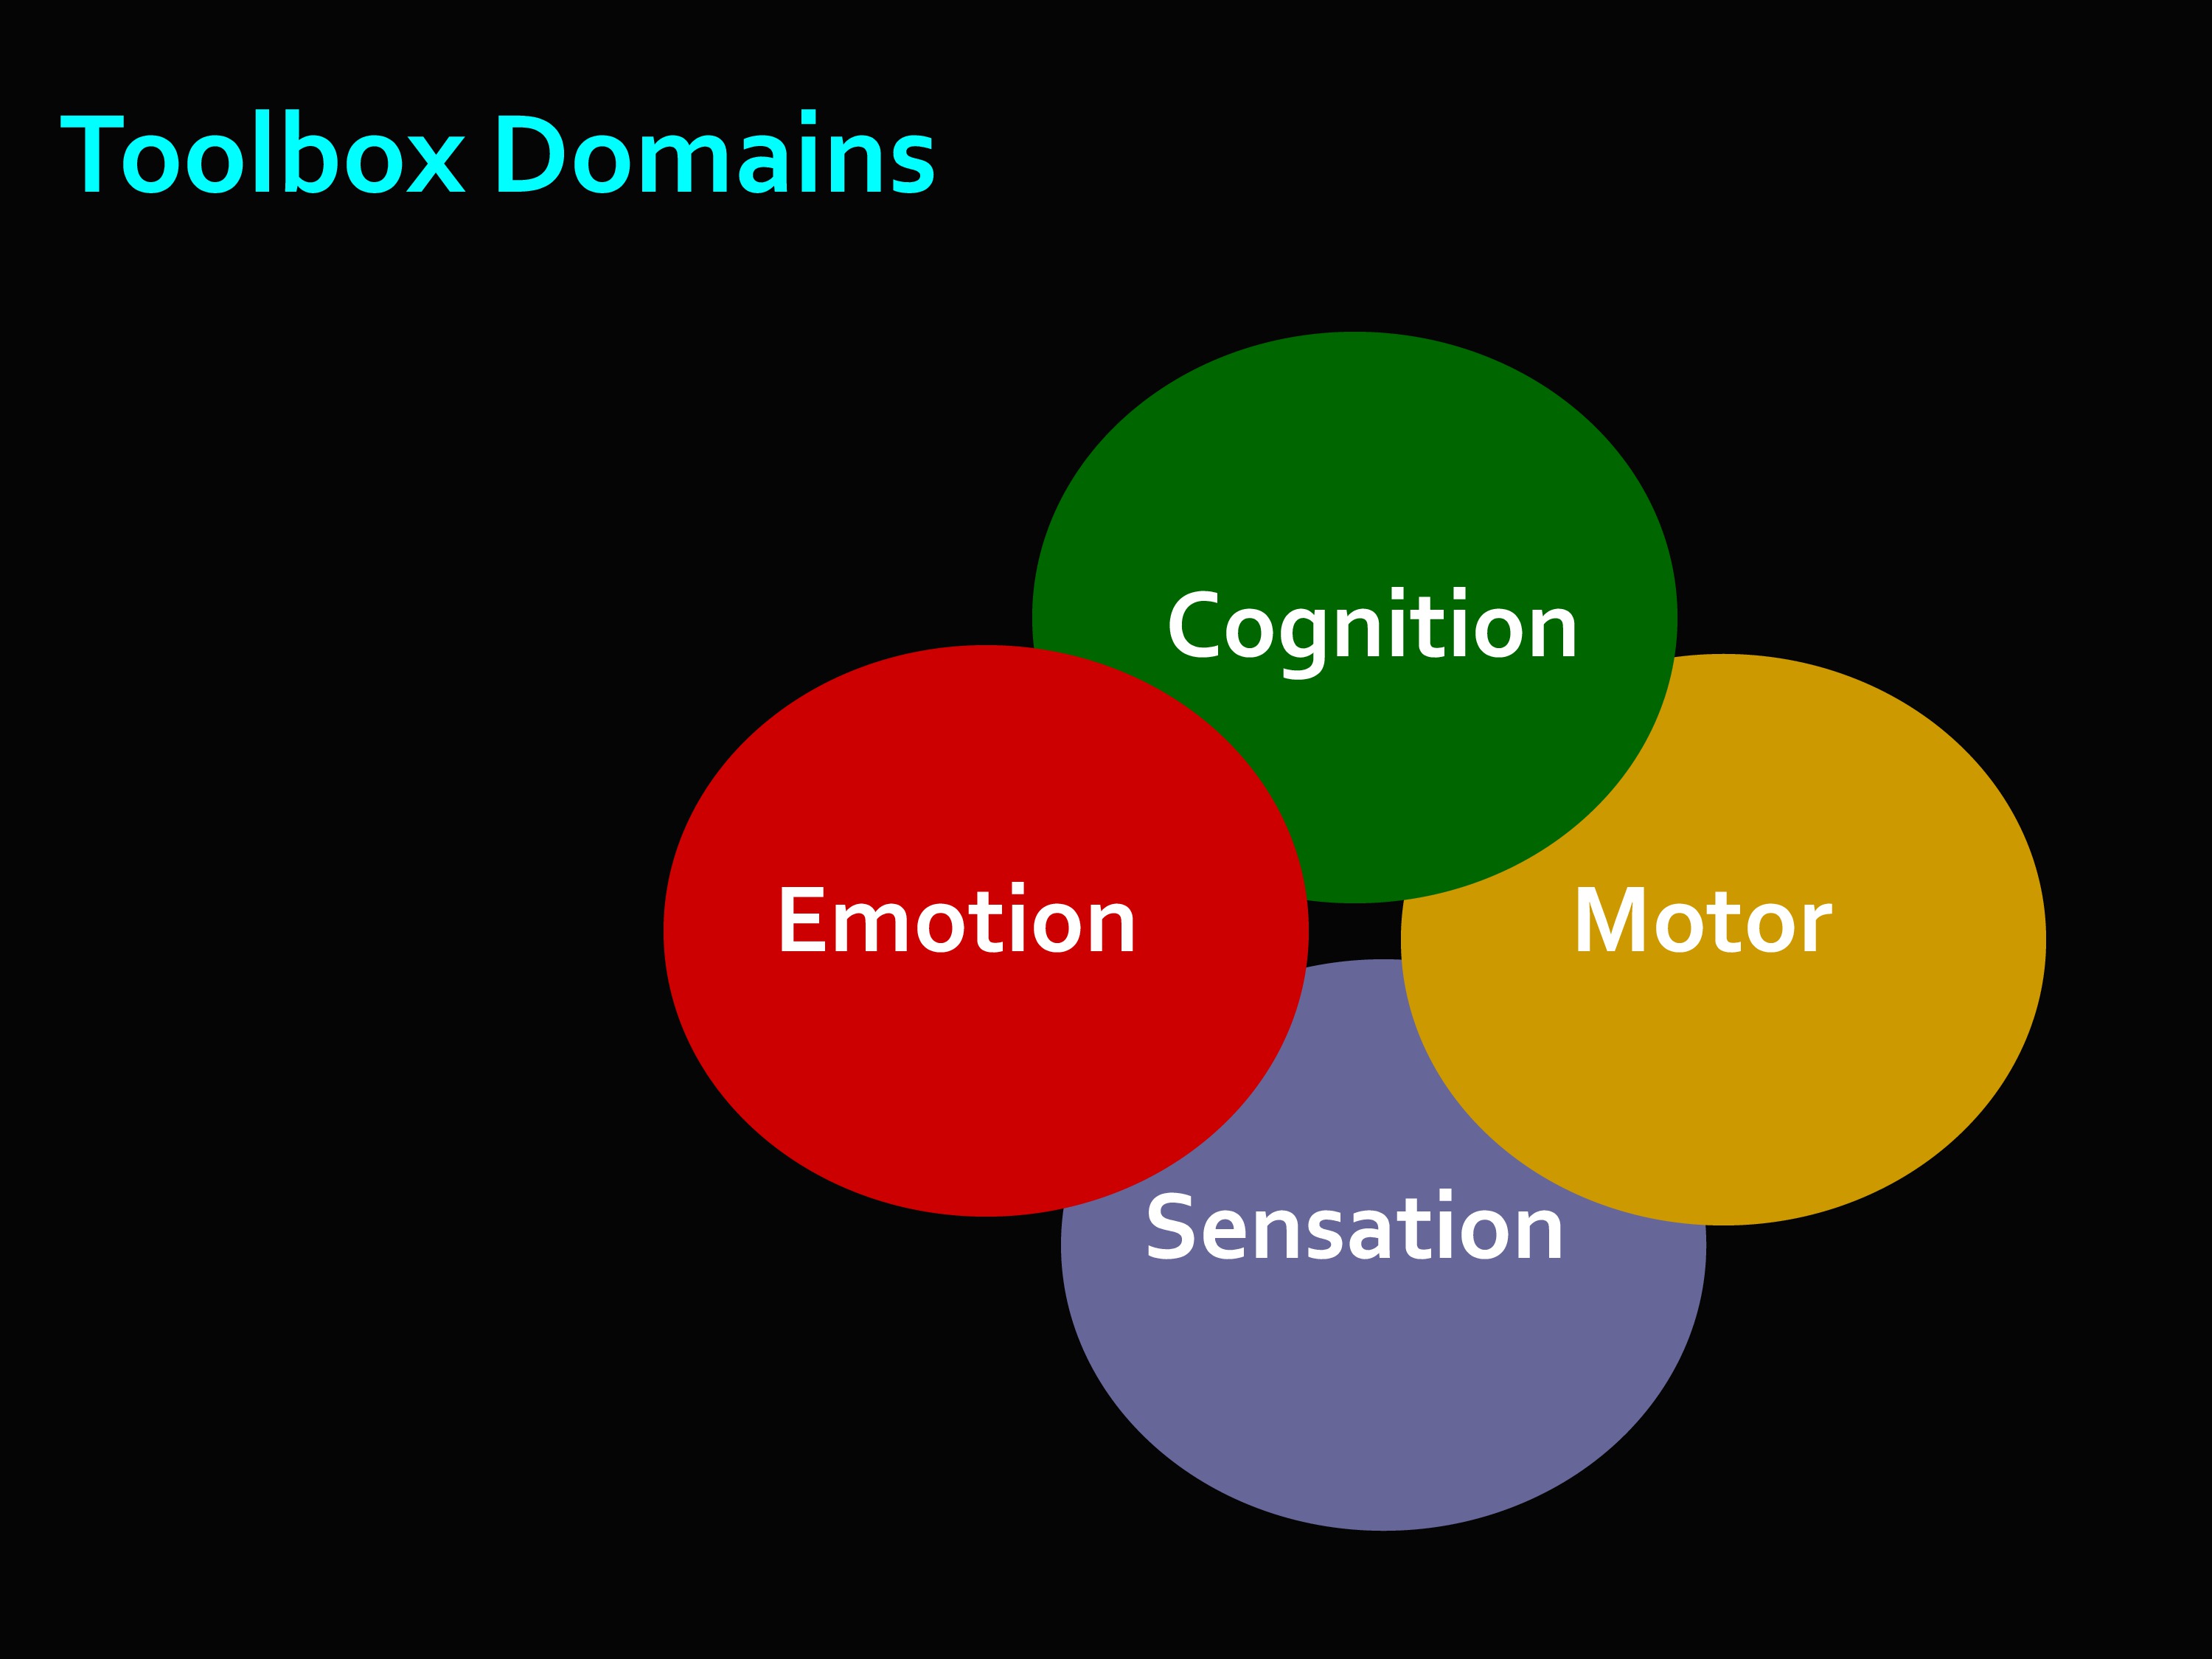
So let’s look at the Toolbox domains. These are the four large areas Toolbox decided to concentrate on: emotion, cognition, motor, and sensation.
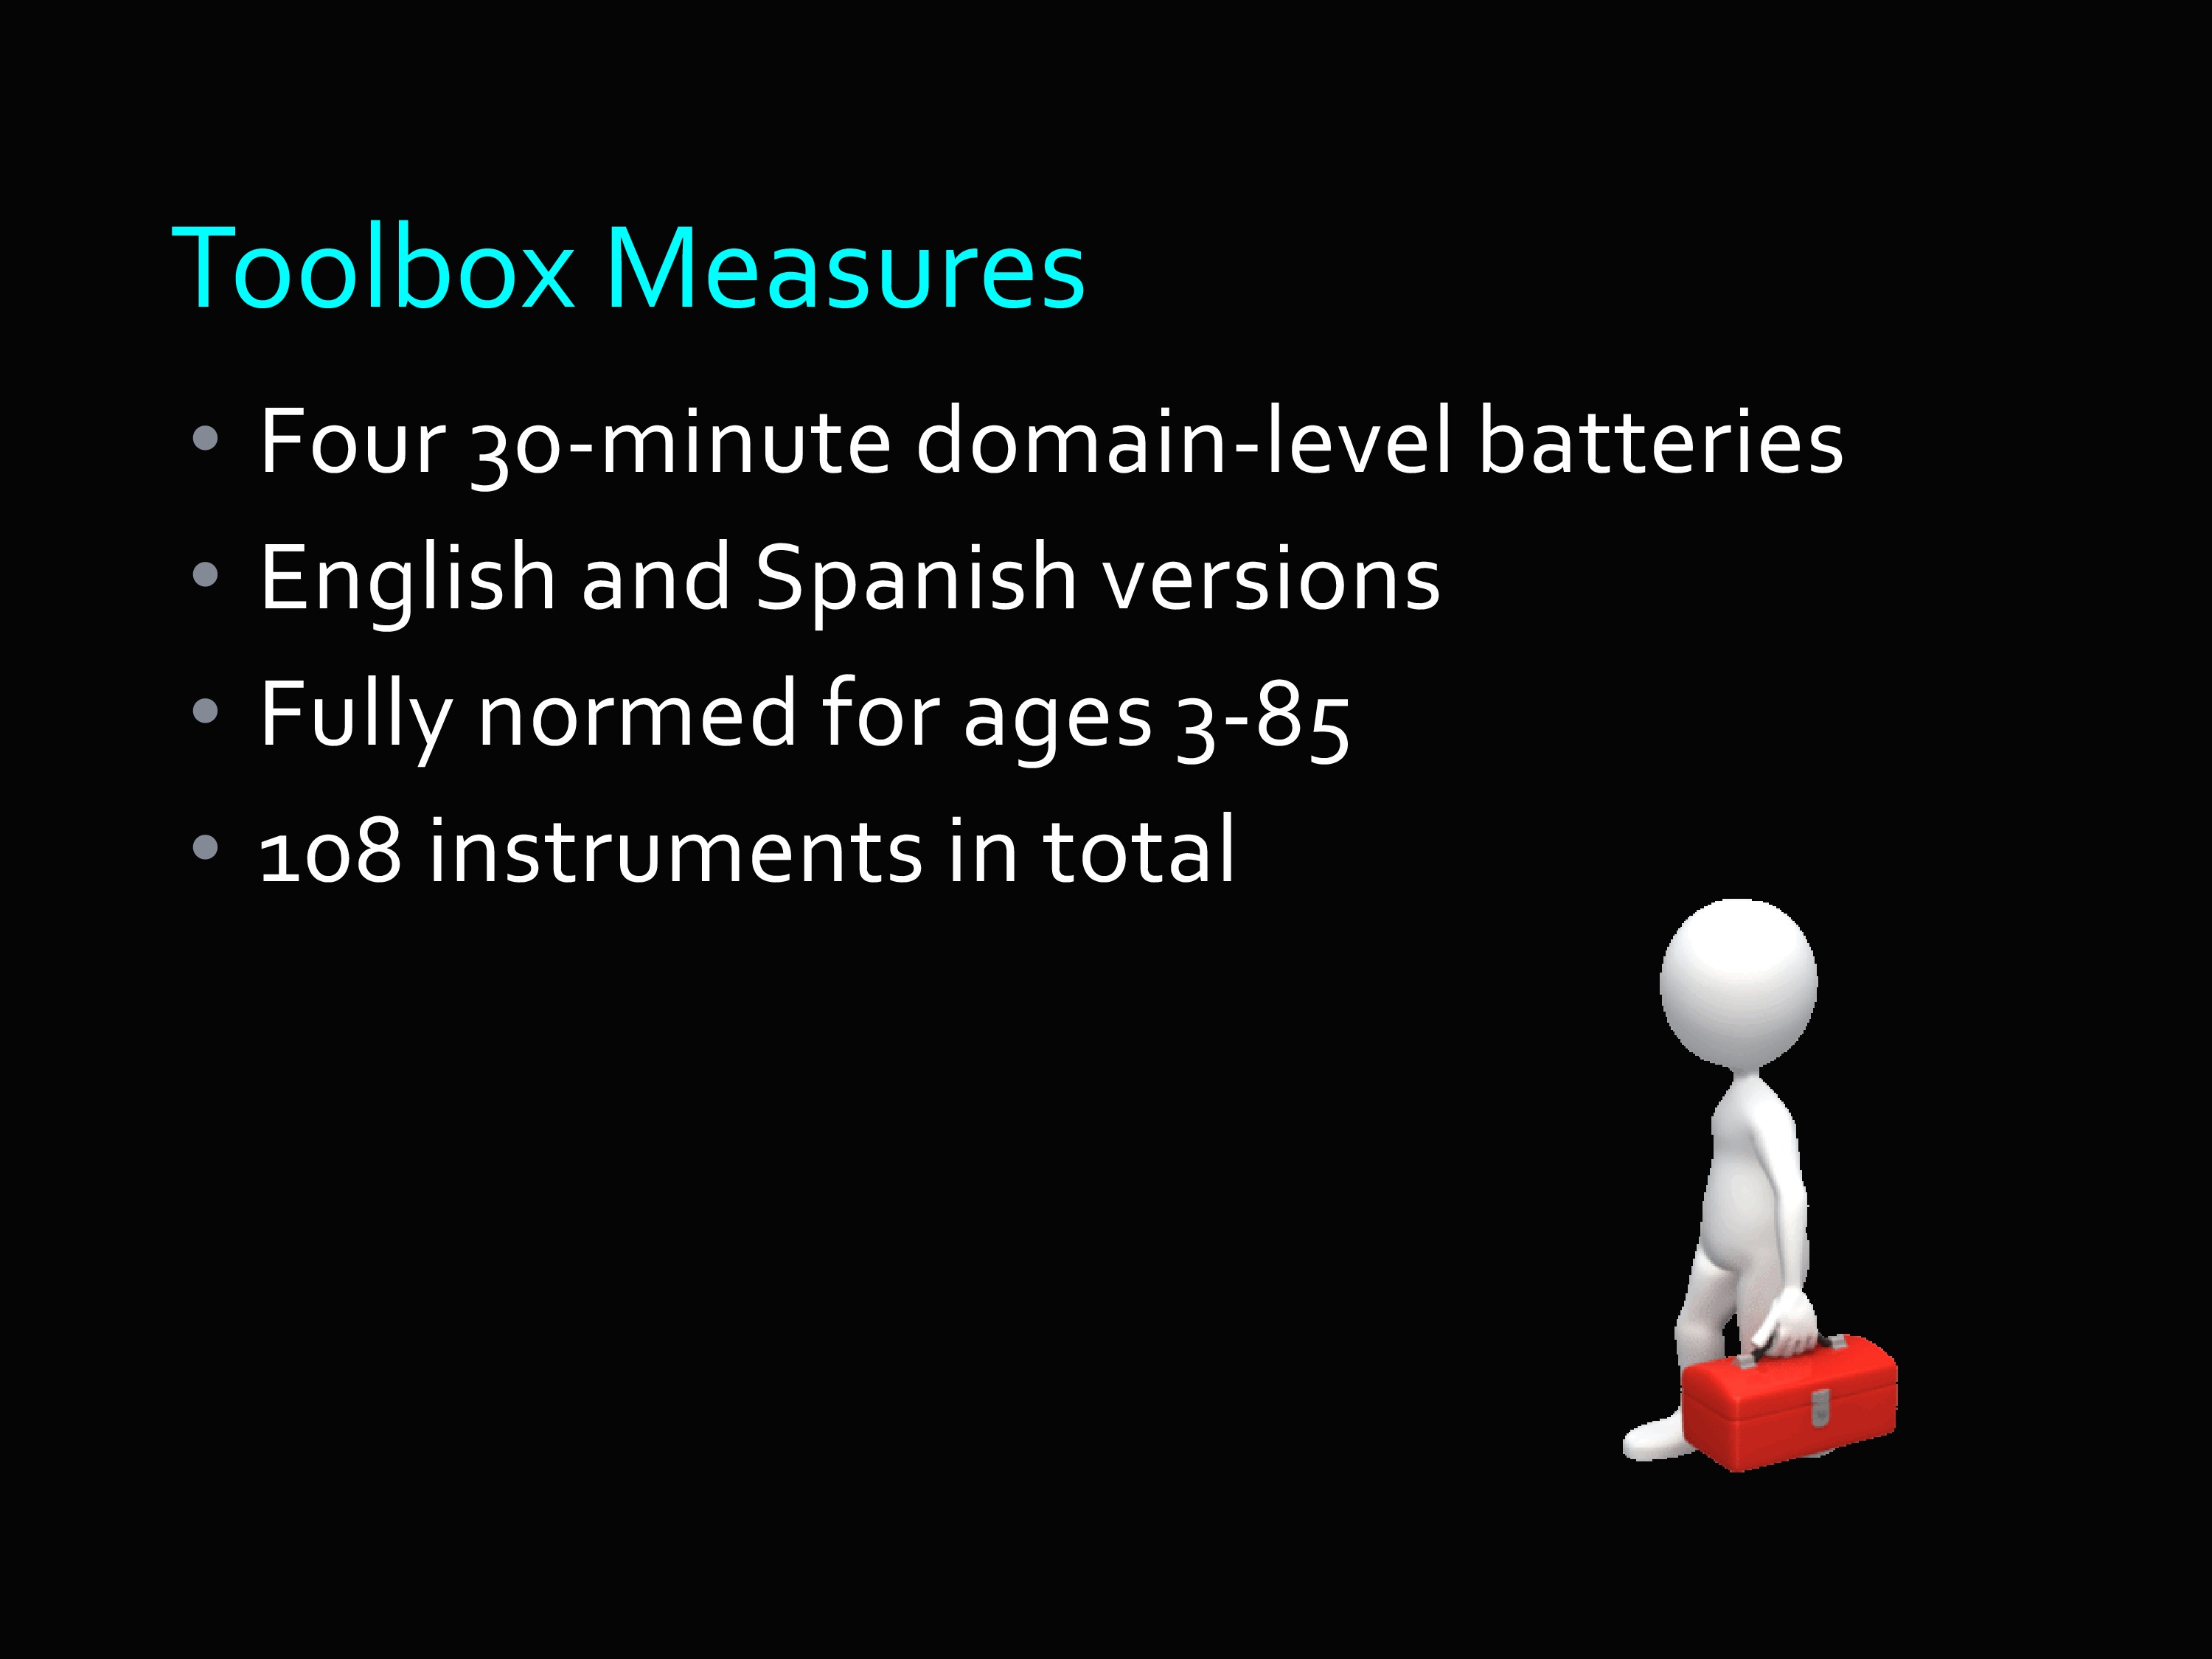
Let’s take a look at some of those. These four domains, the idea was to get batteries of tests — a battery is just a collection of measures — batteries that would take no more than 30 minutes to administer.
There was both English and Spanish versions. And they are fully normed, in the same way that I mentioned for PROMIS, for ages 3 to 85. That’s nice because you’ve got age-based norms as well as national norms.
There are 108 total instruments in the Toolbox. I said it takes 30 minutes to do a domain-level battery — some of these instruments are supplemental. So you might not choose to administer them.
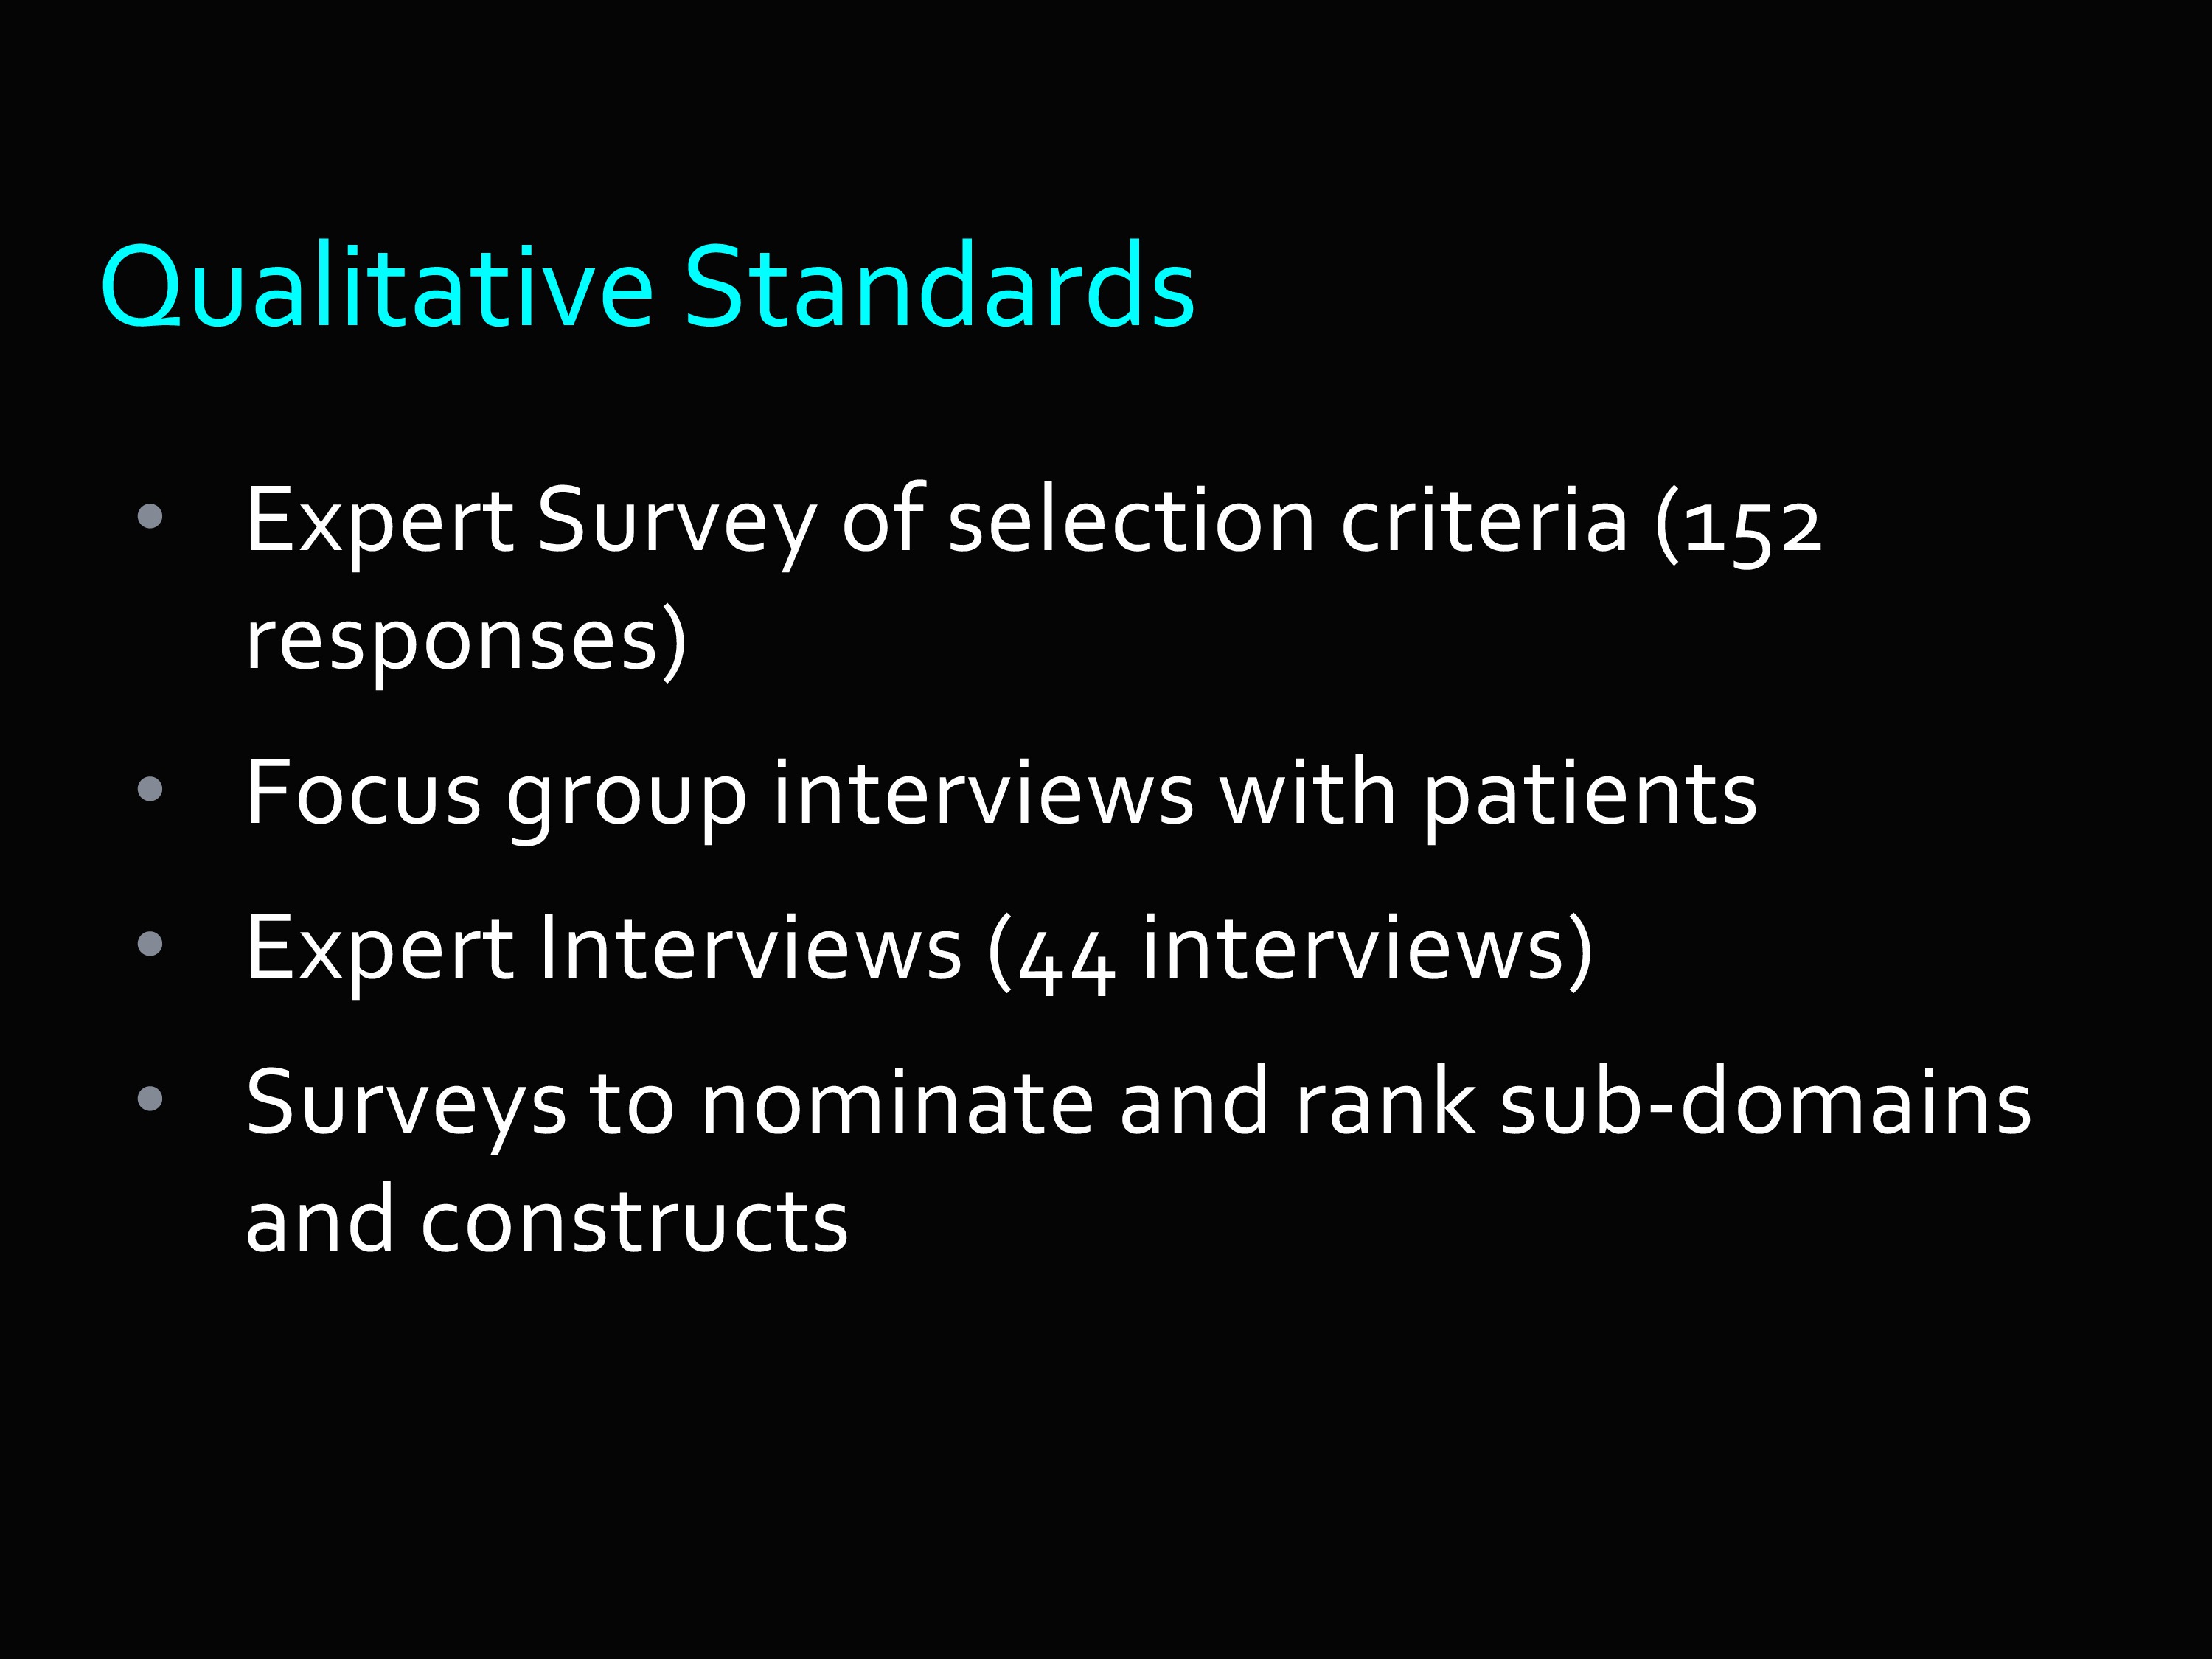
The qualitative standards are the same in Toolbox. Expert surveys were used to create selection criteria. Focus group interviews, expert interviews. Then they also administered surveys to people who were content experts in the field so they could nominate sub-domains and constructs and say what’s needed by the field, what’s important to you.
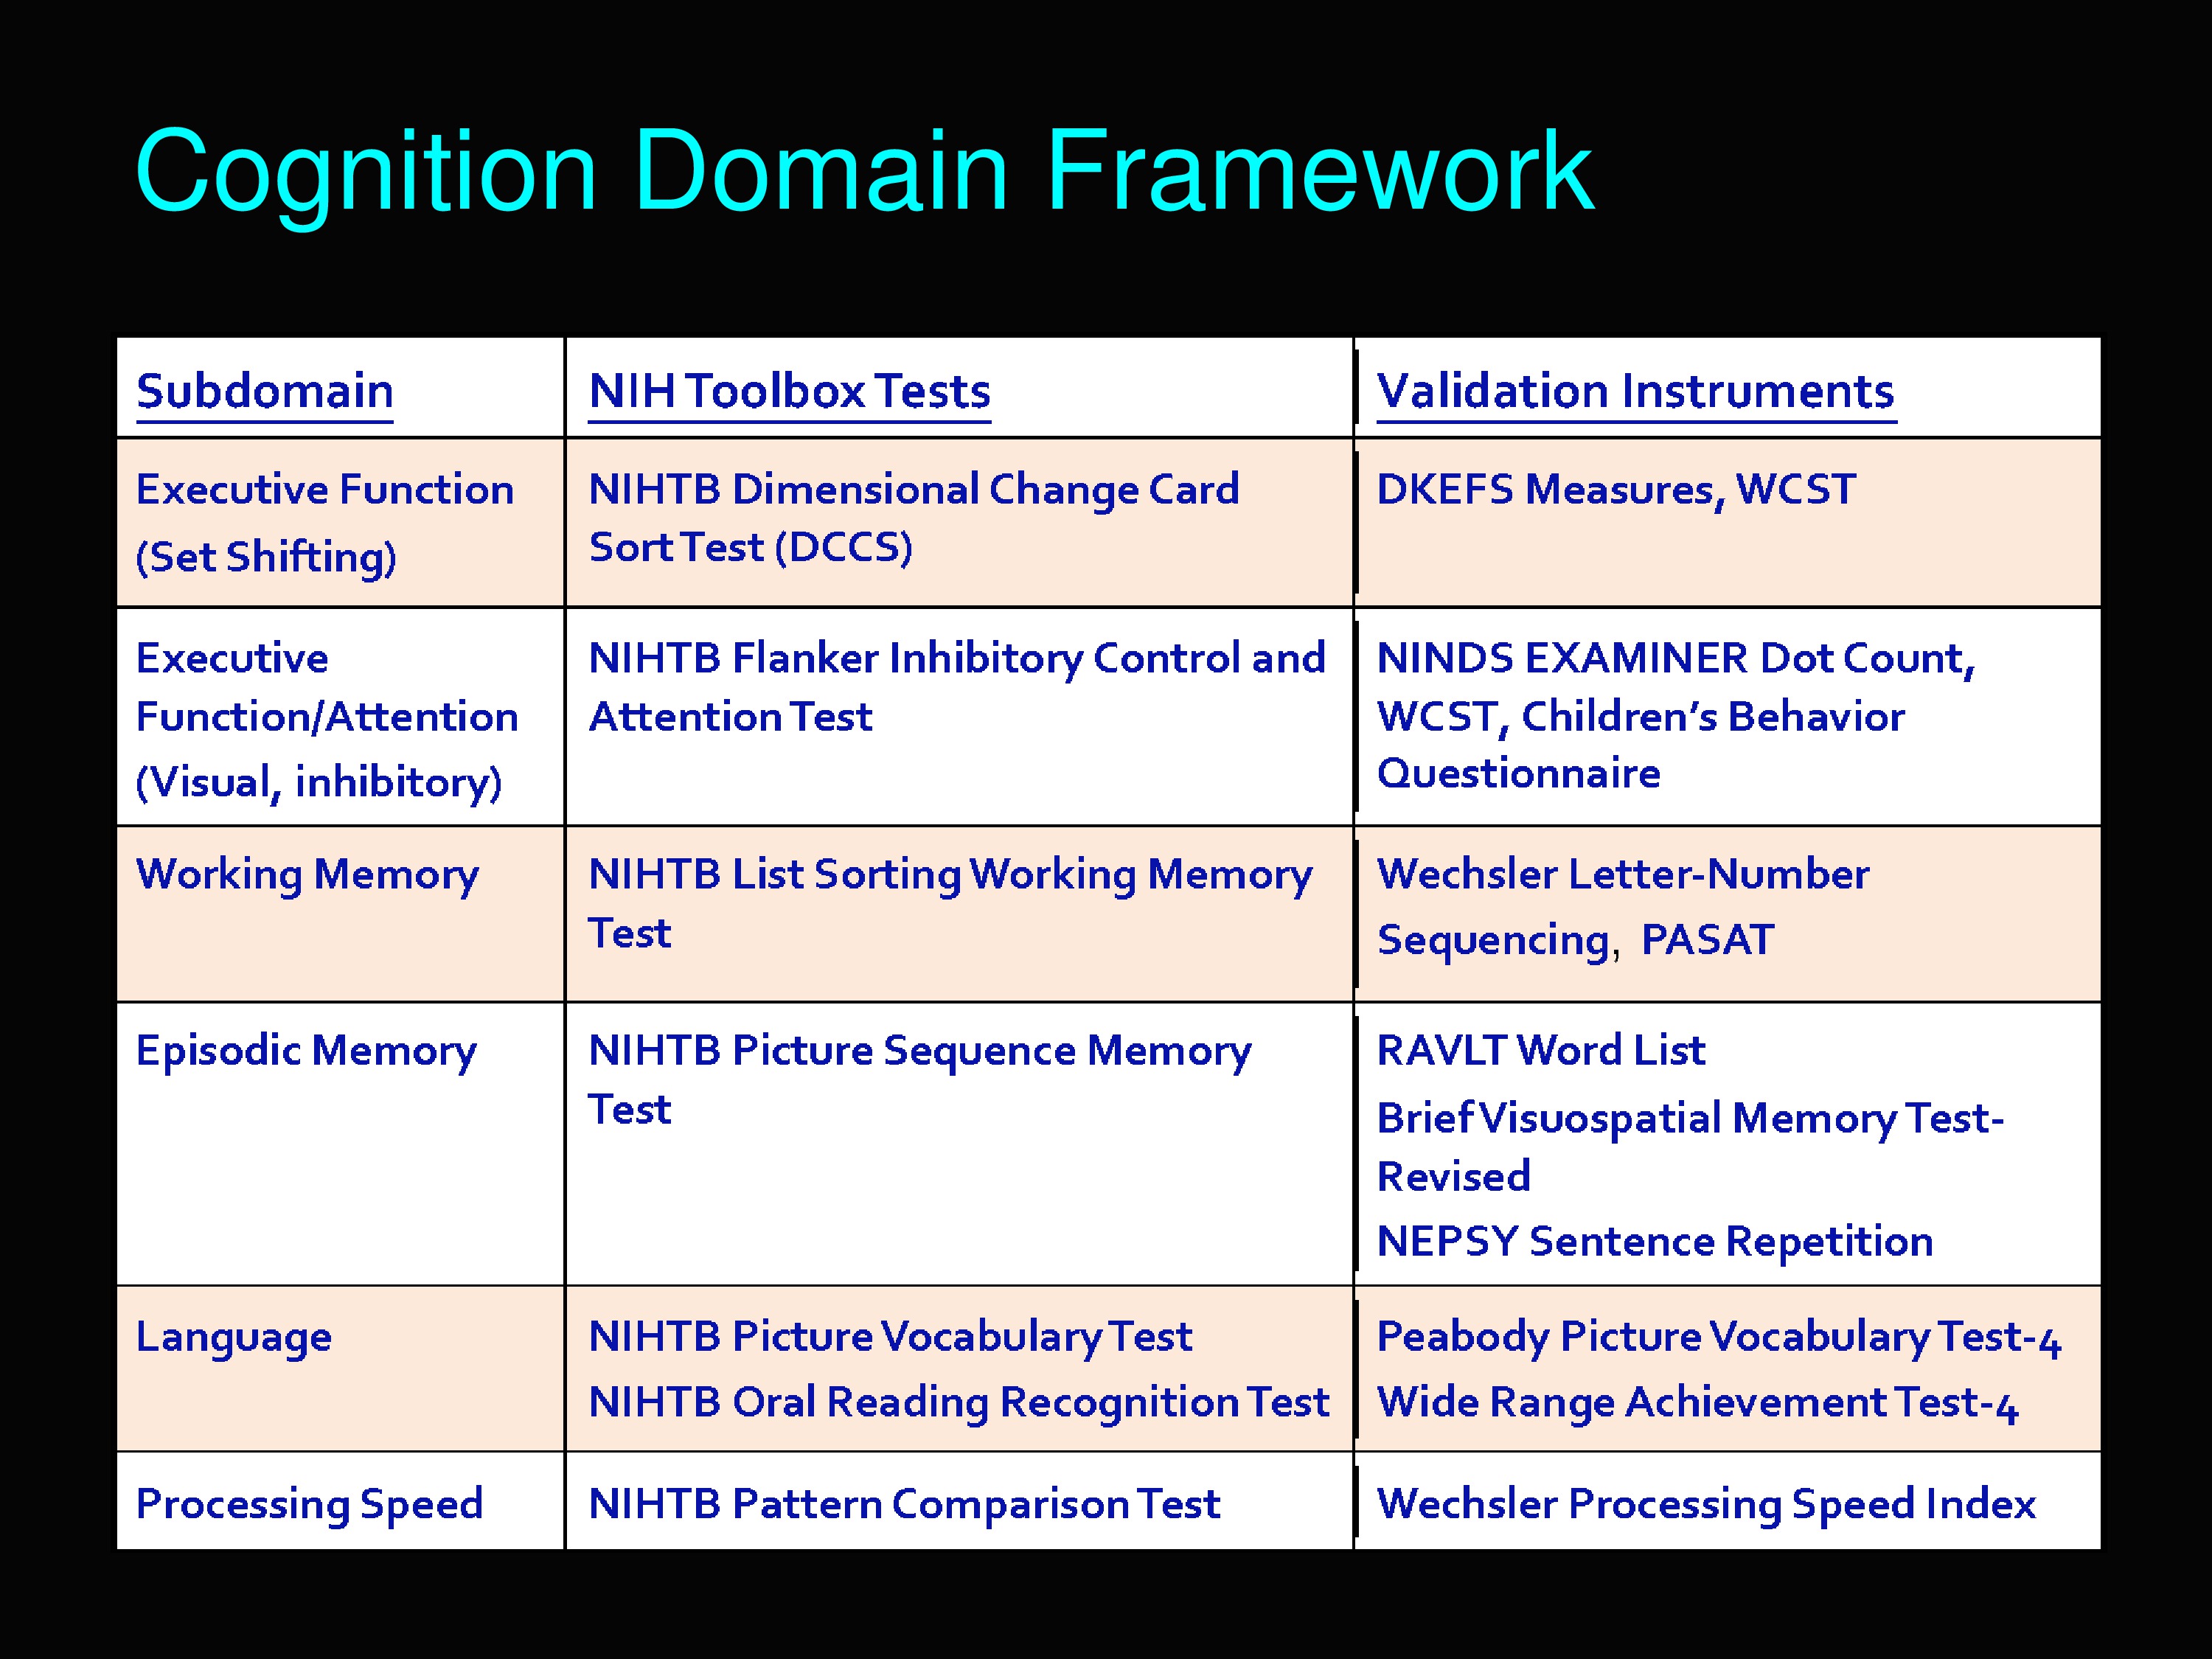
This is the cognition domain framework. I want to show you all the sub-domains that are included under cognition in the Toolbox. Executive function, executive function/attention, working memory, episodic memory, language, and processing speed.
This chart also shows what the tests were to measure each of those sub-domains and also how they were validated.
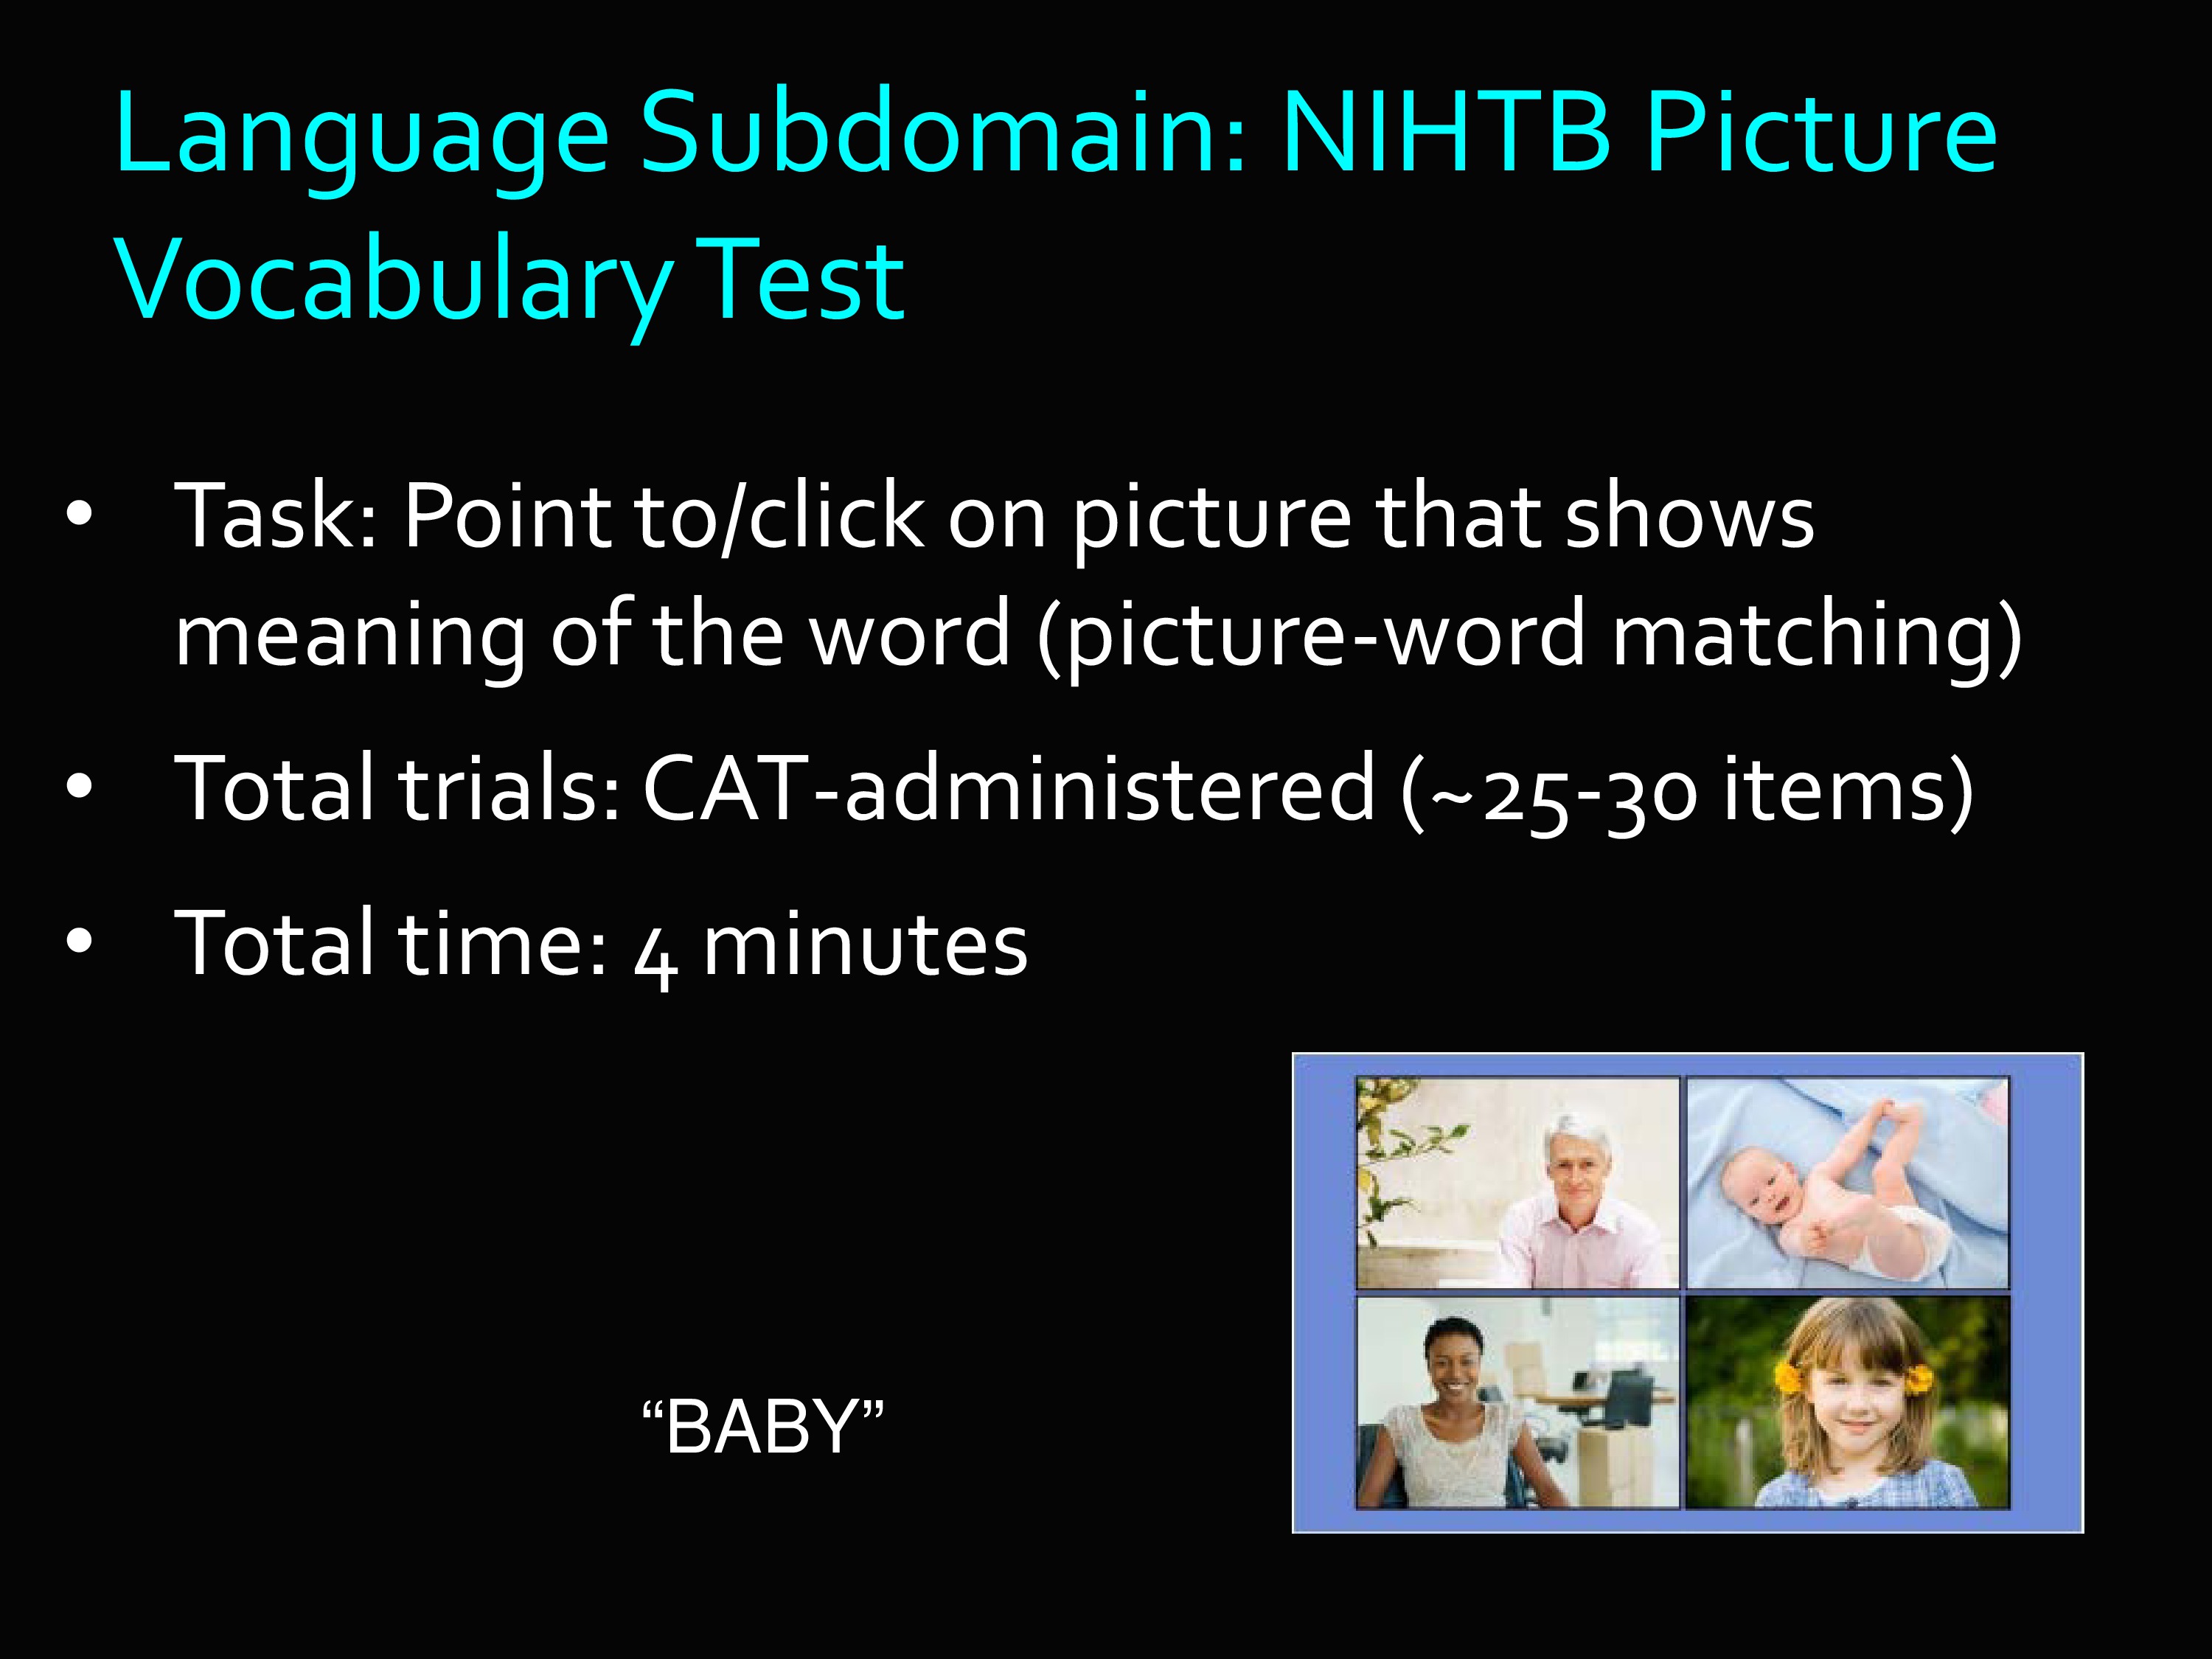
I’m going to pick one of those out, the Language Sub-domain, under the Cognition Domain.
The Language Sub-domain we ended up with the Picture Vocabulary Test. Basically the task is this: A set of pictures are shown, and the examinee is told to click the picture that shows the meaning of the word.
The trials are CAT-administered, 25 to 30 items. You’d be surprised at how quickly you can administer this many items when it’s just point and click.
This is an actual example item. You hear the word “baby” and you do your best to answer.
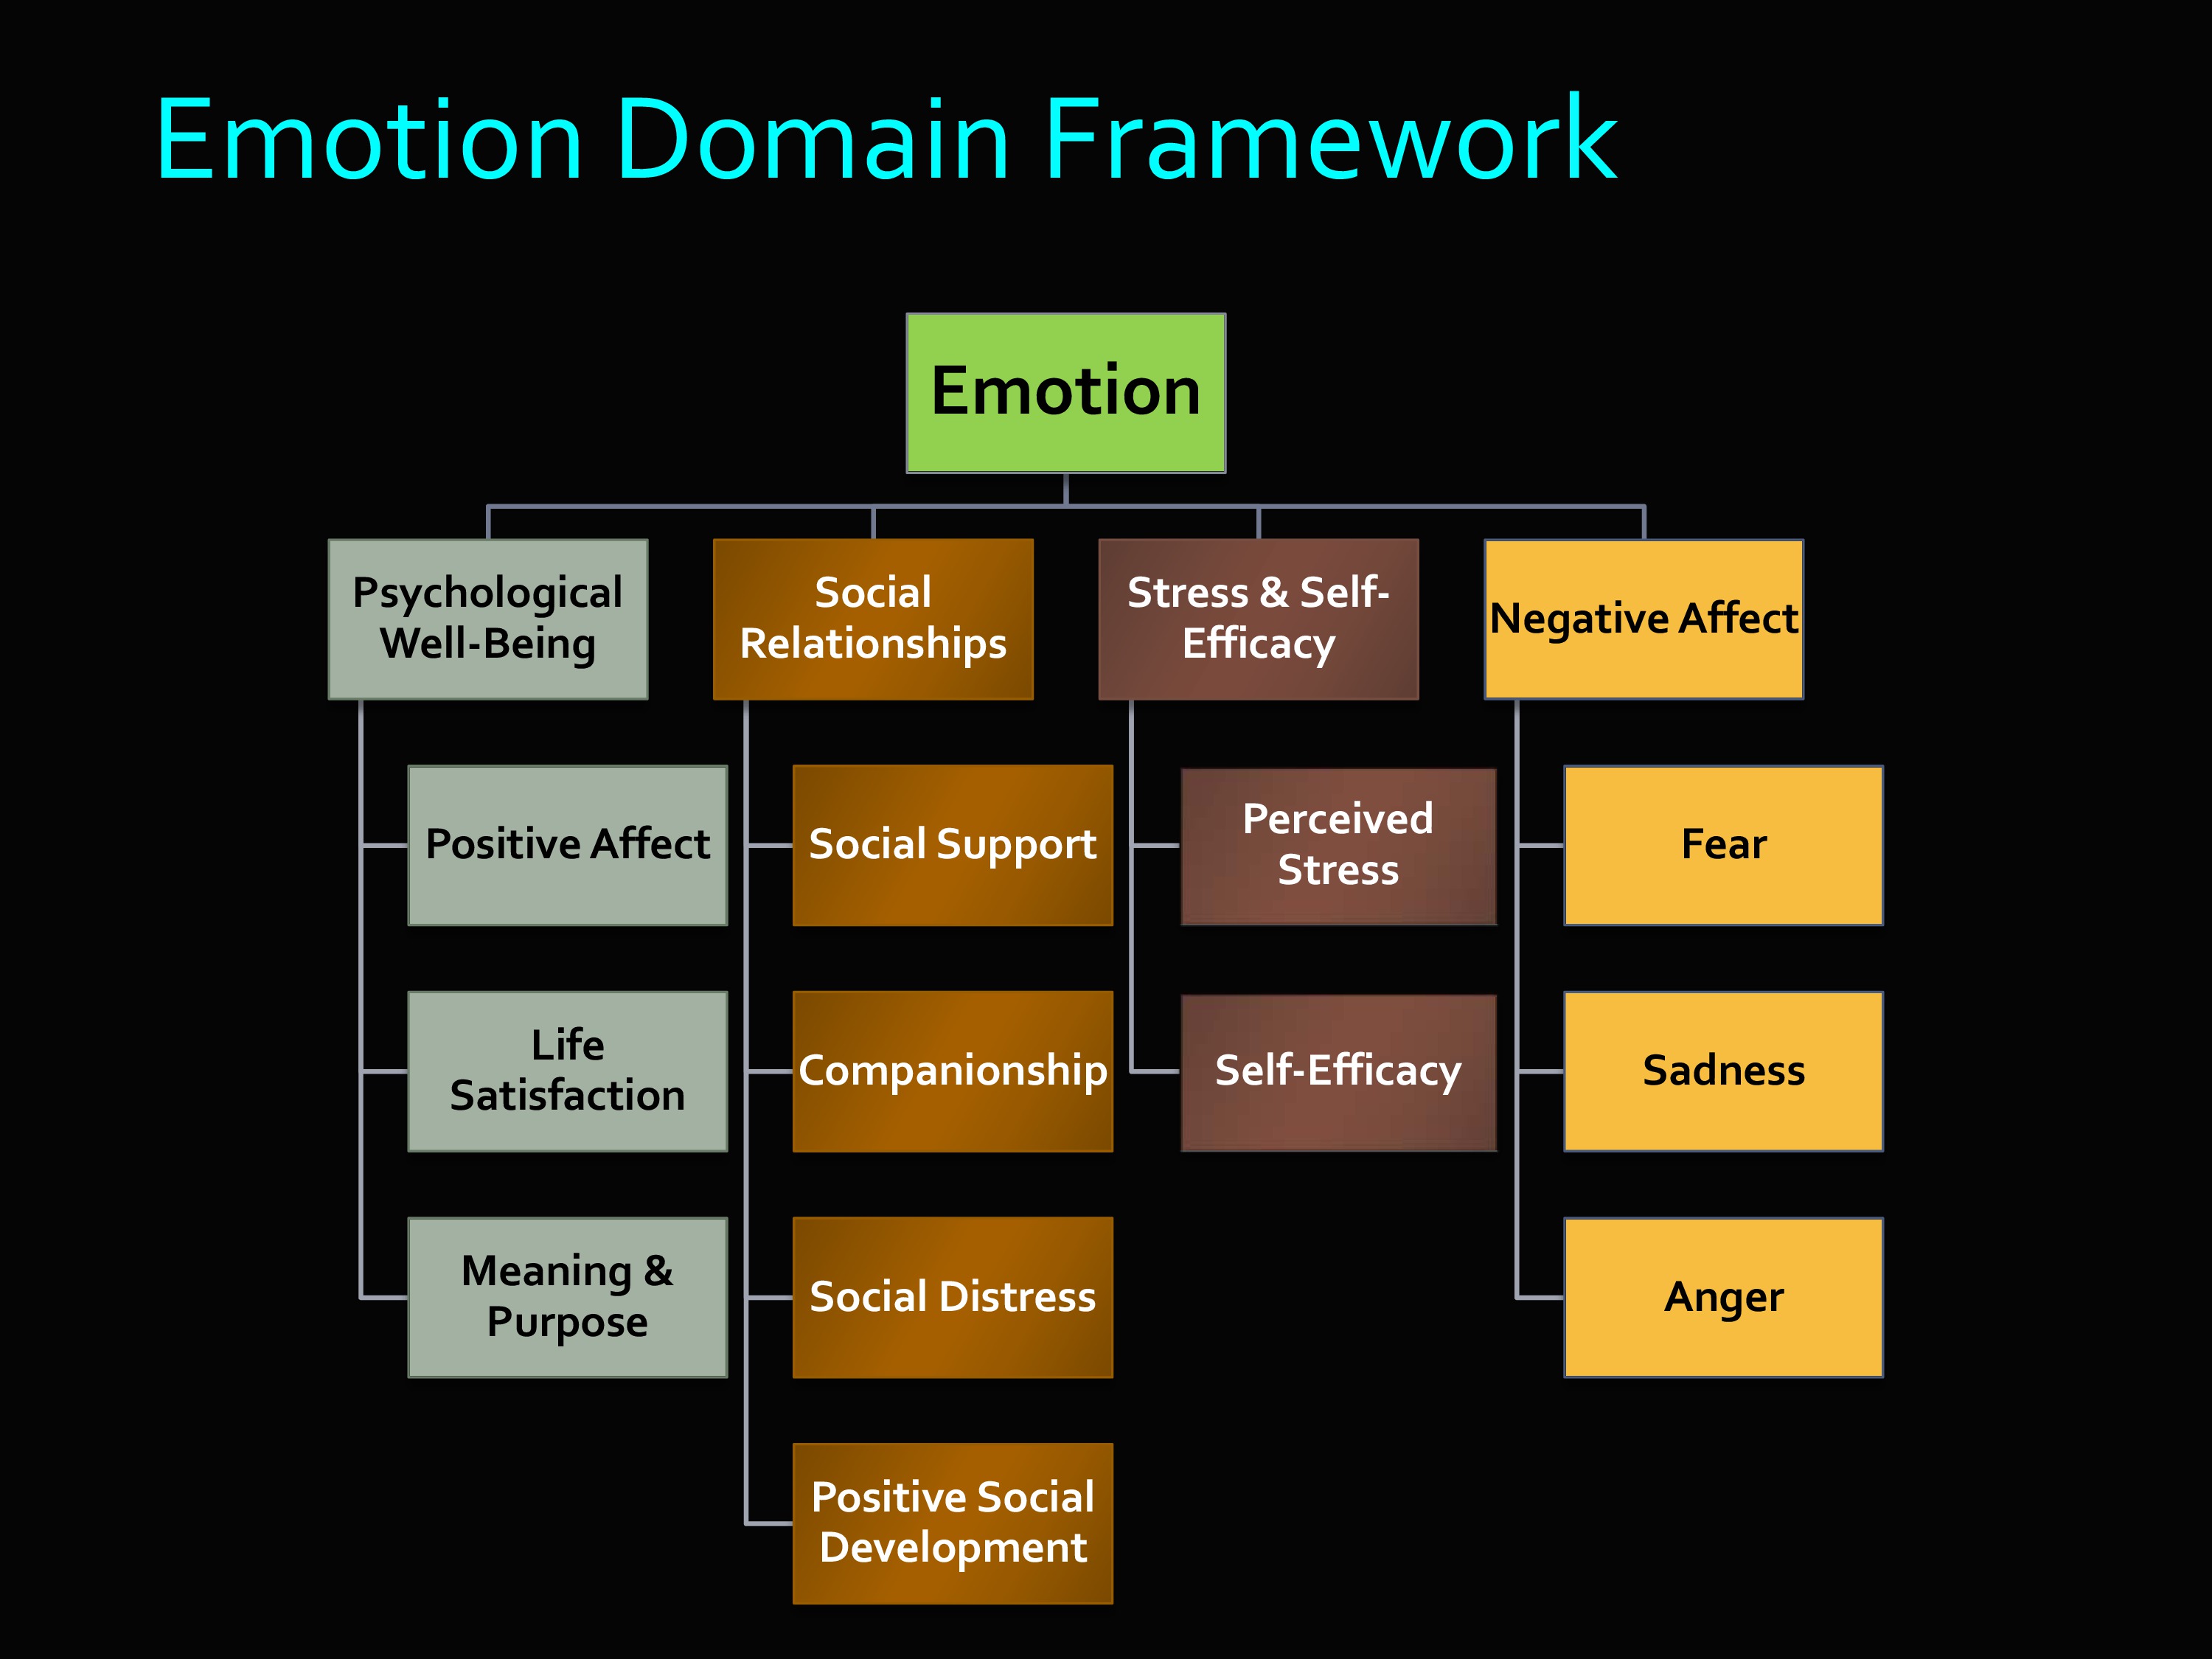
Here’s the Emotion Domain. You can see that underneath emotion, you’ve got all these different things. Psychological well-being, social relationships, stress and self-efficacy, negative affect.
Here you’ll see some overlap with PROMIS domains. In fact, when PROMIS domains already existed, then those were appropriated to be used in the Toolbox, rather than starting all over.
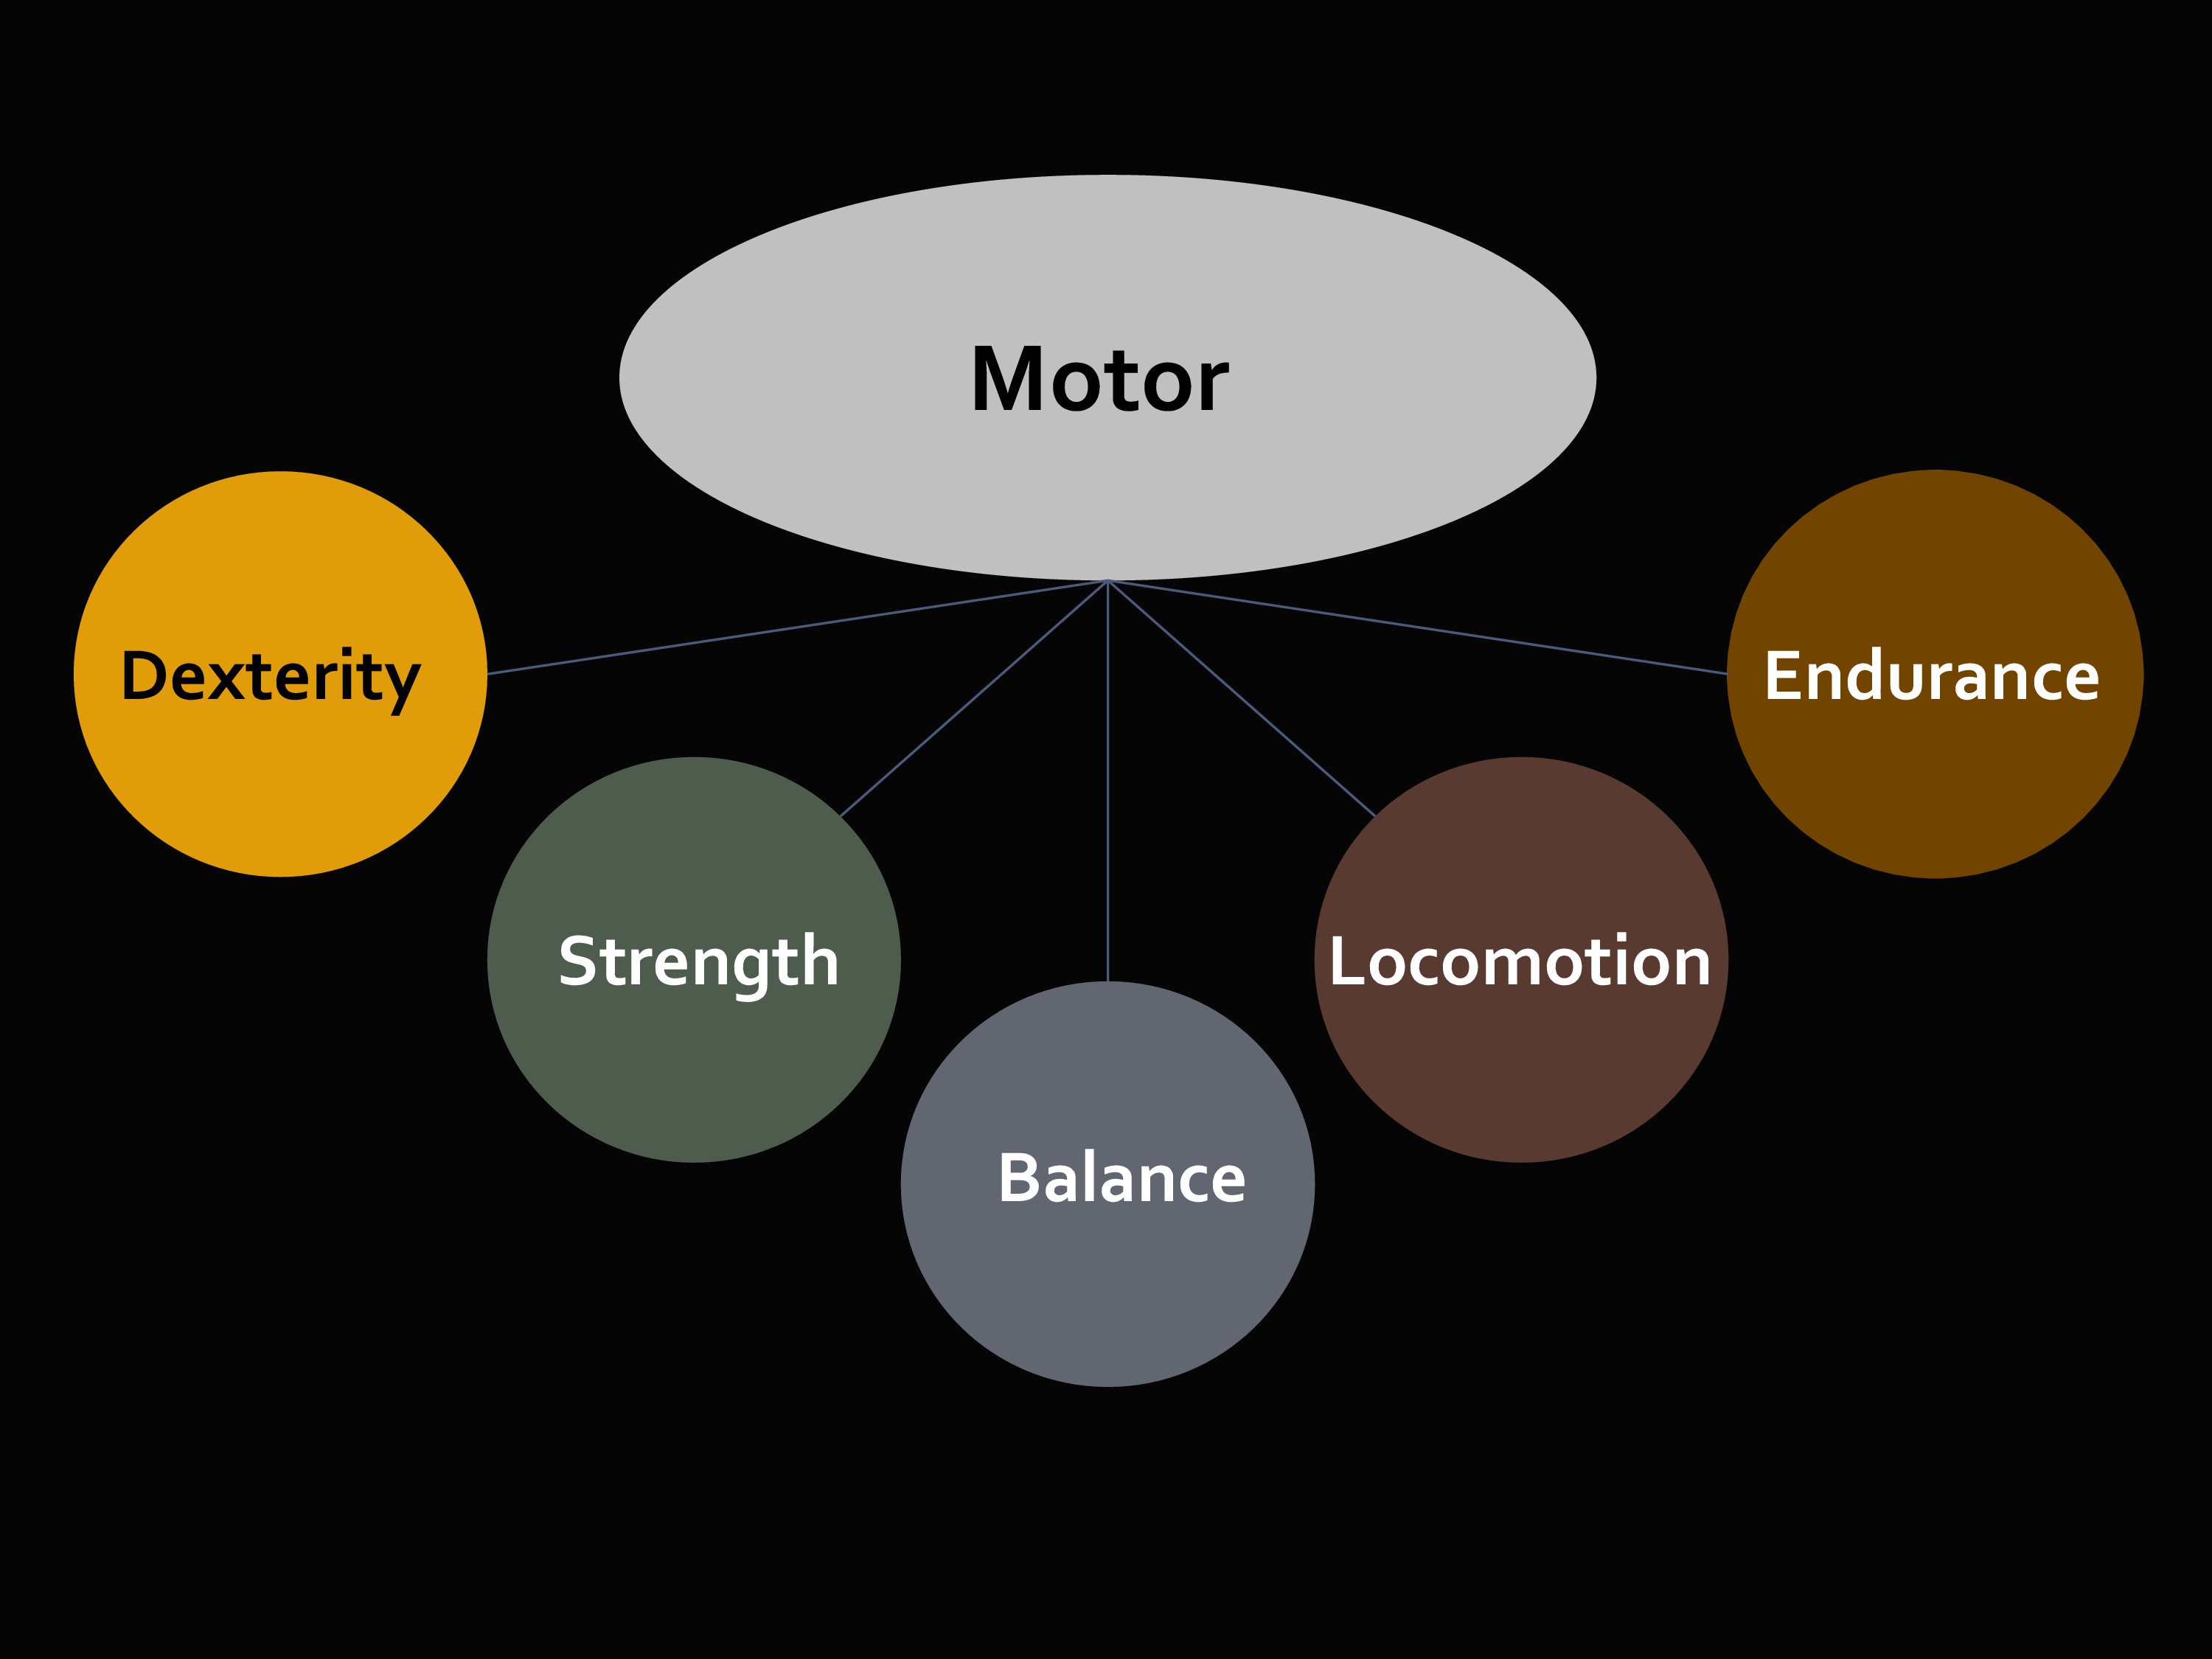
The third domain we look at is Motor.
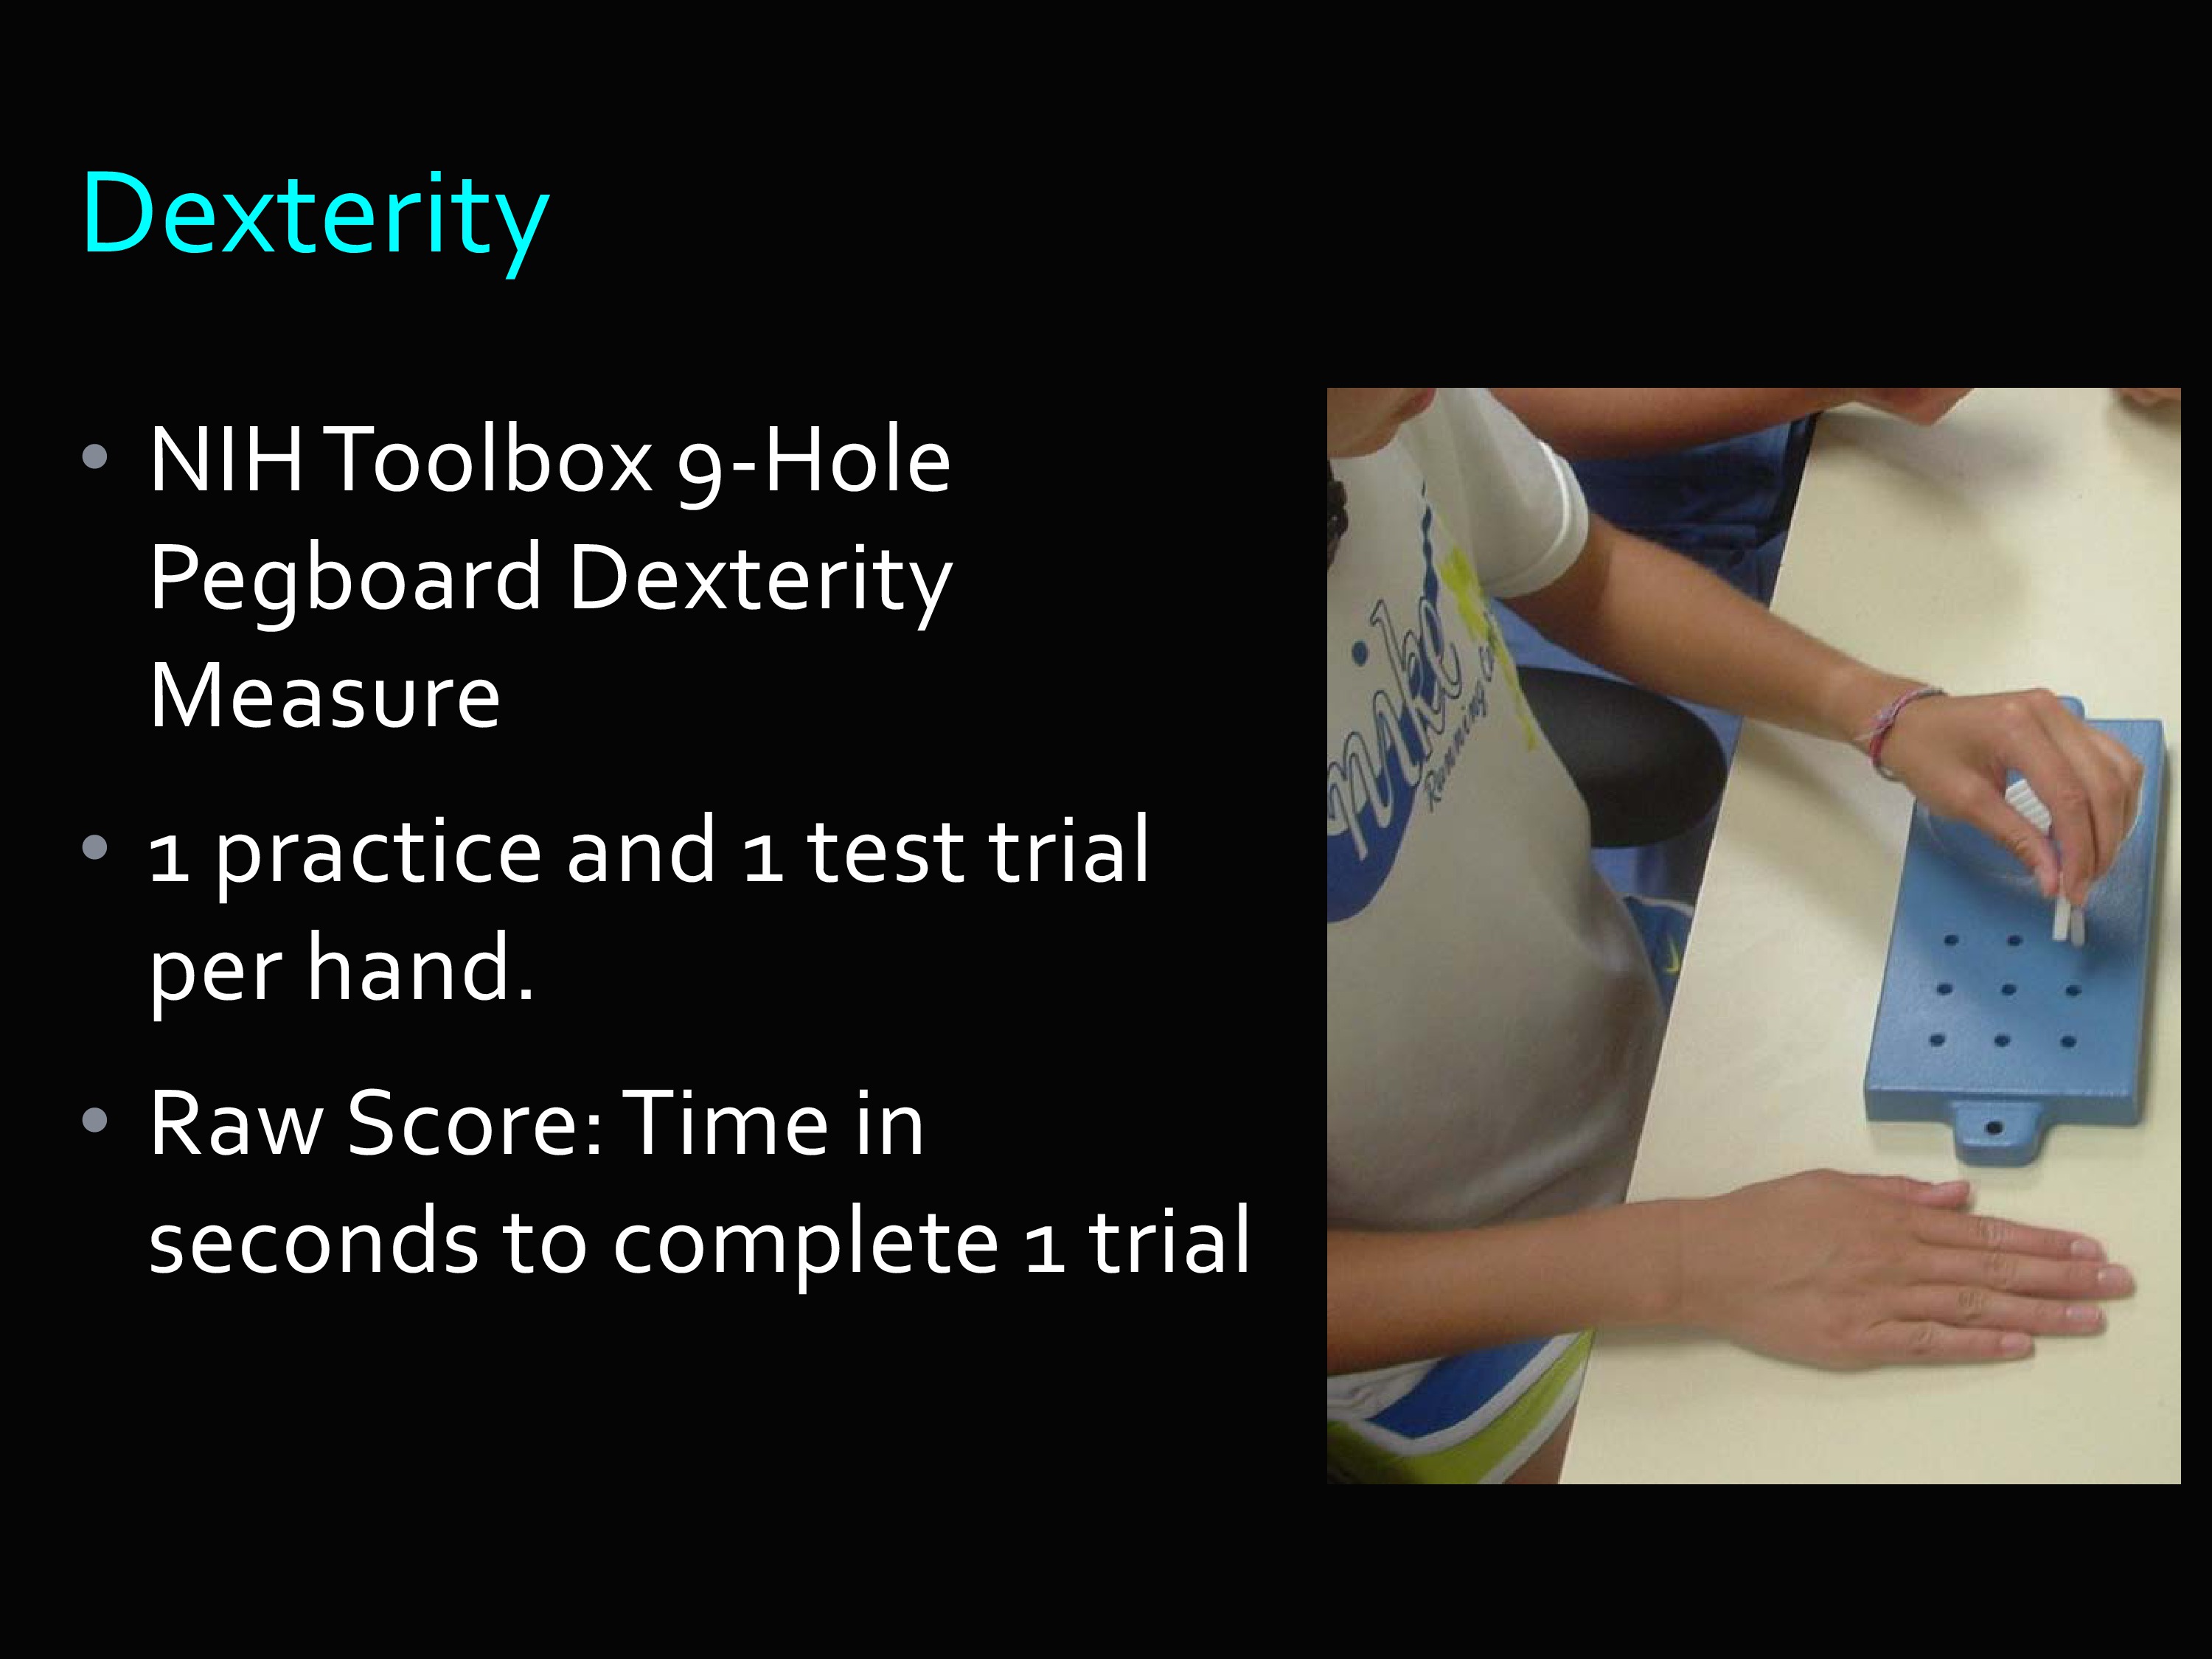
I’m going to show you a dexterity measure. You know about the nine-hole peg board dexterity measure. There’s one practice, one test trial, then you get the raw score, which is time in seconds to complete a trial.
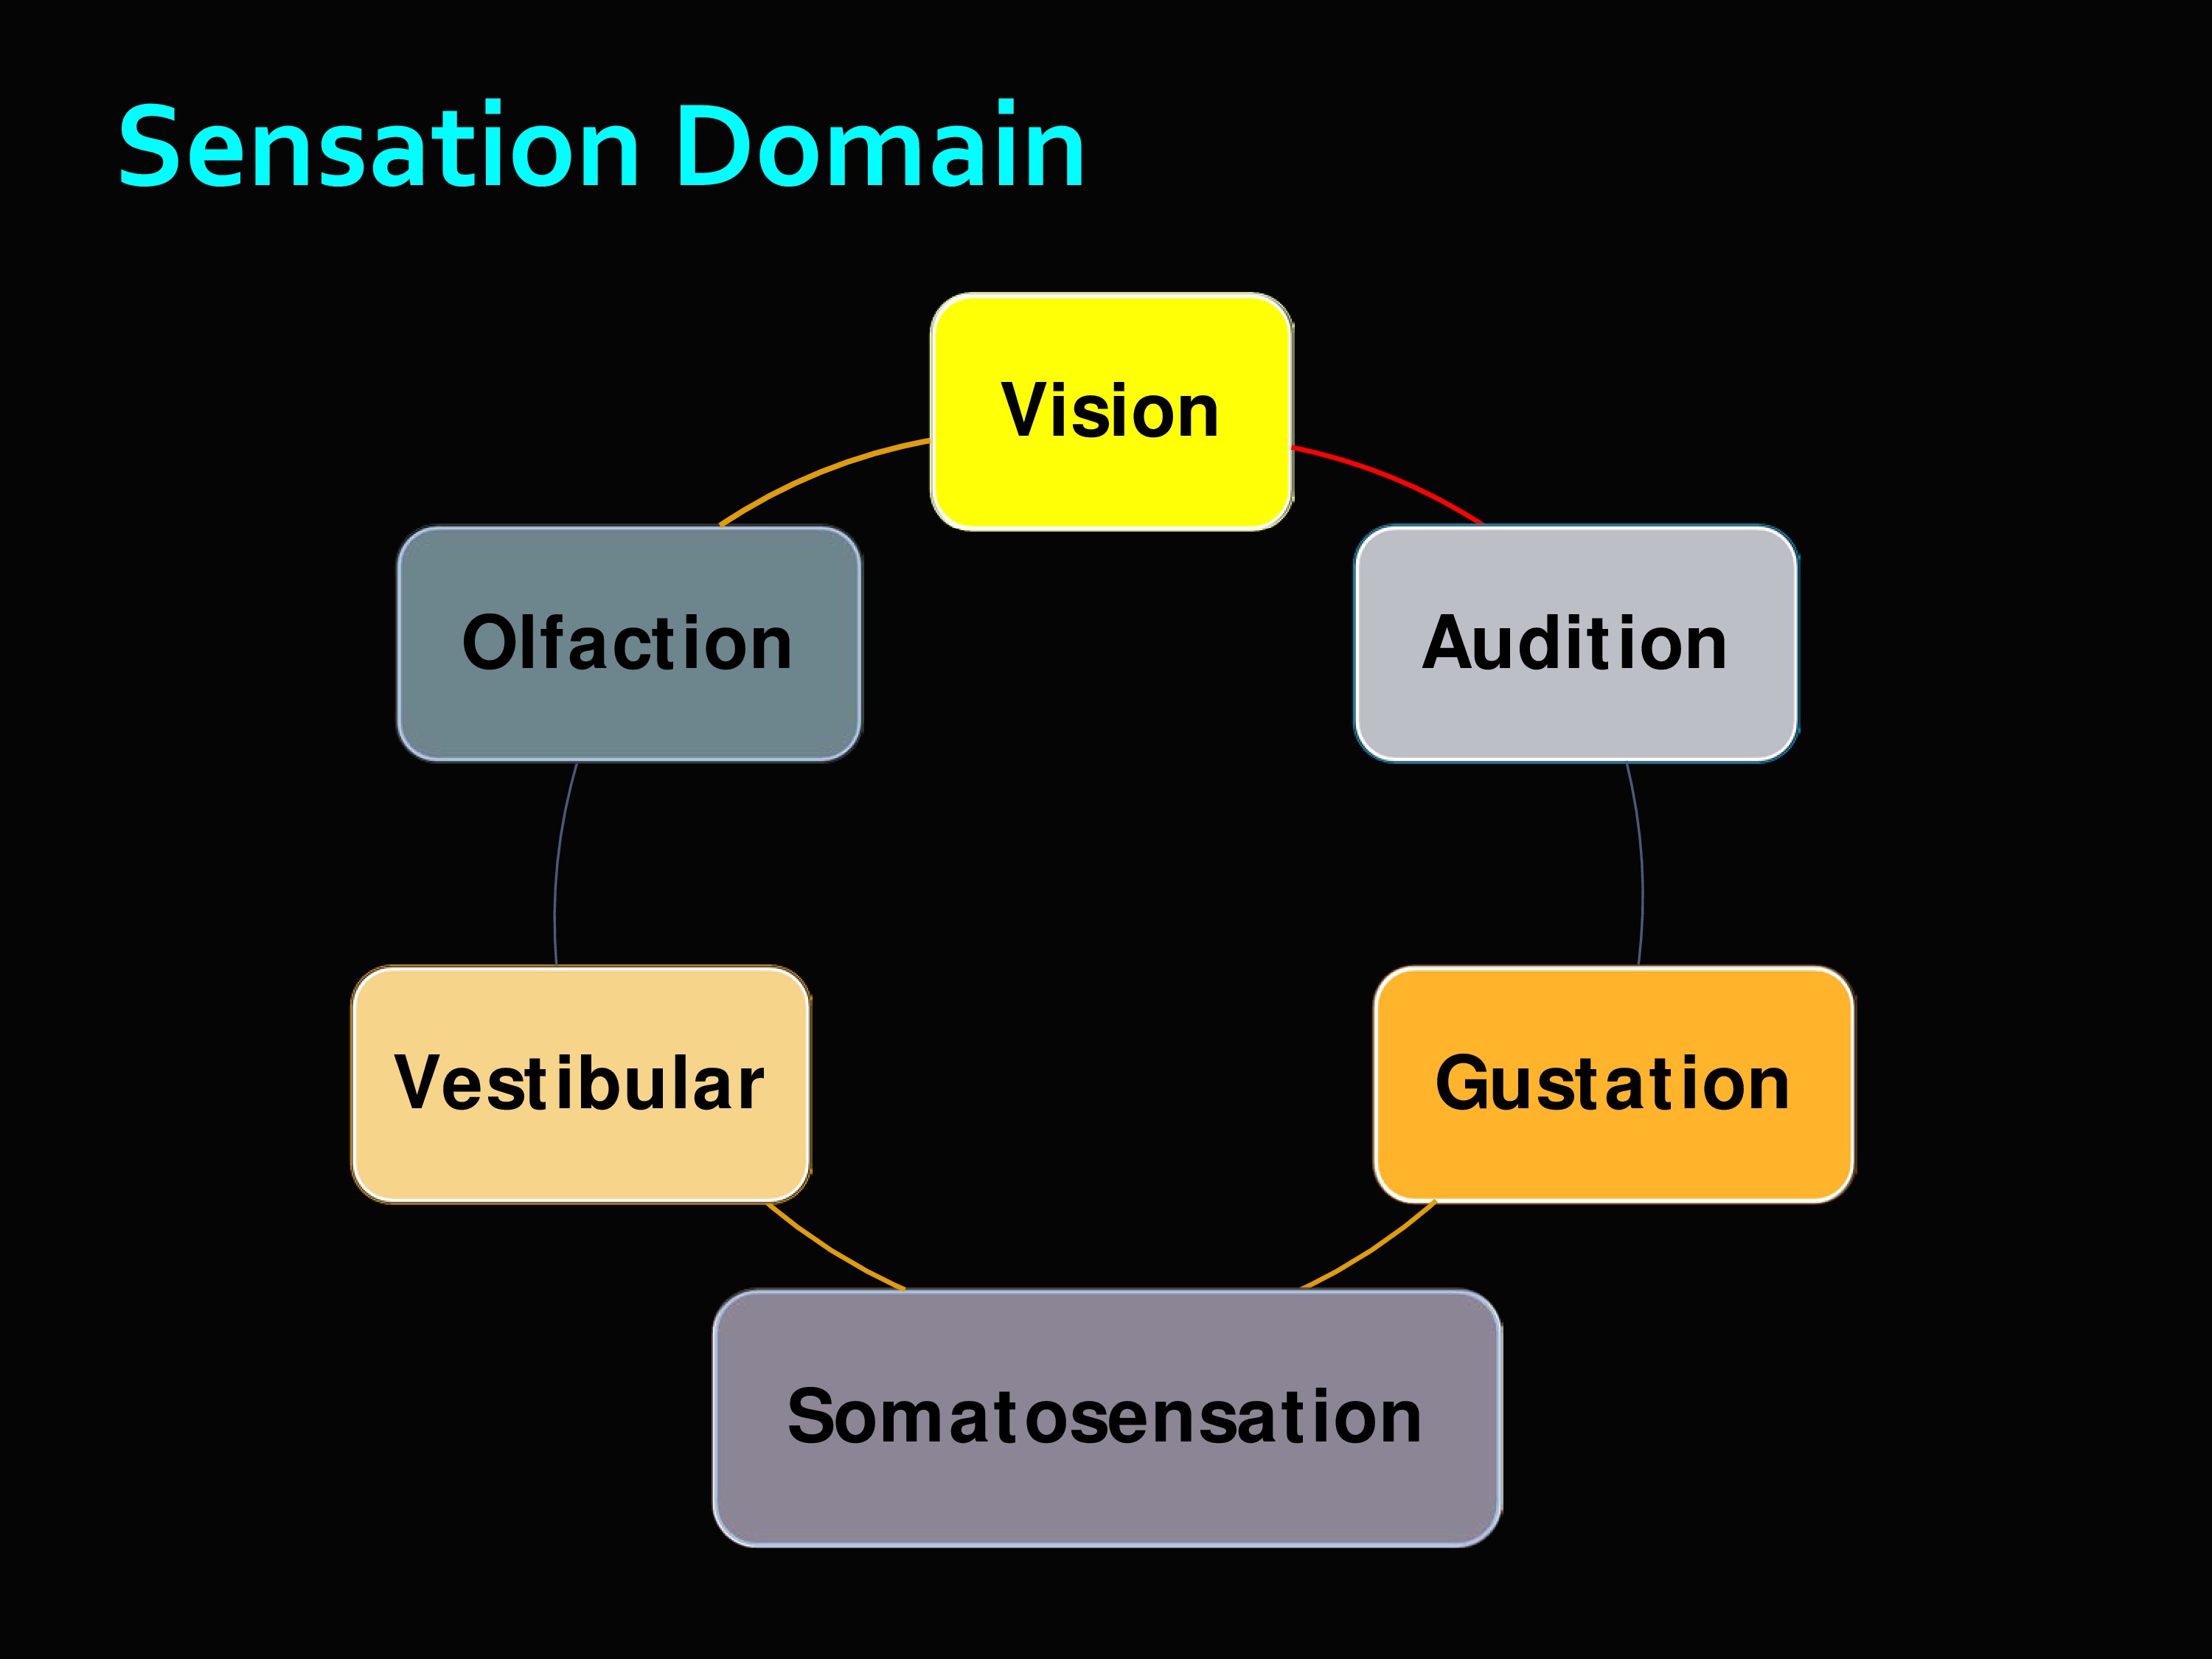
Then the sensation domain, and you can see what all this includes. It’s really interesting. There’s the olfaction which is like a scratch-and-sniff test — I think there are actually droppers — but you try to identify different smells. There’s vestibular, etc.
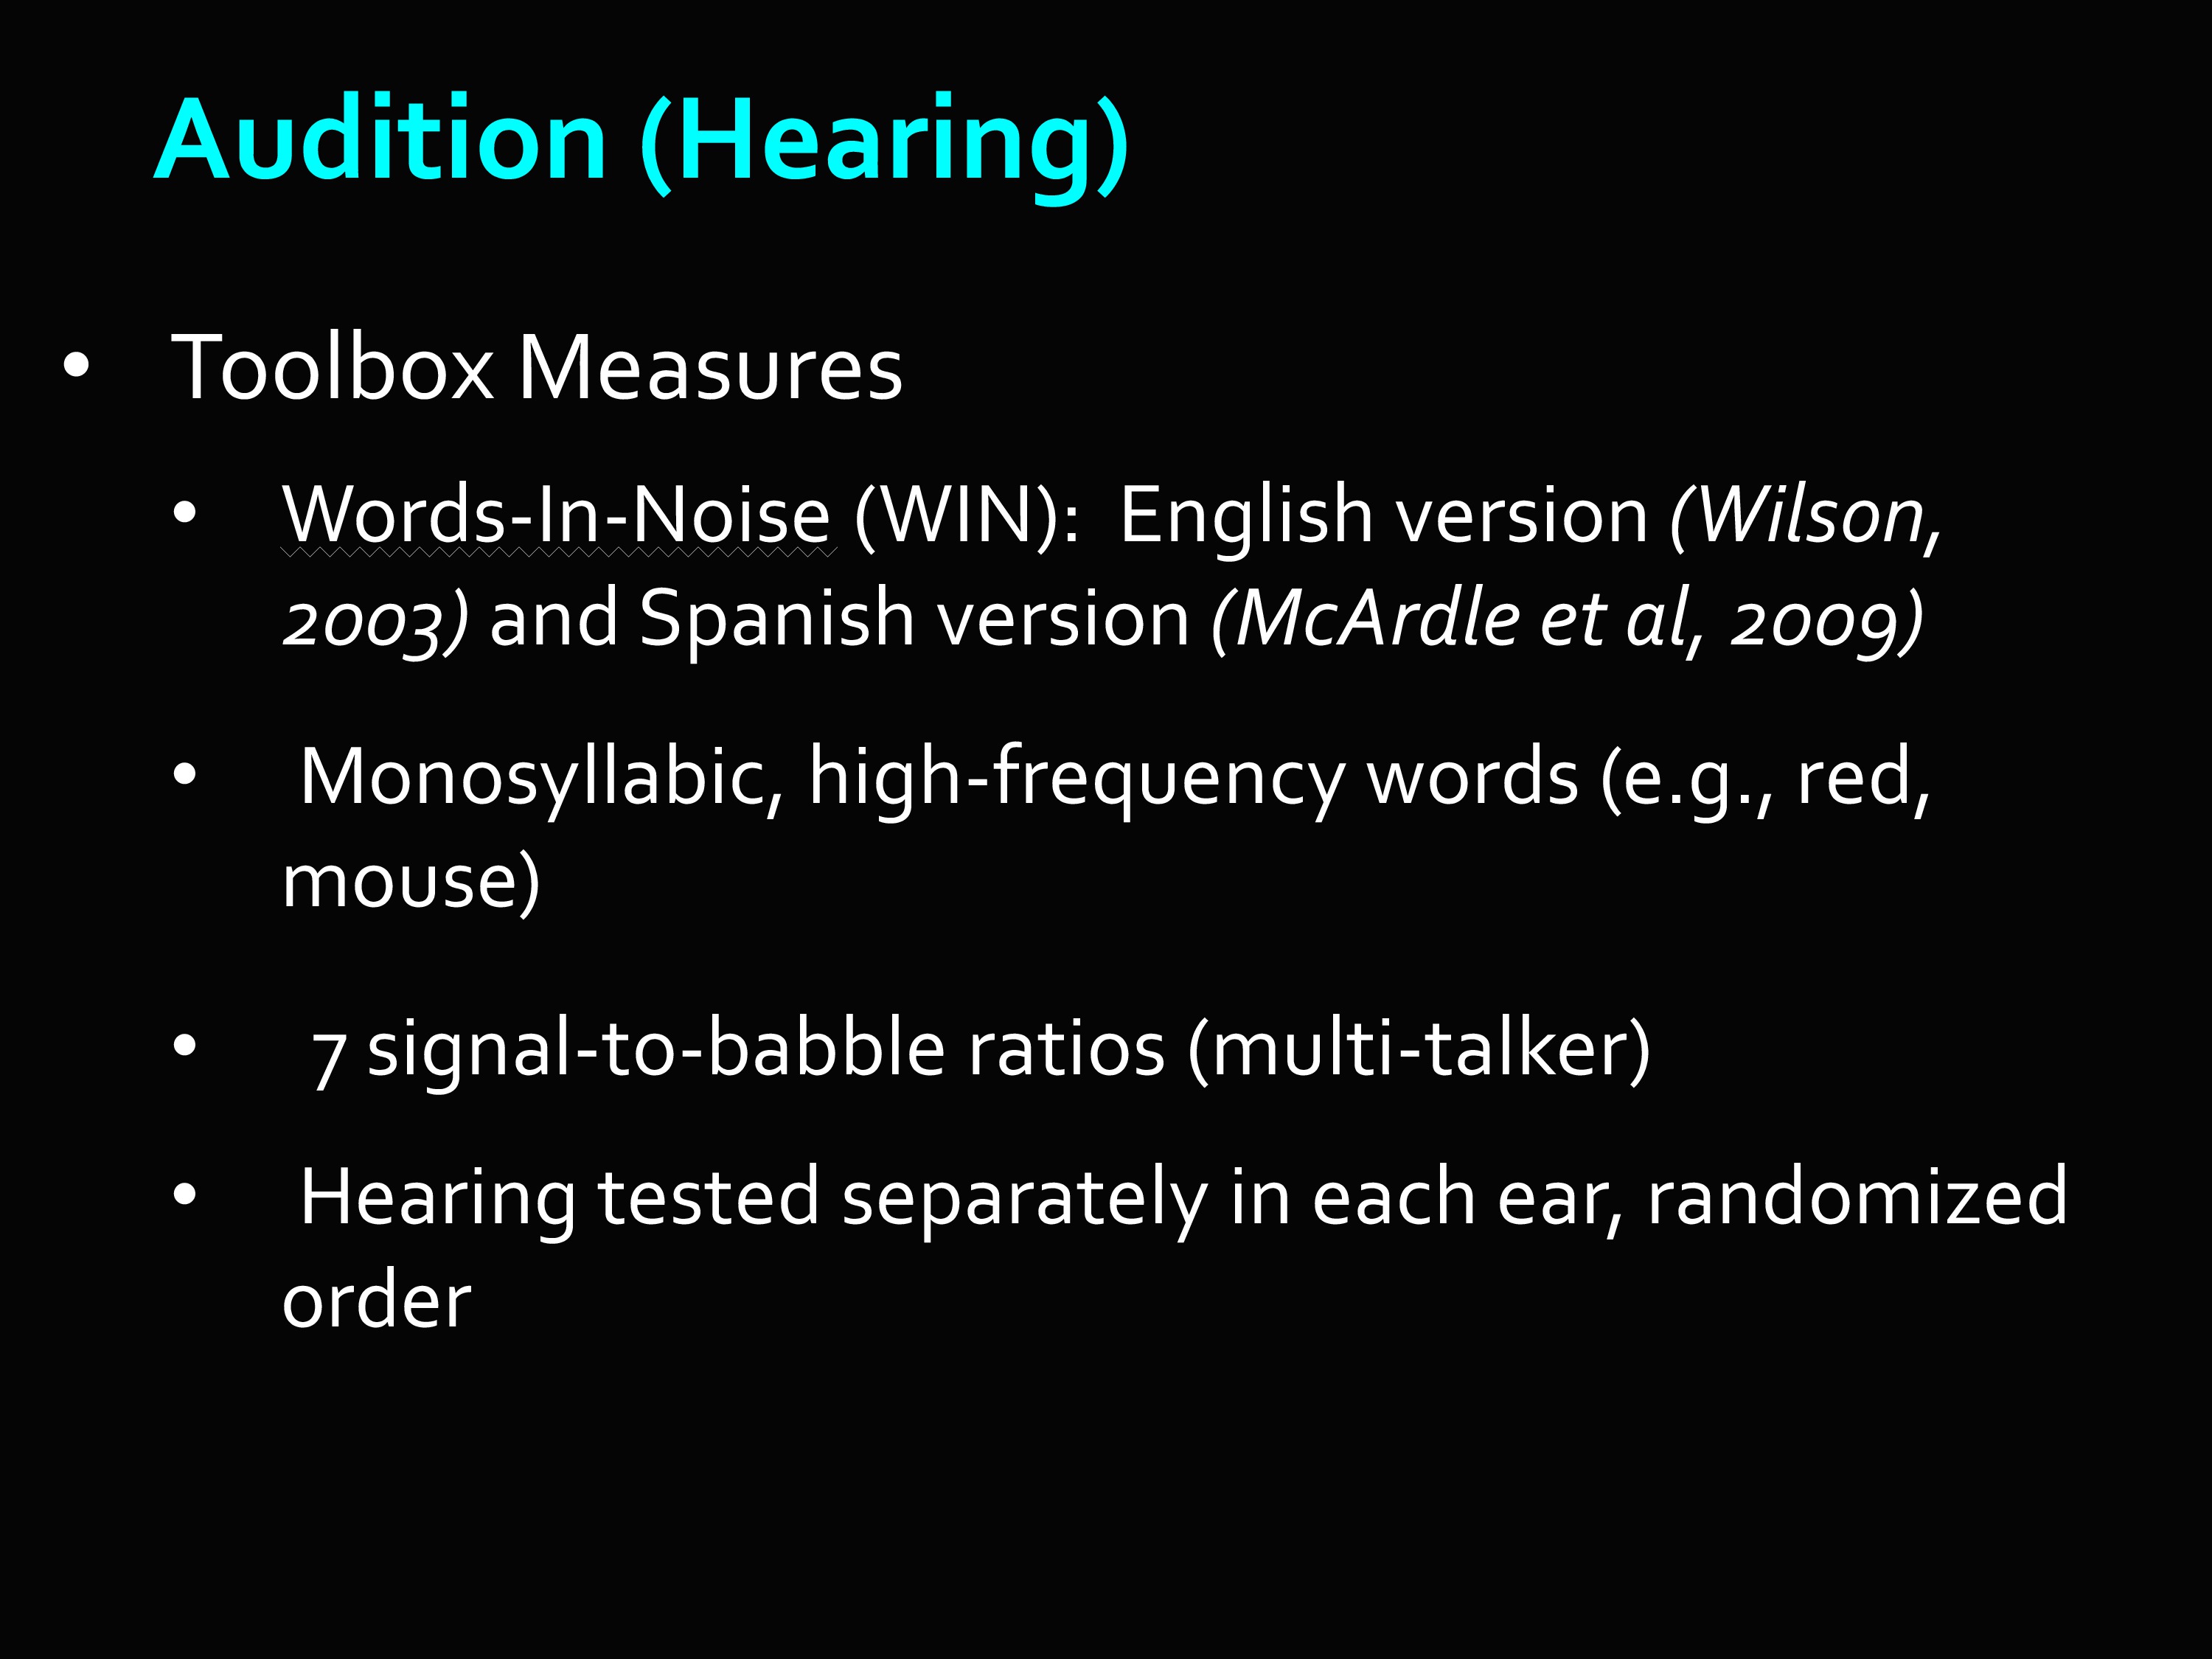
These are the Toolbox measures for the Audition sub-domain. Words-In-Noise, the English version and the Spanish version. Monosyllabic, high frequency words like “red” and “mouse.” Seven signal-to-babble ratios (multi-talker). And hearing tested separately in each ear, randomized order.
And this is just an example.
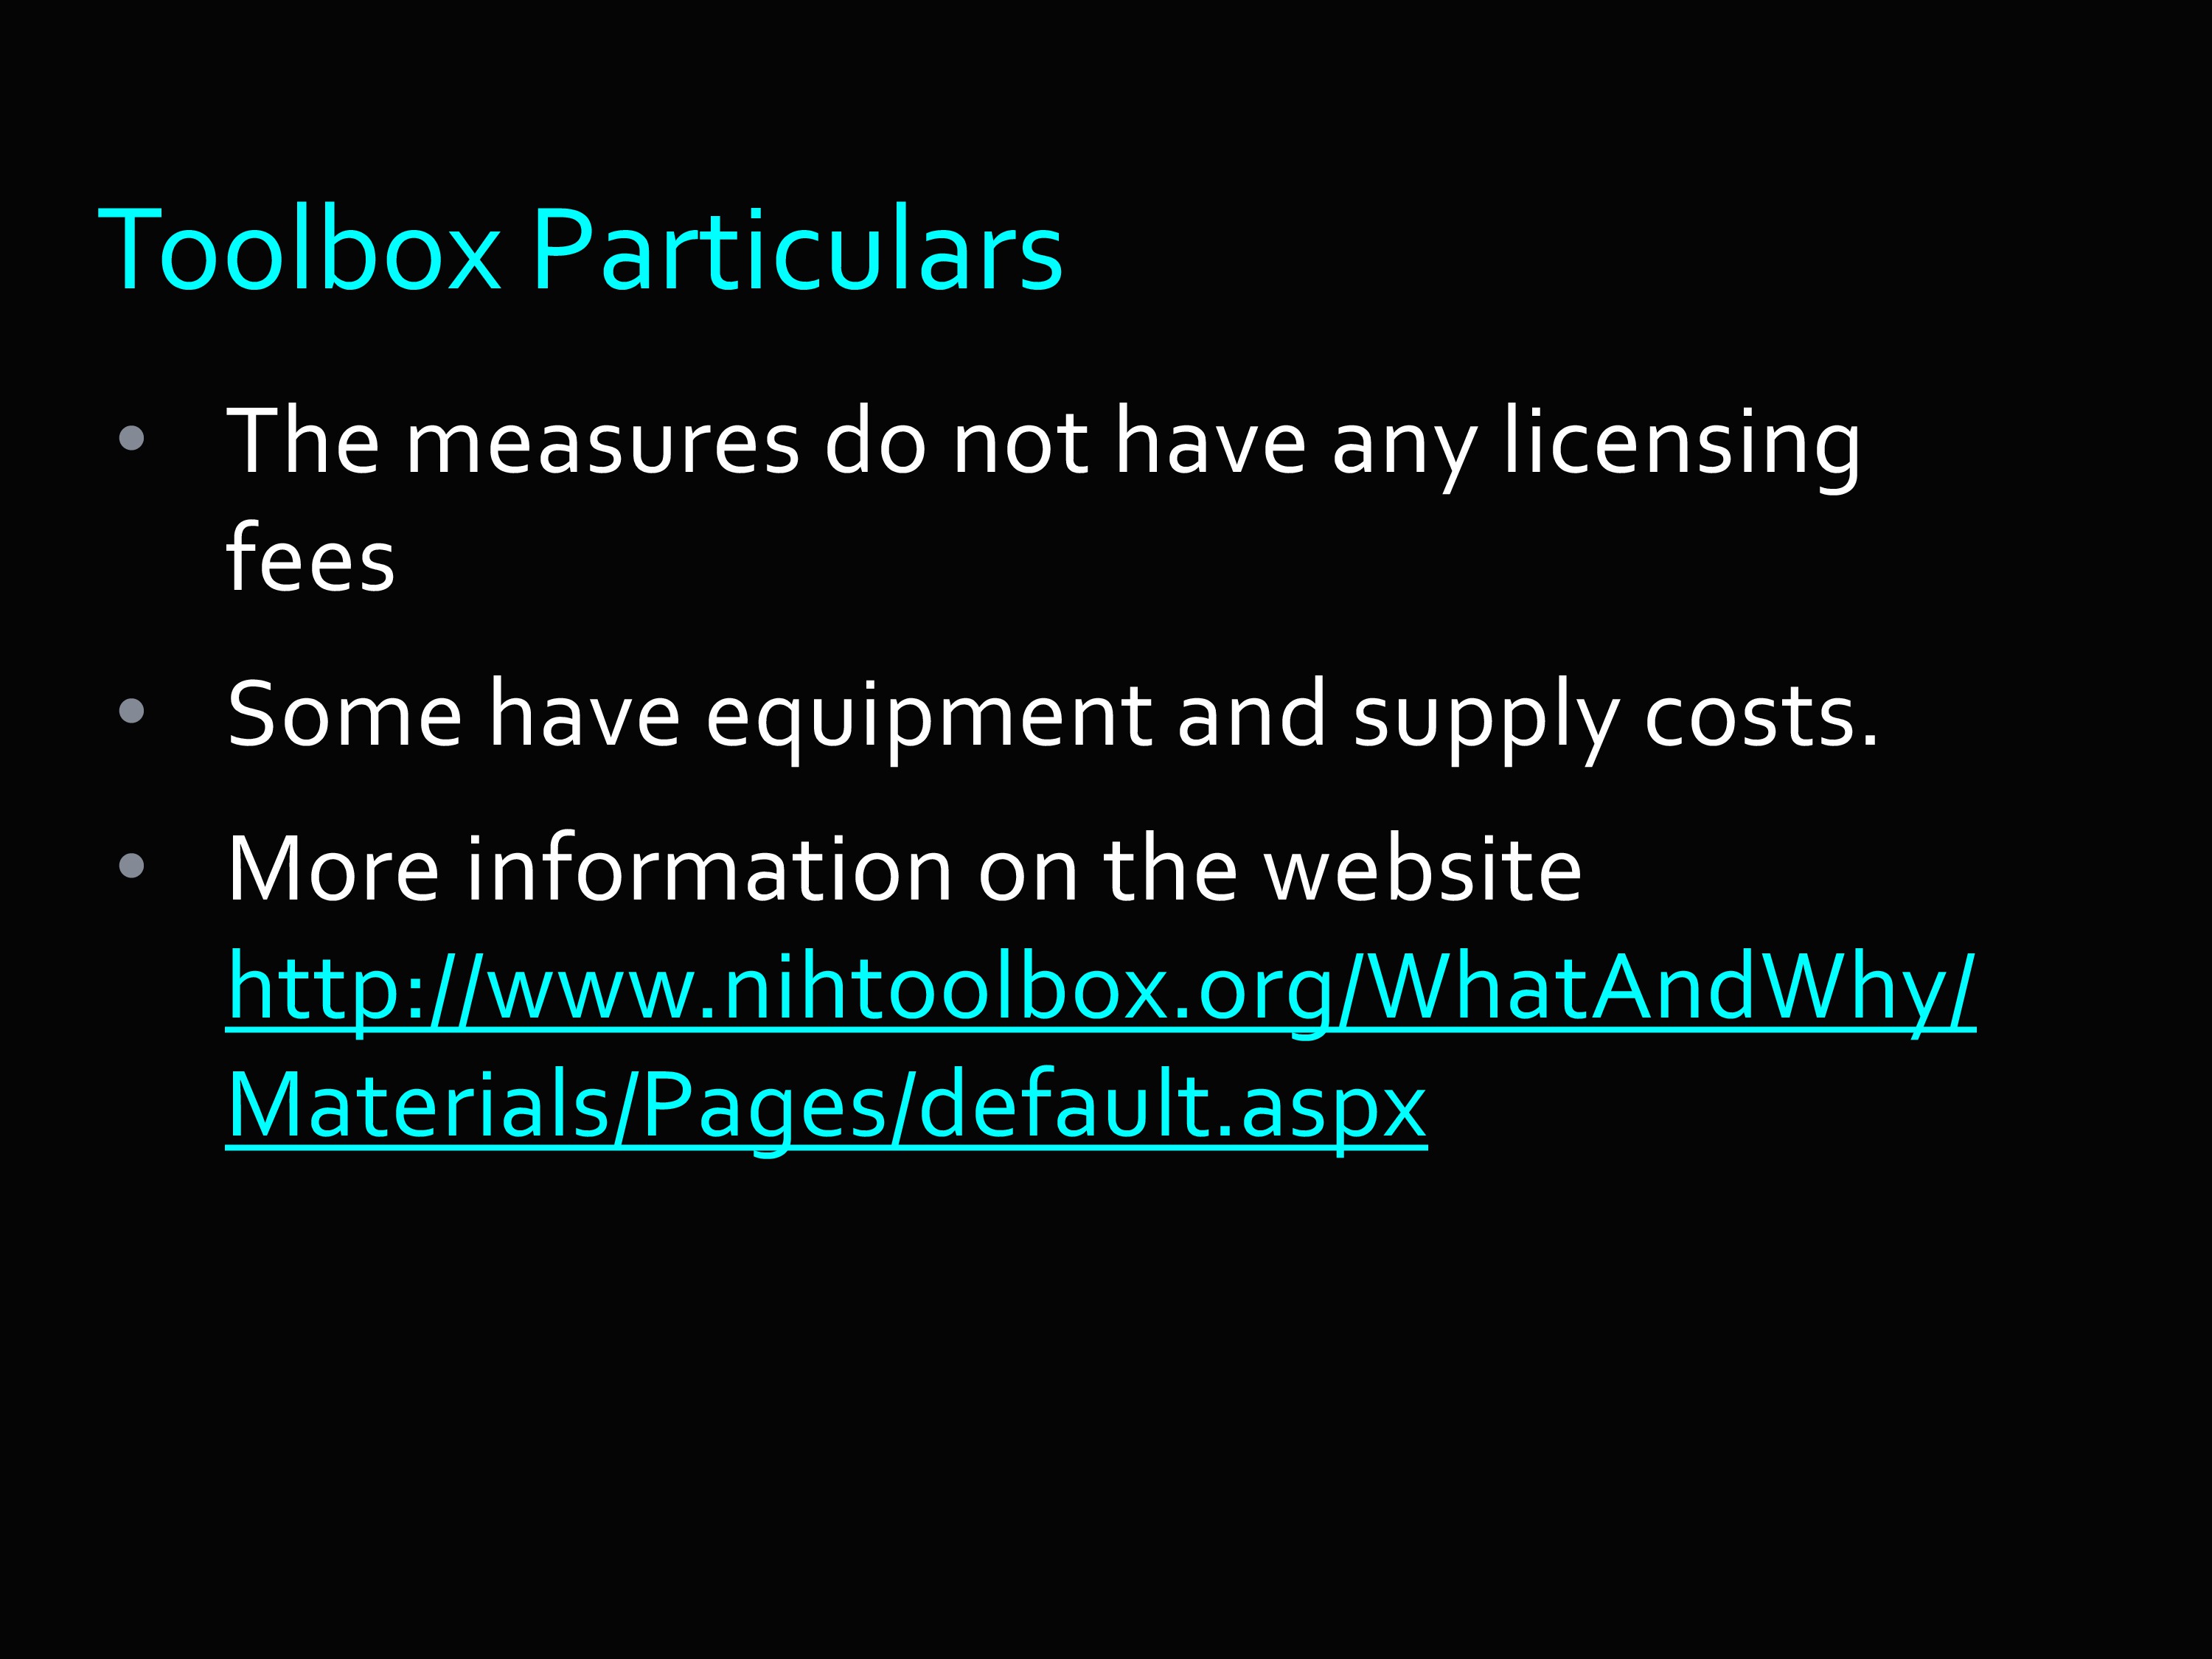
I will end with some Toolbox particulars. There are no licensing fees. There are some equipment costs for some of them — you can imagine, like for the smell test, you have to buy the odors. There’s more information on the website, if you would like to know more.
Final Thoughts
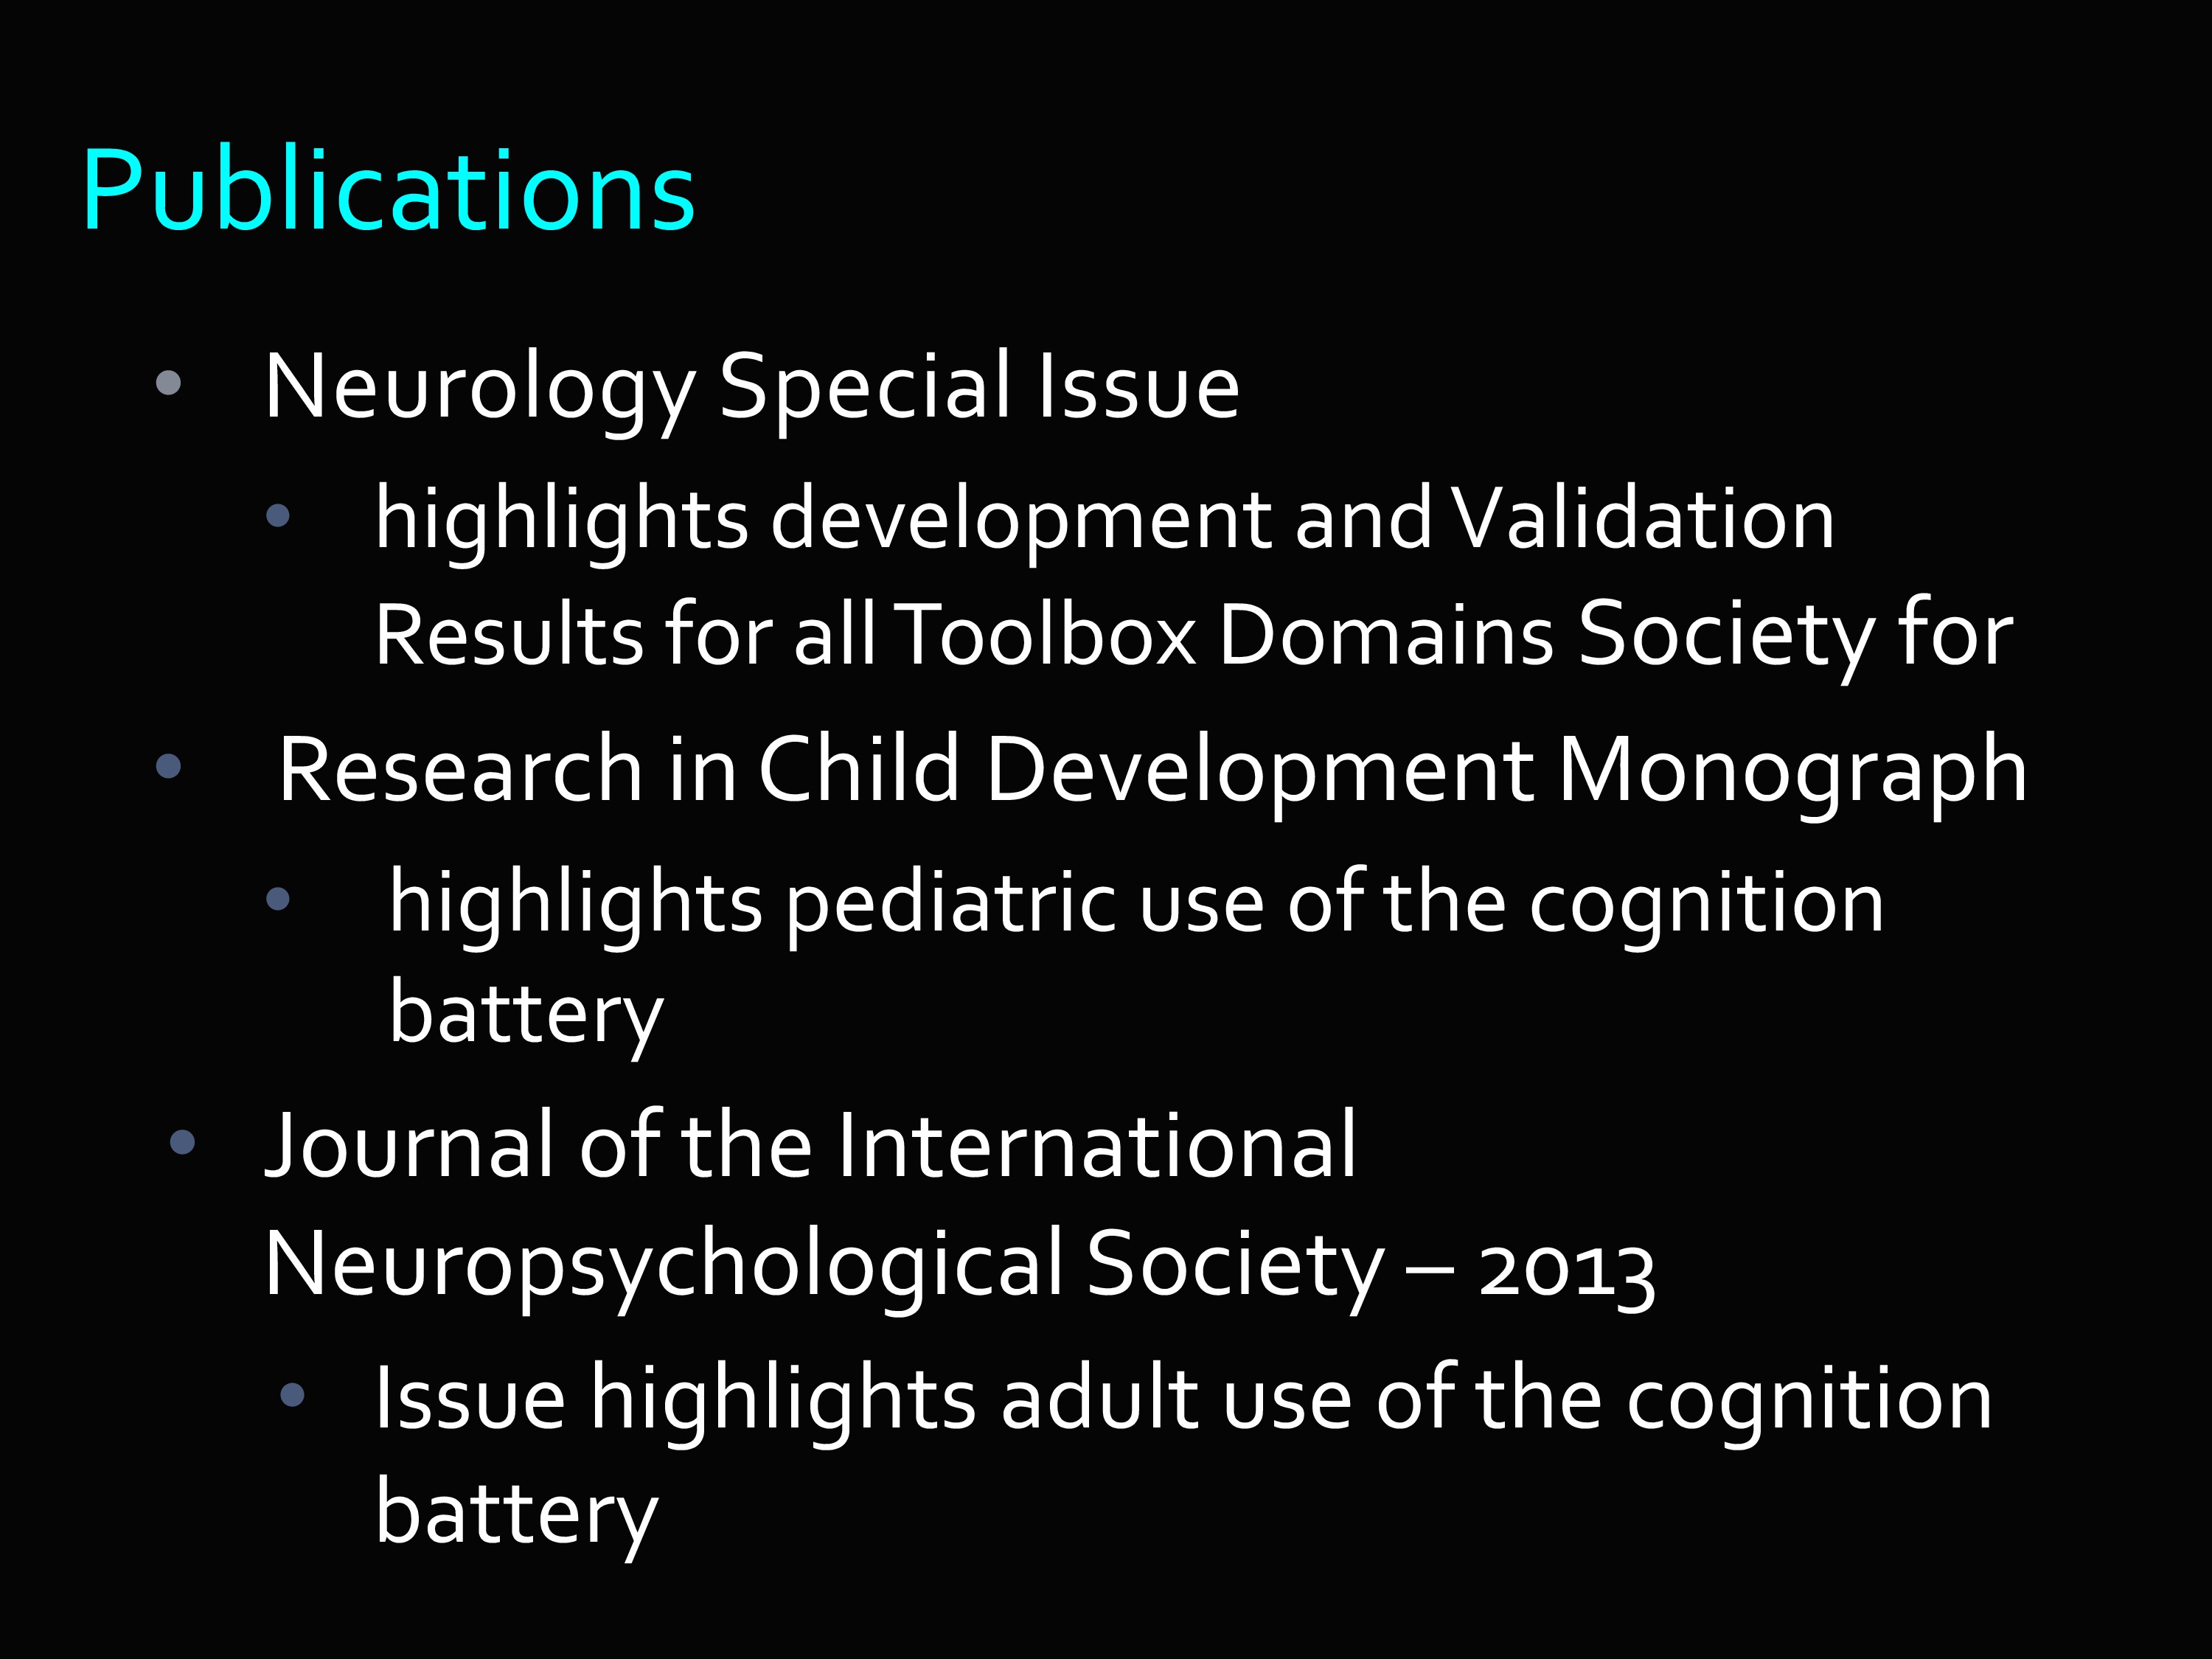
And there are a number of publications where you can see the validation of these instruments.
In summary, then, PROMIS and Toolbox are efforts that try to get broad measures. Broad in terms of scope. Broad in terms of the populations which they are appropriate for.
Normed so that you have some understanding of what a score means relative to some relevant population.
Efficient in the sense that you can use computer adaptive testing, but you can also use short forms and hand them out and score them by hand.
And quality. The foundation block of all of the instruments I’ve described, both PROMIS and in Toolbox, demonstrated very — sometimes tedious — methodological interest in qualitative research to ensure the quality of the individual items. Because without quality of individual items, there is no such thing as quality measures.
Questions and Discussion
Question: Both of these use constructs and measures of clinically relevant constructs, but there’s no use of ICF terminology or taxonomy. Is there any movement to make that happen?
I don’t know about Toolbox, but I know in PROMIS there is some awareness about the advantages of that kind of mapping. There are some efforts. That was not the framework we started from. But there is awareness of that, and interest in doing some of that mapping.
Question: What does a CAT do if you feed it different item structures? If you had an item that was binomial trials — you have multiple attempts. And you have another that’s a rating scale item. How do items like that work together?
You actually can do it. The Item Response Theory model, which is a mathematical equation, can handle a lot of different things. It can handle items with different numbers of categories in a single run, with some items that have only two categories and some that had eight.
With continuous data, it would have to be categorized at thresholds. Of course, that’s throwing away information. But it might be a trade-off that’s worth it.
If you were going to do that, you would not want to be arbitrary in those thresholds. You might want to look at distributions. You would want to finds those that make clinical sense, for example, to create those markers. Then it becomes like any other item with multiple categories. And it can be calibrated using IRT.
By the way, with Computer Adaptive Testing, everyone things, “Well, the person has to be in front of the computer,” which is less and less a problem now. But it could also be an interviewer in front of the computer.
Question: In terms of the Language Domain, PROMIS is maybe less broad than we would like it. Is there any push to expand PROMIS domains? Or is it static where it is now?
It is not at all static. In fact, I’ve heard the term “growing like a tumor.” There are a number of investigators developing new measures.
The people who worked on this were all over the country, so there is this huge collection of investigators grouped by their content expertise. So there’s a whole language group — that speak a language I don’t understand.
Comment: This greatly moves us forward in terms of having common data elements for studies. That’s a point that I think is obvious, but it’s one of the reasons why I think it’s so important.
I’m so glad you made that point. Because I meant to say that at the very beginning. It’s the whole reason for doing this. The reason the NIH was interested in putting this kind of money in — is the idea of having common data elements.
Question: I had a question about Toolbox. Where can we access classic psychometric data like basic reliability on tests?
All of that is available in the Tech Manual.
Question: If the items on the test you administer using computer adaptive testing are not rank ordered but have specific distances between items, does that need any modifications to work for the adaptive testing procedure?
What I gave was a fairly simplistic animation of what happens. It’s actually a mathematical formula that does that calibration. That estimates that actual distance between item parameters. It’s not like you need to rank them ahead of time. The mathematics does that ranking. Some IRT models take into account not just the difficulty of that item, but also the discrimination of the item.
Let me give you a one-minute explanation of Item Response Theory.
Item Response Theory is a mathematical formula. For every item — let’s talk about dichotomous items, you get it right/you get it wrong — for every item, it estimates the probability that you’ll get it right, conditioned on how much you have of the trait that’s being measured.
Then the way it’s scored is it looks at the pattern of responses that you make — which ones you got right, which ones you got wrong — and it takes that information mathematically, and the information it knows about the items and their characteristics, like their difficulty. And together, it makes its best-guess estimate of what your trait level is.
In other words, it gives the trait level that would be the most likely to create those responses. It is literally an equation that defines a little S-curve function. On the bottom is trait level, and on the side is probability. And that equation defines, if you don’t have much of the trait, you’re unlikely to get it right. The more of the trait that you have, the probability goes up. That is a one-minute description of Item Response Theory.
Further Reading: PROMIS
National Institutes of Health. Patient Reported Outcomes Measurement Information System (PROMIS). Available at http://www.nihpromis.org/.
National Institutes of Health. Assessment Center. Available at http://www.assessmentcenter.net/.
National Institutes of Health. PROMIS: Publications by Year. Available at http://www.nihpromis.org/science/PublicationsYears.
Further Reading: Toolbox
National Institutes of Health and Northwestern University. NIH Toolbox: For the assessment of neurological and behavioral function. Available at http://www.nihtoolbox.org/.
National Institutes of Health and Northwestern University. NIH Toolbox: Publications. Available at http://www.nihtoolbox.org/Publications.
National Institutes of Health and Northwestern University. NIH Toolbox: Technical Manual. Available at http://www.nihtoolbox.org/HowDoI/TechnicalManual/.

