

The following is a transcript of the presentation video, edited for clarity.
Key Intervention Components
So, what is it that we have been replicating since 1985? This is listed as “key intervention components” but now I have a new term. I’m going to call these “kernels” of LEAP.
Here are some features of LEAP that distinguish it, in many cases, not all, from other early intervention services for young kids with autism.
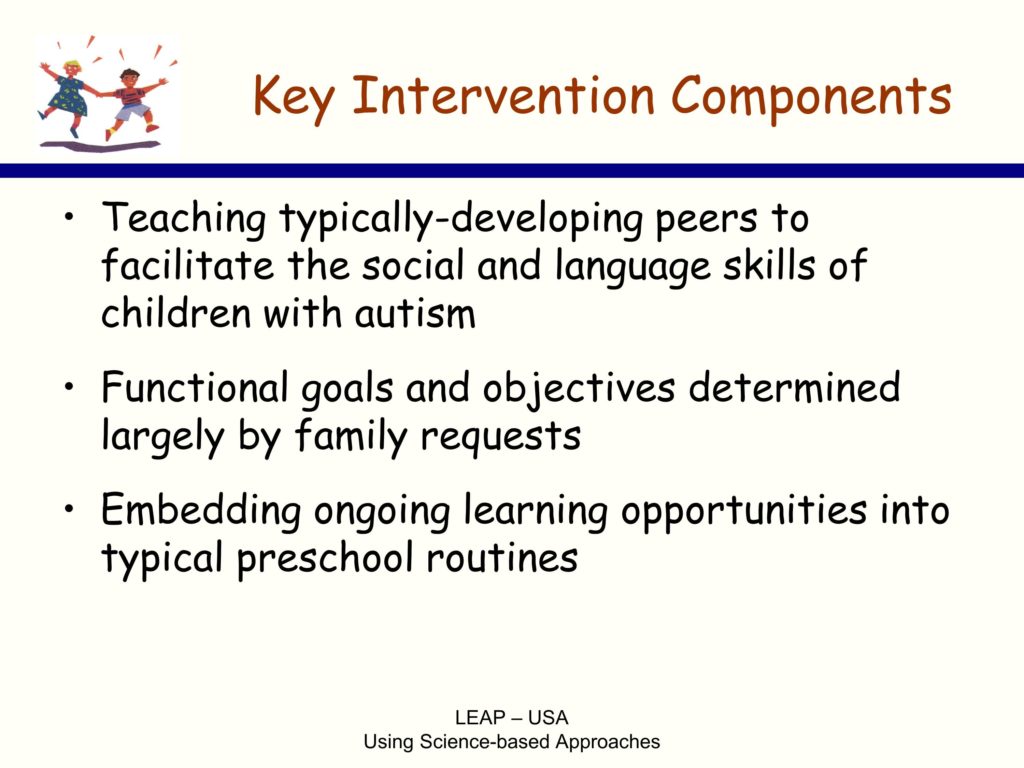
We spend a lot of time figuring out how to teach typically developing peers to facilitate the social and communicative skills of their classmates with autism.
We spend very little time assessing kids, coming up with functional goals and objectives. We essentially ask adult family members what they would like their kids to be doing, and if at all possible we try to deliver on that.
We also embed hundreds of learning opportunities for children throughout the day, and embed those within typical preschool routines: arrival, circle, spilling juice, those typical routines.
We also implement — in the service of generalization, not because we are committed to this service delivery model. But we are committed to serving the fundamental generalization issue that challenges all kids on the spectrum, and that is stimulus-response generalization.
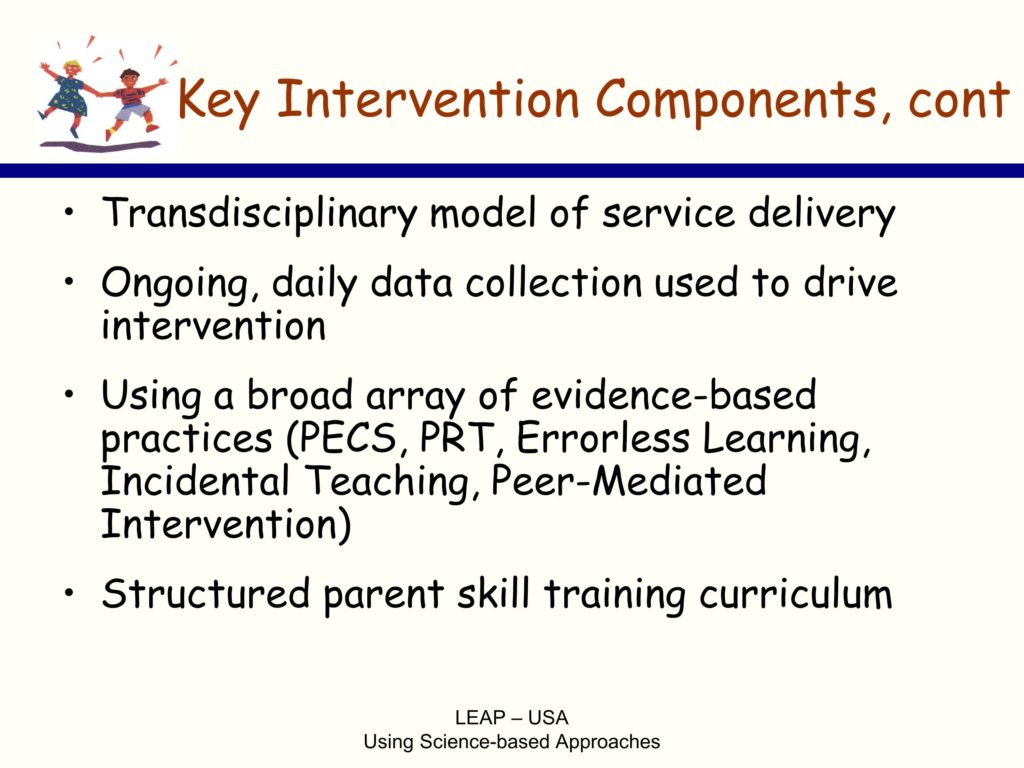
That’s why we employ a transdisciplinary model of service delivery. What does that mean on the ground? It means on the ground, in a high-fidelity LEAP program, if you walk into the program and you observe what adults did, you couldn’t tell by their interactions with each other, by their interactions with children, by their interactions with adult family members, what their discipline was. That’s, to us, an operational definition of transdisciplinary.
We also collect a good amount of data, like a lot of my colleagues, not for self-congratulatory purposes. But data that allows us to know in a timely fashion that we’ve made mistakes. Those of you in the autism business know there is a high probability that you’re first best idea about how to teach behavior X is not going to be correct. And if you do not have data systems in place that allow you to get immediate feedback on children’s performance, there is a high probability that you’ll be wasting your time and theirs. It is early intervention, and the window is fairly narrow. You can’t afford to continue making mistakes over the long haul.
Unlike most name-brand programs, LEAP is not a service-delivery system based upon the delivery of just one form of instruction. It never made any sense to me. The heterogeneity in this population is too great to rely on one model. These are not all of the evidence-based practices that we use, it’s just representative. So we use Picture Exchange Communication System, primarily not as a language acquisition device, but as a problem-behavior prevention one as kids are acquiring language to be able to express their wants and needs, desires, etc. We use Pivotal Response Treatment, Errorless learning, Incidental Teaching, Peer-Mediated Intervention.
How do we make a decision? Well, we try to be as data-based as possible. And if you look at the data on each of these interventions, I believe that you will come to the conclusion that they work better in some developmental domains than others. And all things being equal, that’s how we make initial clinical decisions as to what to use with individual kids.
That’s a little bit about LEAP as a preschool intervention, but that’s just half of our model. The other thing we do is we spend time, as much as family members think they need, in folks’ homes trying to make routines more manageable for them. Our goal is not to turn parents into therapists, but to make family life more easy, more happy, more normalized.
So we deliver a highly-structured, manualized parent skill training curriculum, but we do it in settings parents say they want help in, and we teach skills not in the order that’s in our curriculum, but in the order that’s applied to that particular setting. And the staff just hope and pray the parents don’t say, “We need help at bedtime.” But occasionally, prayer doesn’t work and people’s hours are a little bit different.
Quality Program Indicators
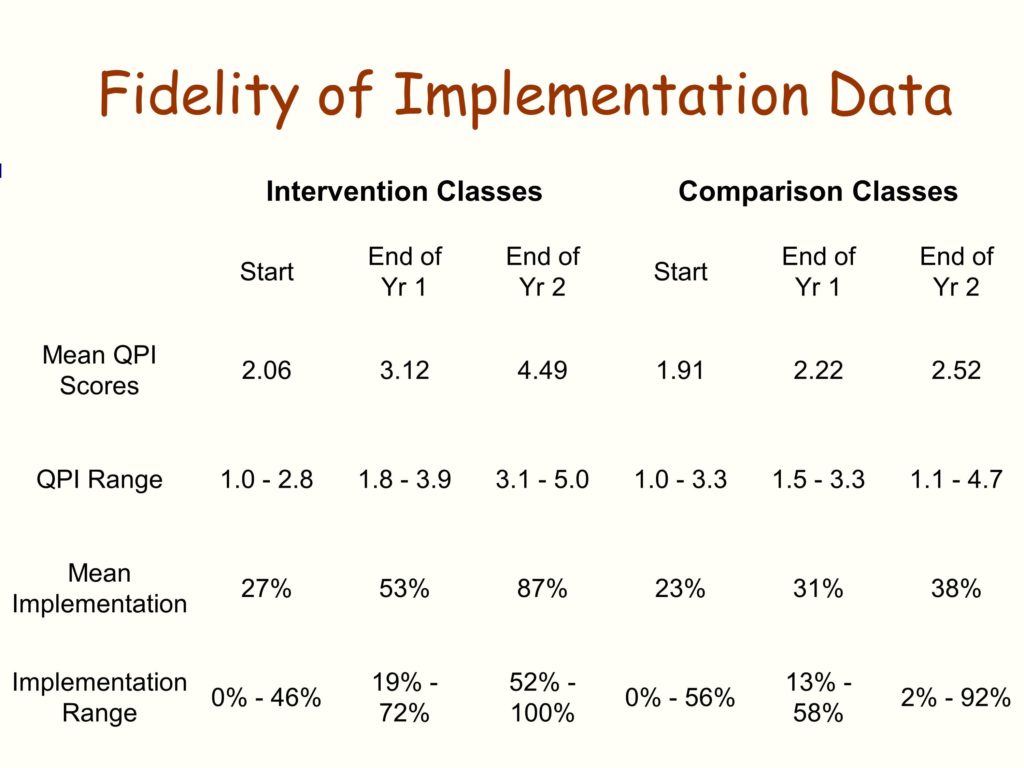
So, in 1985, shortly after launching efforts to replicate LEAP, we were desperately in need of a fidelity measure. We asked ourselves, “Well, what are we going to do here folks?”
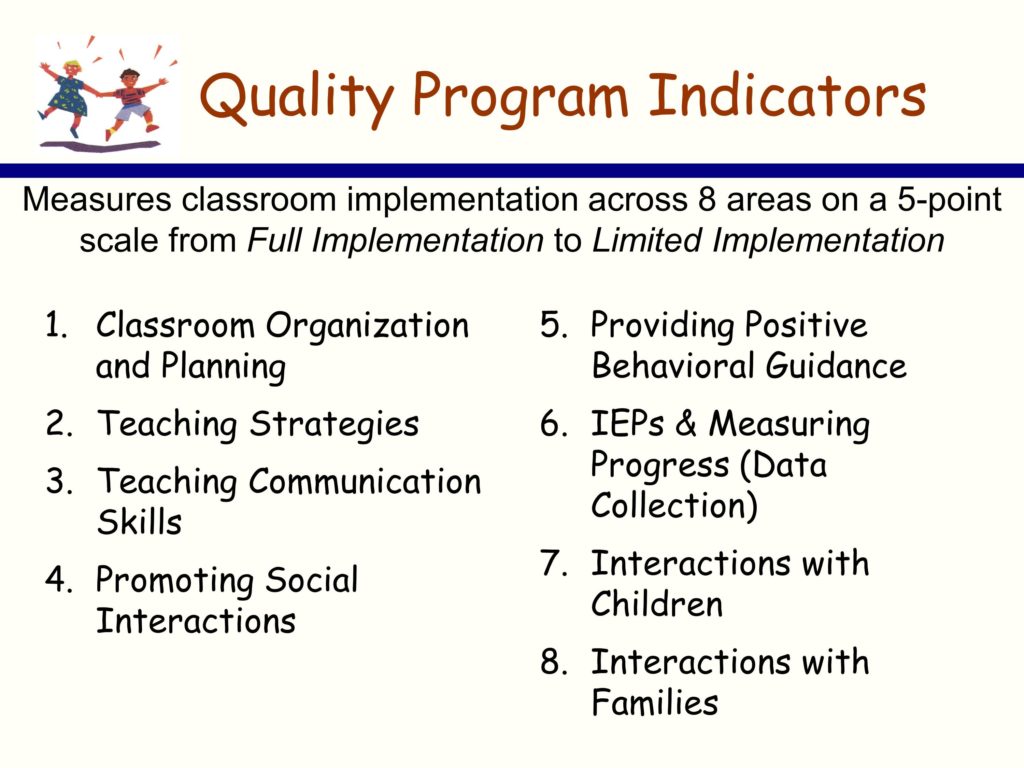
Here’s the strategy we used. I don’t know if it’s good, I don’t know if it’s bad, you decide for your own purposes. But here’s what we did. We went back to all those precedent single-case design, mostly multiple baseline across setting and multiple baseline across participant studies. And we asked the question, can we turn the independent variables in those studies into readily measureable, reliable coaching system indicators that allow us the best chance to say whether or not folks are at fidelity in terms of implementing the LEAP model.
And the QPI, the quality program indicators, is about a 50 item scale. It measures eight different kinds of dimensions of implementation of LEAP.
Sustainability of Fidelity
So, looking back over the last 30 years of this work, we’ve had the opportunity to do some critical informant interviews with folks. We’ve been able to tap into programs who have been running at a very high degree of effectiveness for almost three decades, and some not.
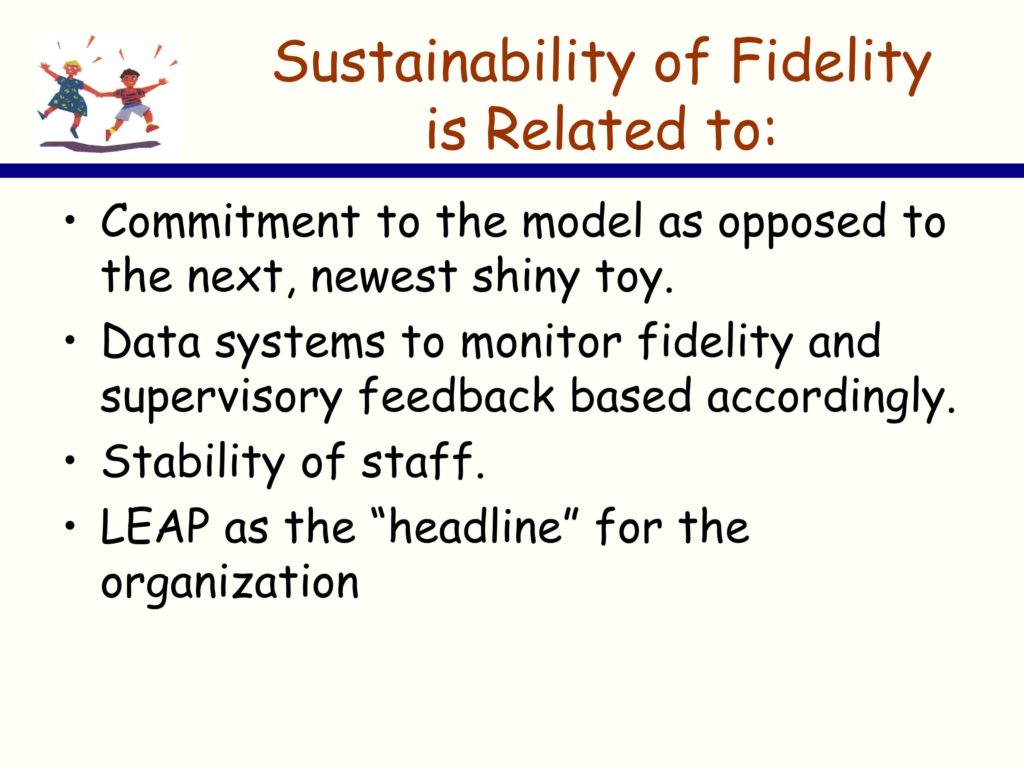
Here’s our best guess at what sustains fidelity — at least with this program, in these kinds of educational settings.
The first, not necessarily in order of importance, but the first piece of it is the commitment of the primary administrator — that is the person in charge of purse strings — to the model, as opposed to the next, newest, shiny thing. By that I mean that the primary administrator is presented with the next, newest, shiny thing and his or her response was something like this: “Well, I’d like to see the data on that. Oh, that data looks pretty good. Do they have any evidence that process can be replicated outside of UC Santa Barbara … or UC San Francisco … or UC Boulder … or wherever?” So it’s not that they automatically rejected the next new shiny thing, and in the autism business, that’s probably twice every hour if you’re on the Internet, in terms of the next new shiny thing. It’s not that they offhand rejected it, but they were careful consumers, if you will.
We also have identified another key factor — or, if you will, a behavior of primary administrators. That is, they have used the QPI as their supervisory system. Instead of going into a classroom willy-nilly, which is how it usually happens, and observing without a protocol, and then writing up impressions like, “That is a pretty good teacher today. Didn’t see anybody getting hurt. Looks good to me.” they use this data system.
Here’s what they also did — they created a personnel ladder within their organization to reinforce high fidelity use. So retention and pay increases were tied to the QPI.
Stability of staff. In the early intervention business, staff turnover really rapidly. It’s a — forget about the issue of implementation and implementation science — it’s just a horrific experience for organizations, for families, for kids. It’s not so much that programs that maintained over time didn’t experience staff turnover. It’s that they had mechanisms in place to recover. The most common one being that they assigned new staff to experienced folks in the programs with the specific goal of mentoring them on items in the QPI in which they scored low in terms of initial performance.
Finally, the other fuzzy variable. It’s hard to pin down, and there have been a number of other iterations, but it looked to us like it was pretty significant. And it’s that for programs that maintained it for many, many years, LEAP was the “headline” of the organization. That’s how they advertised themselves. They weren’t just an autism program that does some inclusionary stuff, but “this is what we do. We’re going to ride this horse. This is our banner, this is our headline.”
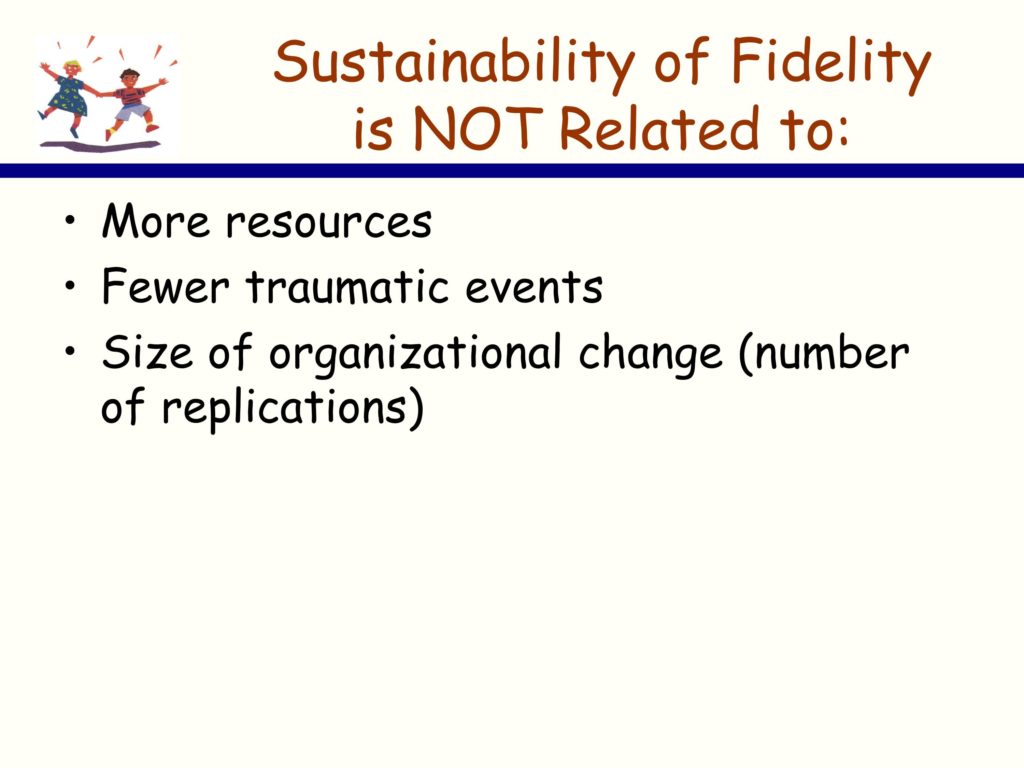
Here are some things we were a little surprised about. We can’t find an association between service systems that were well-resourced and maintaining fidelity over time.
We did some replications in the wealthiest school district in the United States. It’s in the northeast, that’s all I’ll tell you. They didn’t last very long. But resources, incredible. We’ve had a number of other iterations of that.
We’ve also had replications in some of the poorest, impoverished places, and they’re doing just fine, thank you.
We thought that programs that got hit with a lot of traumatic events would lost their momentum. Traumatic events like, a new administration comes into power in state government and decides to slash all preschool services — that happens more often than you might think. But that doesn’t seem to be necessarily related to sustainability.
And the real surprise was, we couldn’t find any association between the size of organizational change and sustainability. By that I mean, we’ve worked in some school districts where we replicated LEAP in dozens of settings. You would think that would meet the permeability test, in terms of influencing the organization, but it doesn’t seem to predict for us.
Intervention Questions Potential Implementers Tend to Ask
-
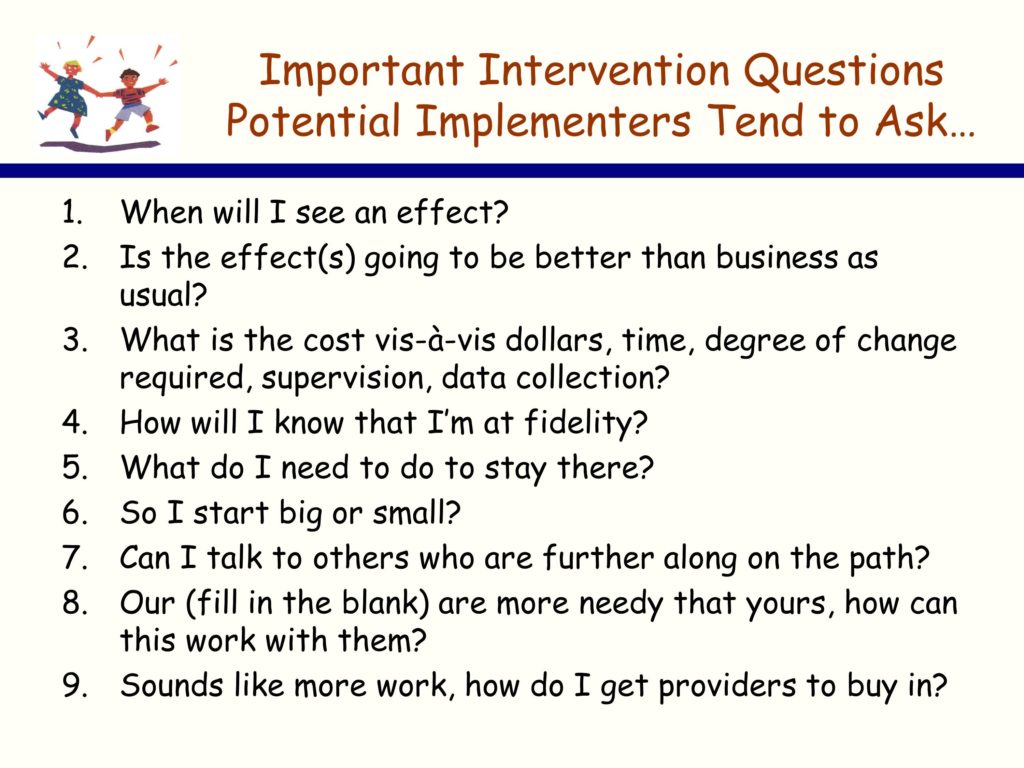
When will I see an effect?
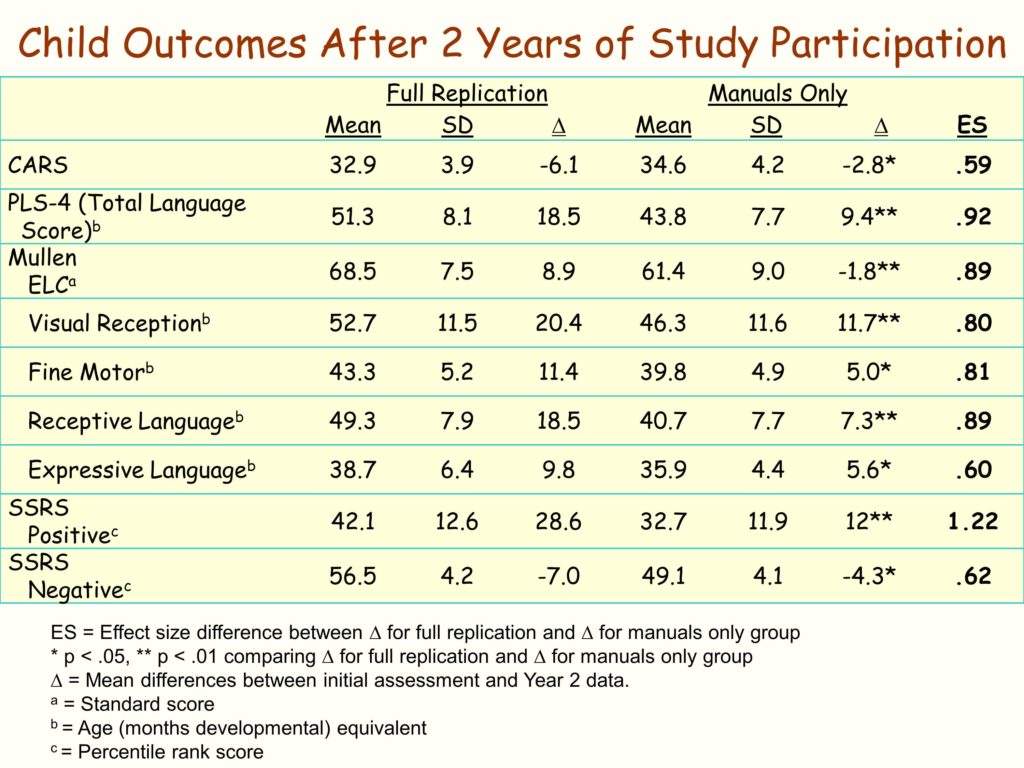
We have a lot of data on what the size of our effects are, but no one has ever said to us, “We love your effect sizes, they are so huge.” What they want to know is when is this going to take effect. And if you ask parents what they want, what’s the answer they want: “When’s my kid going to get better?” It’s a when question, and it has a profound impact on the designs we use, how frequently we collect data.
-
Is the effect going to be better than business as usual? We’ve talked about that a lot over the last couple of days.
-
People want to know what the cost is at all different kinds of levels: Dollars, the degree of change that’s going to be required in my organization, how much supervision am I going to have to take on that’s different from what I’m doing now, what’s the data collection requirement that’s over and above or different from where we are now?
-
How will I know that I’m at fidelity?
-
And perhaps more important in terms of long-term sustainability, what can I do to stay there?
Most people already know — as has been pointed out, they’ve adopted other things in the past, and drift has clearly occurred.
-
And I don’t know the answer to this, and I struggle with this mightily: People often want to know, do I start big or small?
My organization has 35 classrooms: Do I go all in? Do I do a test, a natural experiment? Start with 5 and see how it goes, see how the consumers feel about it, see how the implementers feel about it? I don’t know the answer to that, but it’s a question people have.
-
Can I talk to other folks who are further along the path?
This kind of notion, Albert Bandura is one of my heroes, and I think his most amazing accomplishment is this notion of the proximal model, which is to say, if you want somebody to emulate something that pair of individuals who perceive each other to be most like one another, that’s where the power is. Frankly, we’ve done a lousy job up to now making those connections for people, but I’m committed to doing better on that.
-
Next to last — I bet y’all get this a lot — our (fill in the blank — our clients, our providers, our families, our whomever) are more needy than yours. How can this work with them?
Everybody feels like they are in the deepest hole that can possibly exist. Right? Being able to respond to that honestly is really importantly. And I don’t know how to do that other than having replicated LEAP in some deep, dark holes.
-
Finally: This sounds like more work, how do I get my providers to buy in?

