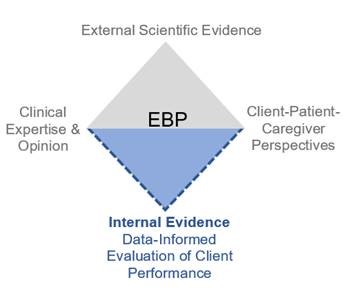
In the early 2000s, ASHA began to promote the application of an evidence-based practice (EBP) model to the discipline of communication sciences and disorders (CSD). This triangular model addresses recommended contemporary practice in speech-language pathology but is flawed by design. It specifies that clinicians should (a) consider the best external evidence available, (b) take into account client and other stakeholder perspectives, and (c) apply their own clinical knowledge and experience to shape the treatment plan. However, it does not credit performance data that are collected by clinicians. Dollaghan (2007) recognized this problem and proposed including internal evidence(i.e., practice-based evidence)as part of the EBP definition. We could not agree with her more. The systematic collection and analysis of client performance data should be an integral component of best clinical practice and warrants inclusion in the EBP model. Figure 1 presents an expansion of the triangular construct of EBP into a “diamond” model.
A Case for Internal Evidence
The importance of using clinical evidence to inform treatment decisions emerged almost 2 decades ago. Olswang and Bain (1994) argued that data collected during therapy sessions serve a purpose greater than accountability or justifying treatment decisions after the fact. Analysis of client performance should form the basis for evidence-informed decision making (EIDM) throughout the therapy process. The authors also posited four critical questions, the answers to which rely on practitioner observation of client behavior and guide the course of therapy:
- Is the client responding to the treatment program?
- Is a significant, important change occurring?
- Is the treatment responsible for the change?
- How long should a therapy target be treated?
Each of these questions addresses different aspects of intervention (e.g., progress, the reason for success, when to dismiss), and each may require different data collection and analysis approaches and measures. Olswang and Bain (1994) noted several practical challenges with this approach, including the time and energy needed to organize, calculate, and/or visualize therapy data on an ongoing basis.
Solutions: Tools for Graphing and Visual Analysis
Today, clinicians have the means to analyze ongoing treatment data relatively quickly, making it accessible for use in making informed decisions. Computer programs and digital technology provide easy ways to graph and analyze data. Graphing uses our human pattern recognition skills and overcomes many of our cognitive limitations (e.g., memory, mental calculation). During the past several years, researchers have been developing a single-case visualization approach (Moulton & Higginbotham, 2007). The following figure presents a hypothetical example of an intervention that demonstrates how clinicians can use data visualization to facilitate EIDM.

Figure 2 shows that a clinician completed five treatment sessions to improve a client’s fluency problem; however, individual session data do not forecast client goal attainment (i.e., 85% correct for two consecutive trials). This information can be obtained through graphing by extending the trend line from the data path until it intersects with the goal line (at about Session 17). A reconstructed client performance entry point also can be plotted based on family/client estimates of pre-treatment fluency. Finally, visualizing the maintenance phase and coupling it with the client’s self-rating provides evidence about the permanence and importance of our intervention. These additional data are plotted in Figure 3.

Of course, this example is based on fabricated data, but with visual–conceptual tools such as graphs, clinicians can make evidence-informed decisions as client performance patterns emerge. This approach can increase the informativeness and validity of an intervention approach with a minimum expenditure of time. We also find that graphing treatment data and using visual analysis tools increases new clinicians’ involvement with their data. Clinicians ask more questions and actively use data in the course of making clinical judgments, but it takes a reliable set of conceptual and technical tools to make that happen.
From Square to Diamond
In this article, we articulate a case for using EIDM in daily clinical practice and assert its fundamental role as part of EBP. We argue that data visualization can serve as a catalyst for the systematic incorporation of internal evidence throughout the therapy process. As the concept of EBP continues to evolve within the CSD discipline, we propose that the EPB triangle become an evidence-based diamond, instead—one that captures the critical role of internal data in making evidence-informed decisions during the course of therapy.
References
Bain, B. A., & Dollaghan, C. A. (1991). The notion of clinically significant change. Language, Speech, and Hearing Services in Schools, 22, 264.
Campbell, T. F., & Bain, B. A. (1991). How long to treat: A multiple outcome approach. Language, Speech, and Hearing Services in Schools, 22, 271–276.
-Dollaghan, C. A. (2007). The handbook for evidence-based practice in communication disorders. Baltimore, MD: Paul H. Brookes Publishing Co.
Moulton, B., & Higginbotham, D. J. (2017). Therapy-science. Retrieved from http://Therapy-Science.com
-Olswang, L., & Bain, B. (1994). Data collection: Monitoring children’s treatment progress. American Journal of Speech-Language Pathology, 3(3), 55–65.
Olswang, L. B., & Bain, B. A. (1991). When to recommend intervention. Language, Speech, and Hearing Services in Schools, 22, 255–263.
Orme, J. G., & Combs-Orme, T. (2012). Outcome-informed evidence-based practice. New York, NY: Pearson.