

The following is a transcript of the presentation video, edited for clarity.
My name is Sharon Yeatts, and I’m an Assistant Professor of Biostatistics with the Data Coordination Unit at MUSC. And we are responsible in many cases, as the Statistics and Data Management Center for helping to design and implement these clinical trials in a number of different disease areas. There are a number of phases in clinical development, and oftentimes we find ourselves at the back and with a confirmatory clinical trial that did not work, and we are left to ask why that trial did not work.
Clinical Development
So I’d like to start by sort of stepping us through the clinical development process and point out where these adaptive designs can be particularly helpful.
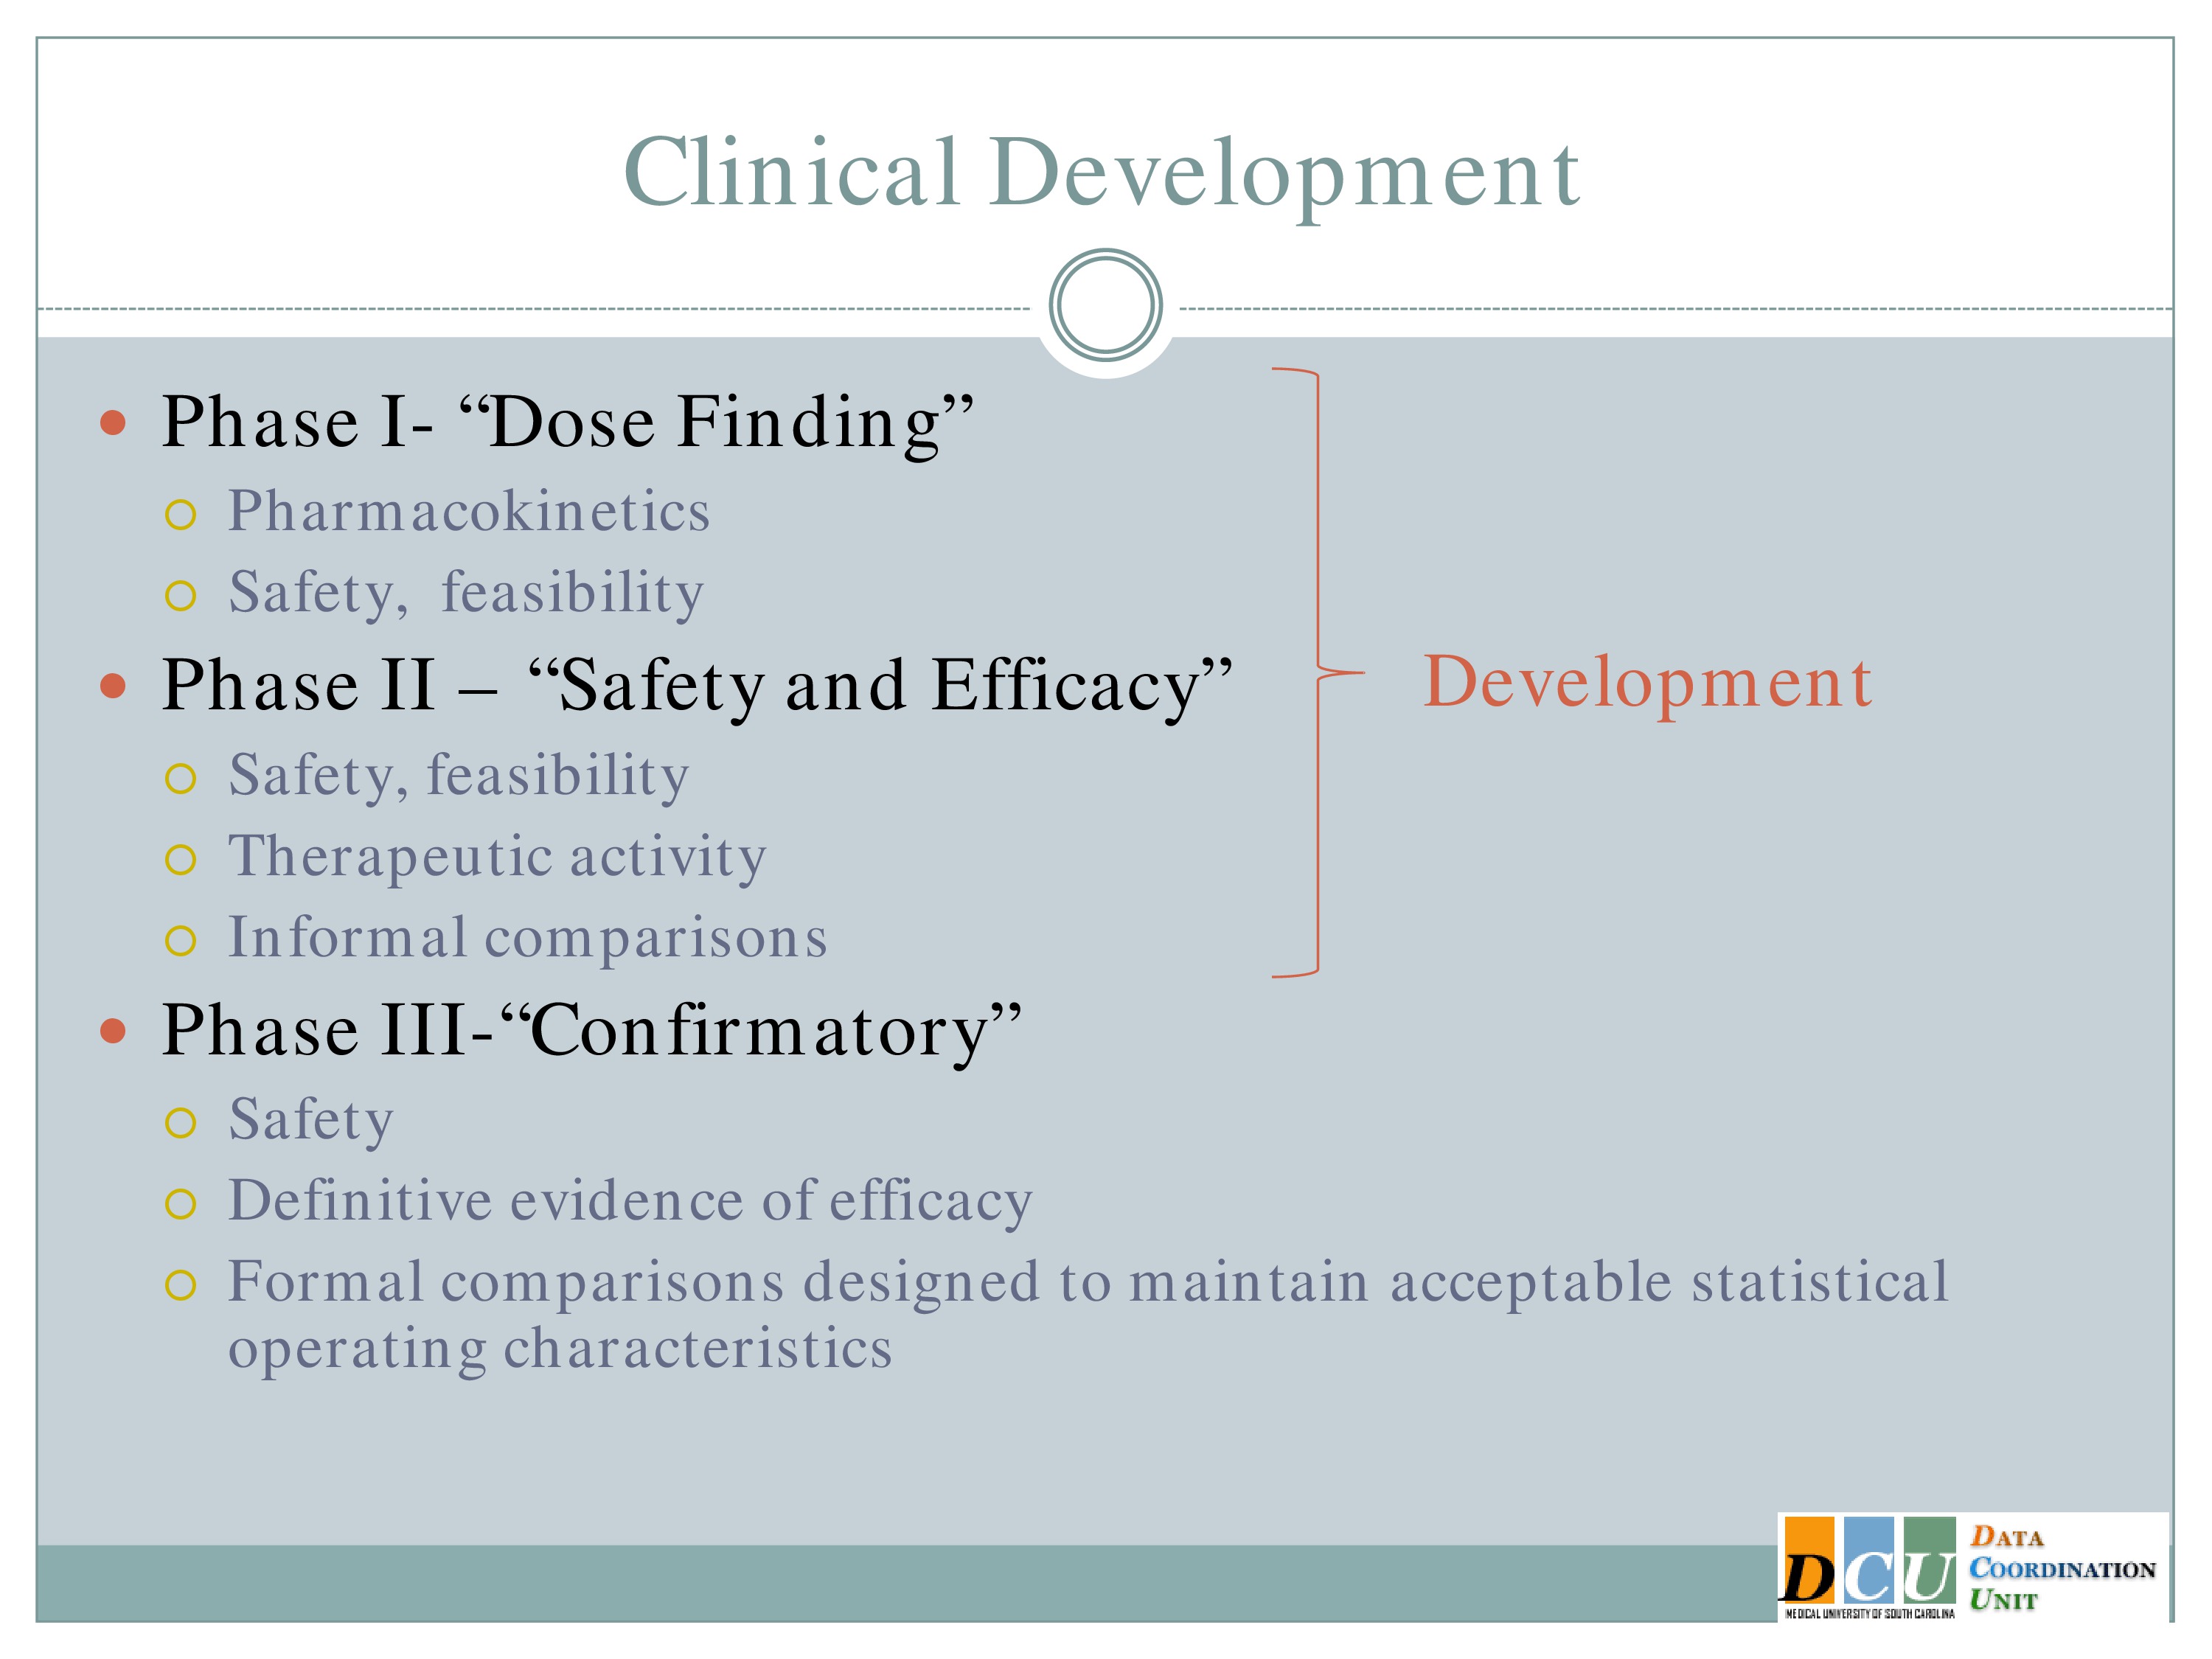
In Phase 1 we typically refer to these as dose finding studies, and here we’re interested in assessing sometimes pharmacokinetics, always safety and feasibility, and this is true of any intervention, not just of a pharmacologic agent. We’re trying to establish what the dose is that gives us the most likely impact when we move to future phases.
The next step would be Phase 2, safety and efficacy, where again we’re still looking at safety and feasibility but now we’re also trying to establish that there is some evidence of therapeutic activity, either a biomarker that indicates that the agent is, or the intervention is working, or a surrogate outcome that is associated with our long-term clinical outcome. And our conclusions in Phase 2 are generally based on informal comparisons. We generally at this stage do not have enough subjects to make a definitive statement about whether or not an intervention works.
We save that for Phase 3, the confirmatory stage, where here we’re trying to establish definitive evidence of efficacy based on formal comparisons which are designed to hold to strict statistical operating characteristics. As I said, it’s often the case not only in this area but in many other areas, that we find ourselves with a randomized control trial that shows no difference, and we’re trying to understand why.
It’s not in this Phase 3 that I would argue that the adaptive designs are going to be most helpful, although there are statisticians who would say this is where we could use that information. We have enough subjects at this point.
But in the drug development stage where you’re really learning about the intervention, where you’re trying to establish how long should we be working with a patient on any given session, how many swallows do we need to see, it’s establishing these sort of treatment parameters that the adaptive designs can really be beneficial.
Dose Finding Overview
Objectives
So we’ll start with dose finding.
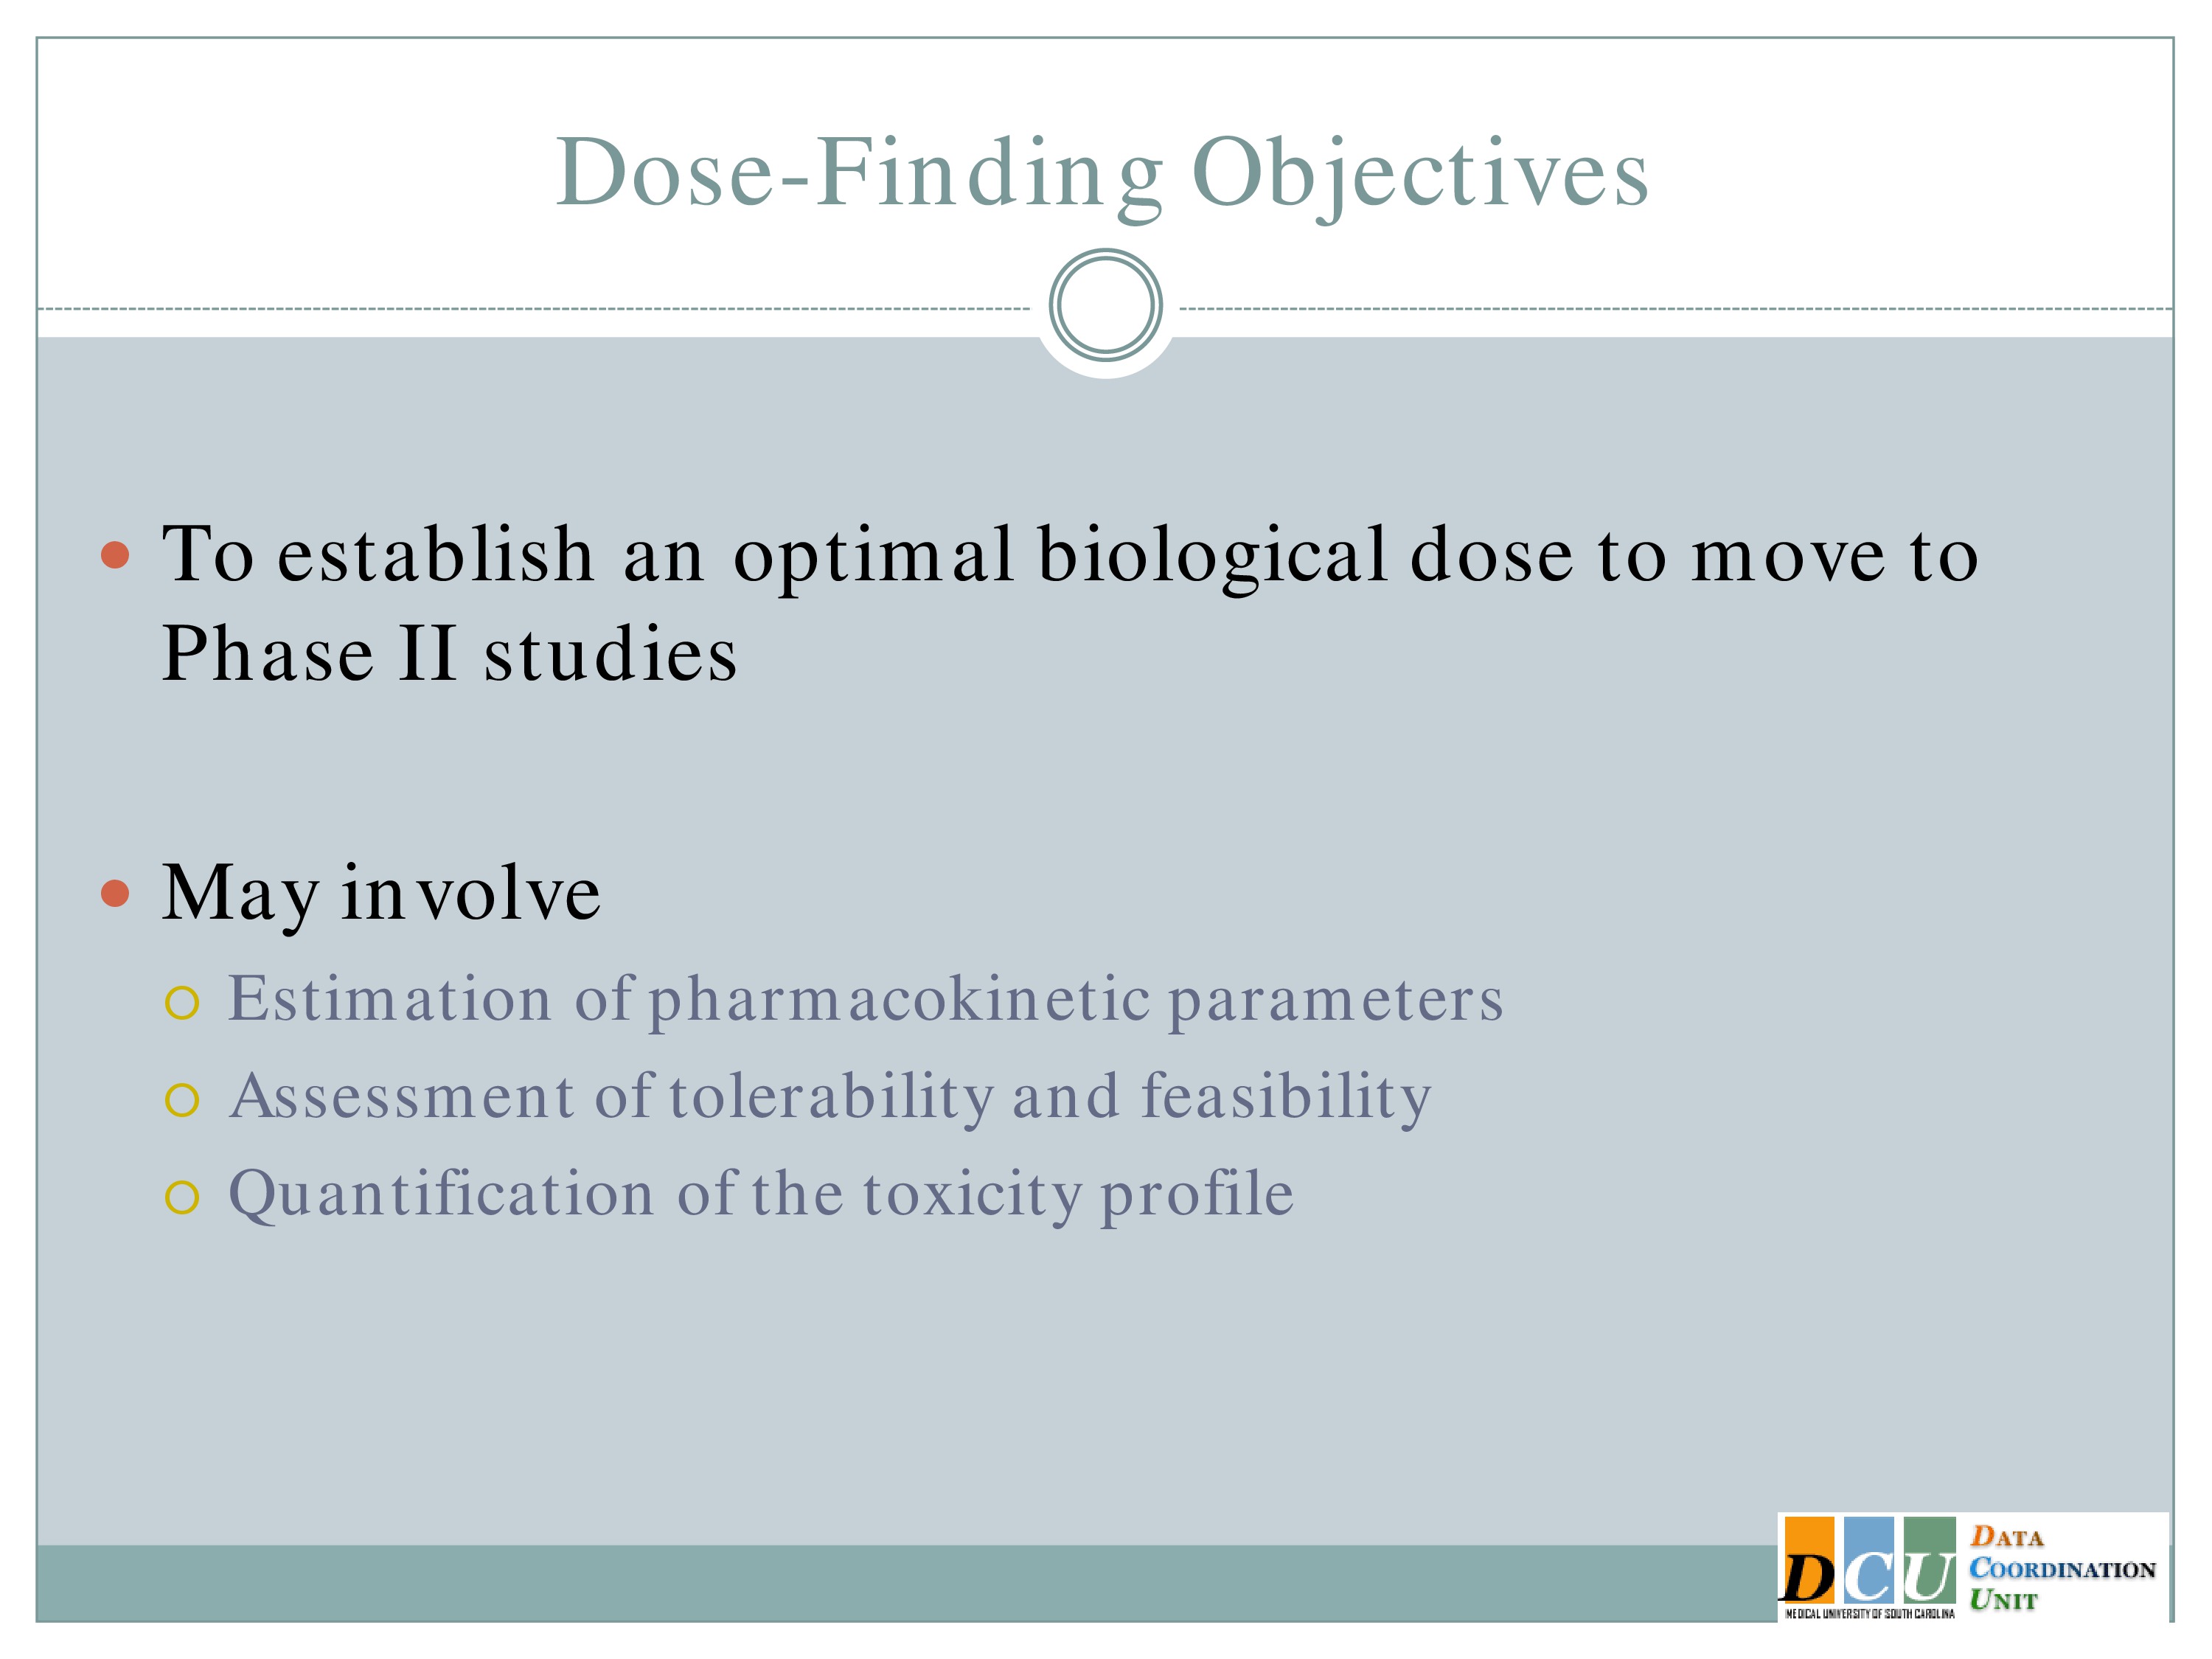
In dose finding, we’re trying to establish an optimal biological dose that we are going to move forward to future studies. This may involve estimation of pharmacokinetic parameters. It’s almost certainly going to involve an assessment of tolerability and feasibility, and a quantification of the toxicity profile and I’ll show you an example of what that means.
Dose-Response Curve
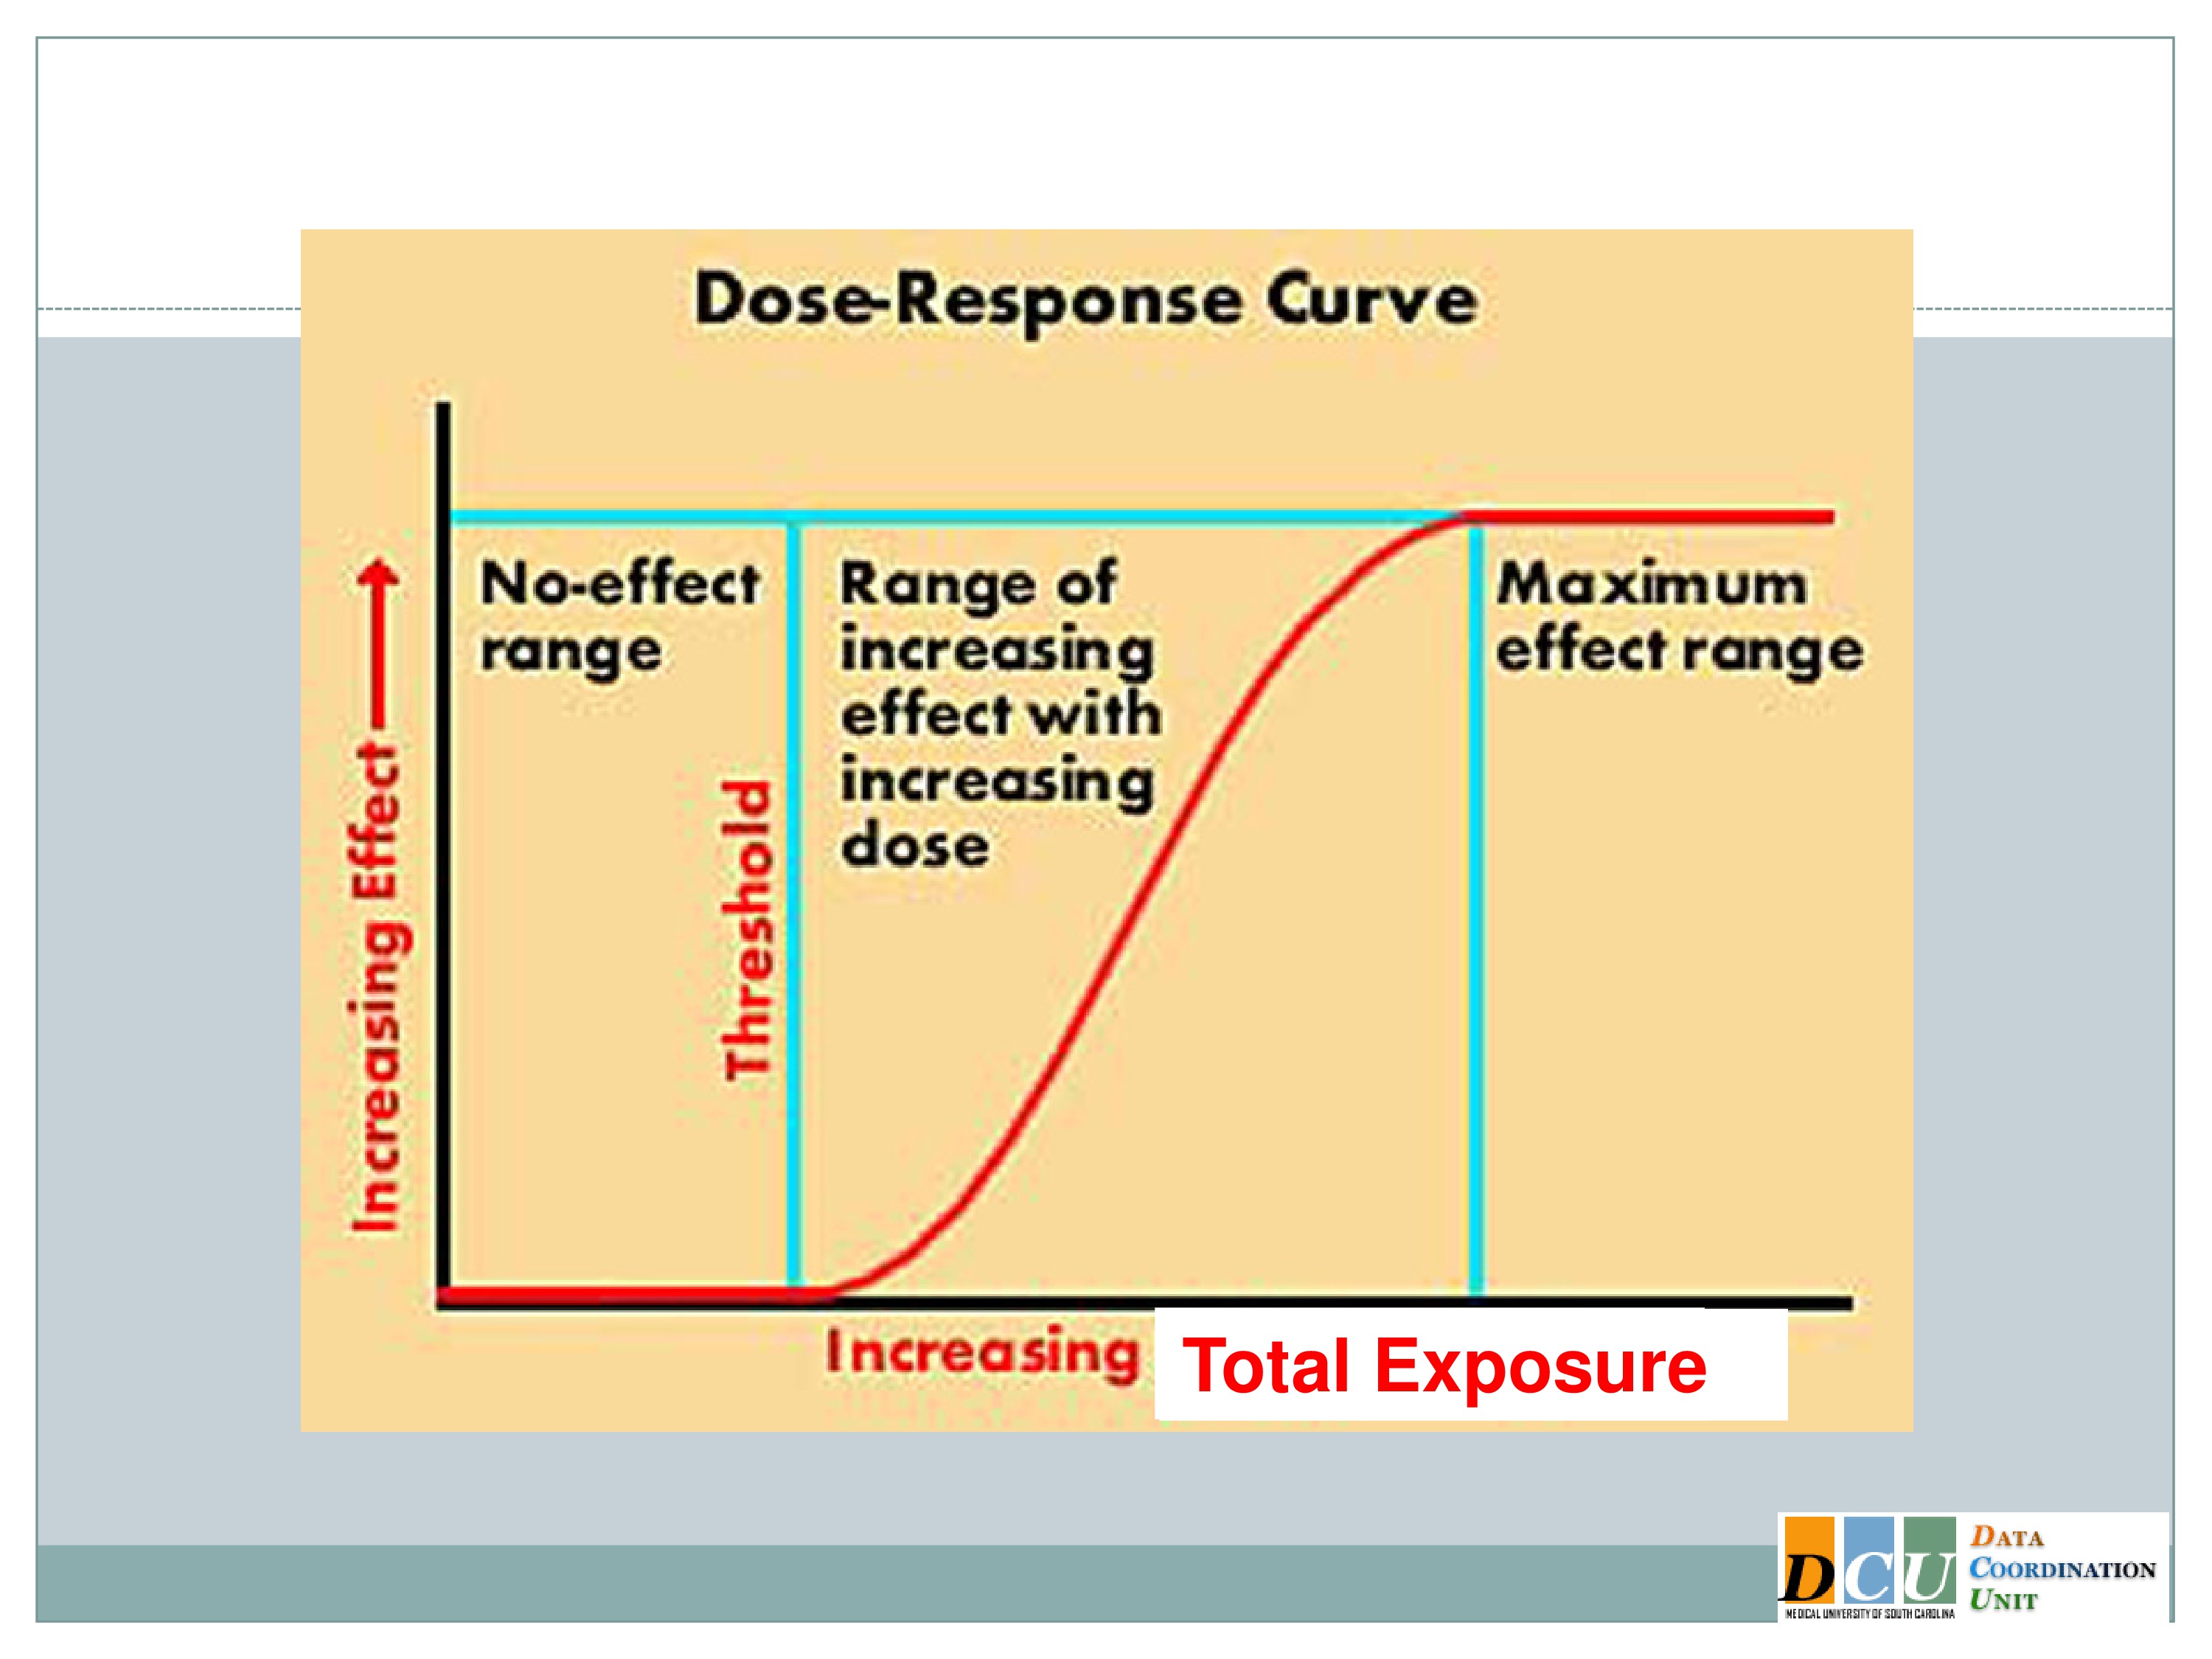
What I’ve shown here is a typical dose-response curve. The effect is increasing along the y-axis, and that effect could be anything. It could be a toxicity endpoint, it could be a tolerability endpoint, something like fatigue, which we don’t necessarily consider to be a toxicity event, but which has implications for whether or not an intervention could be feasibly applied in our patient population.
It could also be an efficacy response that we’re trying to assess, and we’re relating that effect to some dose, and that dose increases along the x-axis. And I’ll say here, because in the disease areas that I work in most of my experiences have been with pharmacologic agents, dose doesn’t have to mean dose of a pharmacologic agent. It could mean the duration. We can increase duration. We can increase the intensity. We can increase the total exposure. We can even do multiple of these components at the same time. Of course, it’s going to increase the complexity of your design, but it can be done.
And so if you think about the dose space in this sort of broad capacity, where dose could mean any number of attributes of your intervention, we can divide the dose space into three general areas.
The low dose space in many instances shows no effect at all. The body is a very, it’s a fabulous thing. It can respond to many insults without your even knowing that the insult took place.
You have to get beyond some dose threshold in order to see the activity in the response, and that’s where we really want to focus our attention, is in this middle section of the curve, where as your dose increases, the rate of your response changes as well. And again, I’ve shown you here, because we’re talking about Phase 1 dose finding, which is usually based on toxicity, I’ve shown you an increasing dose response curve. But we could draw this very easily the other way, where as the dose increases, the response declines. The methodology is the same.
So there’s this region of therapeutic activity, where as we increase the dose the response changes, and then we get beyond another threshold into this plateau region where essentially we can’t effect a change in the outcome anymore. Either the dose has become so toxic that all of our patients are exhausted, or we’re doing so well that there’s just no additional benefit that we can derive from providing additional dosing.
Defining the Optimal Dose
So when we talk about defining the optimal dose, I’ll ask you to keep that dose response curve in mind, because the optimal dose can mean different things, and it may very well mean different things at different stages of study or for different interventions.
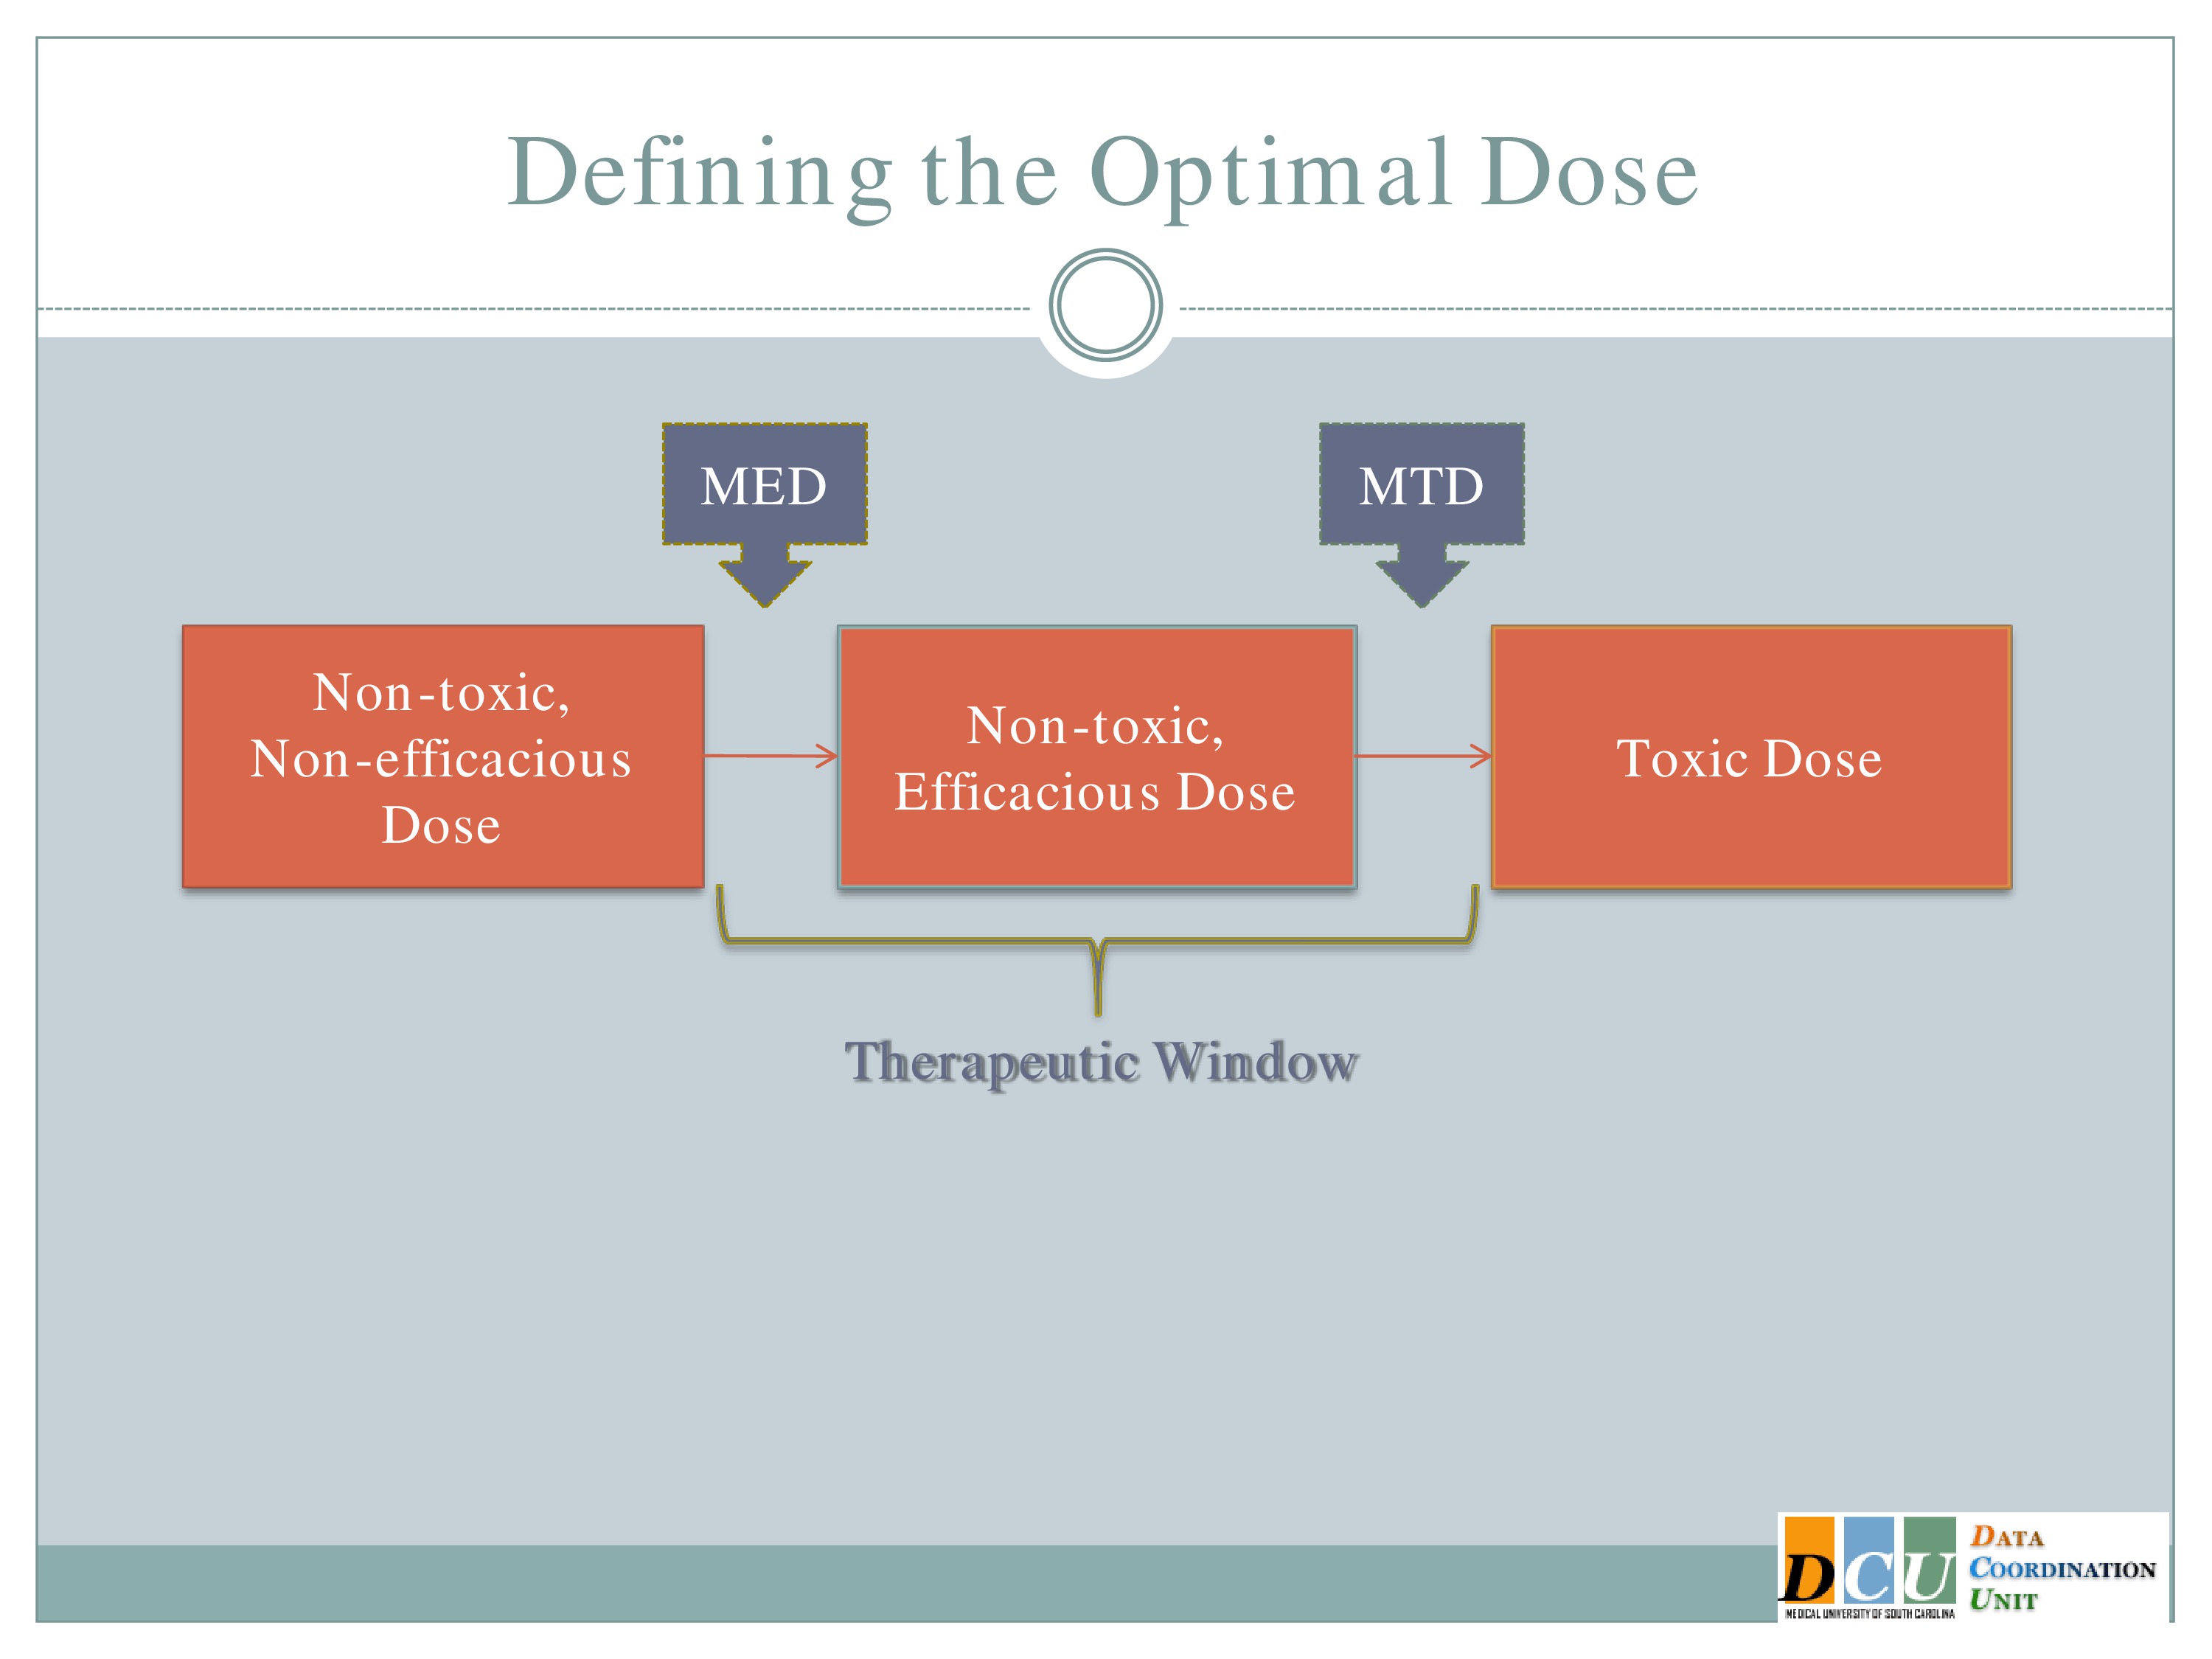
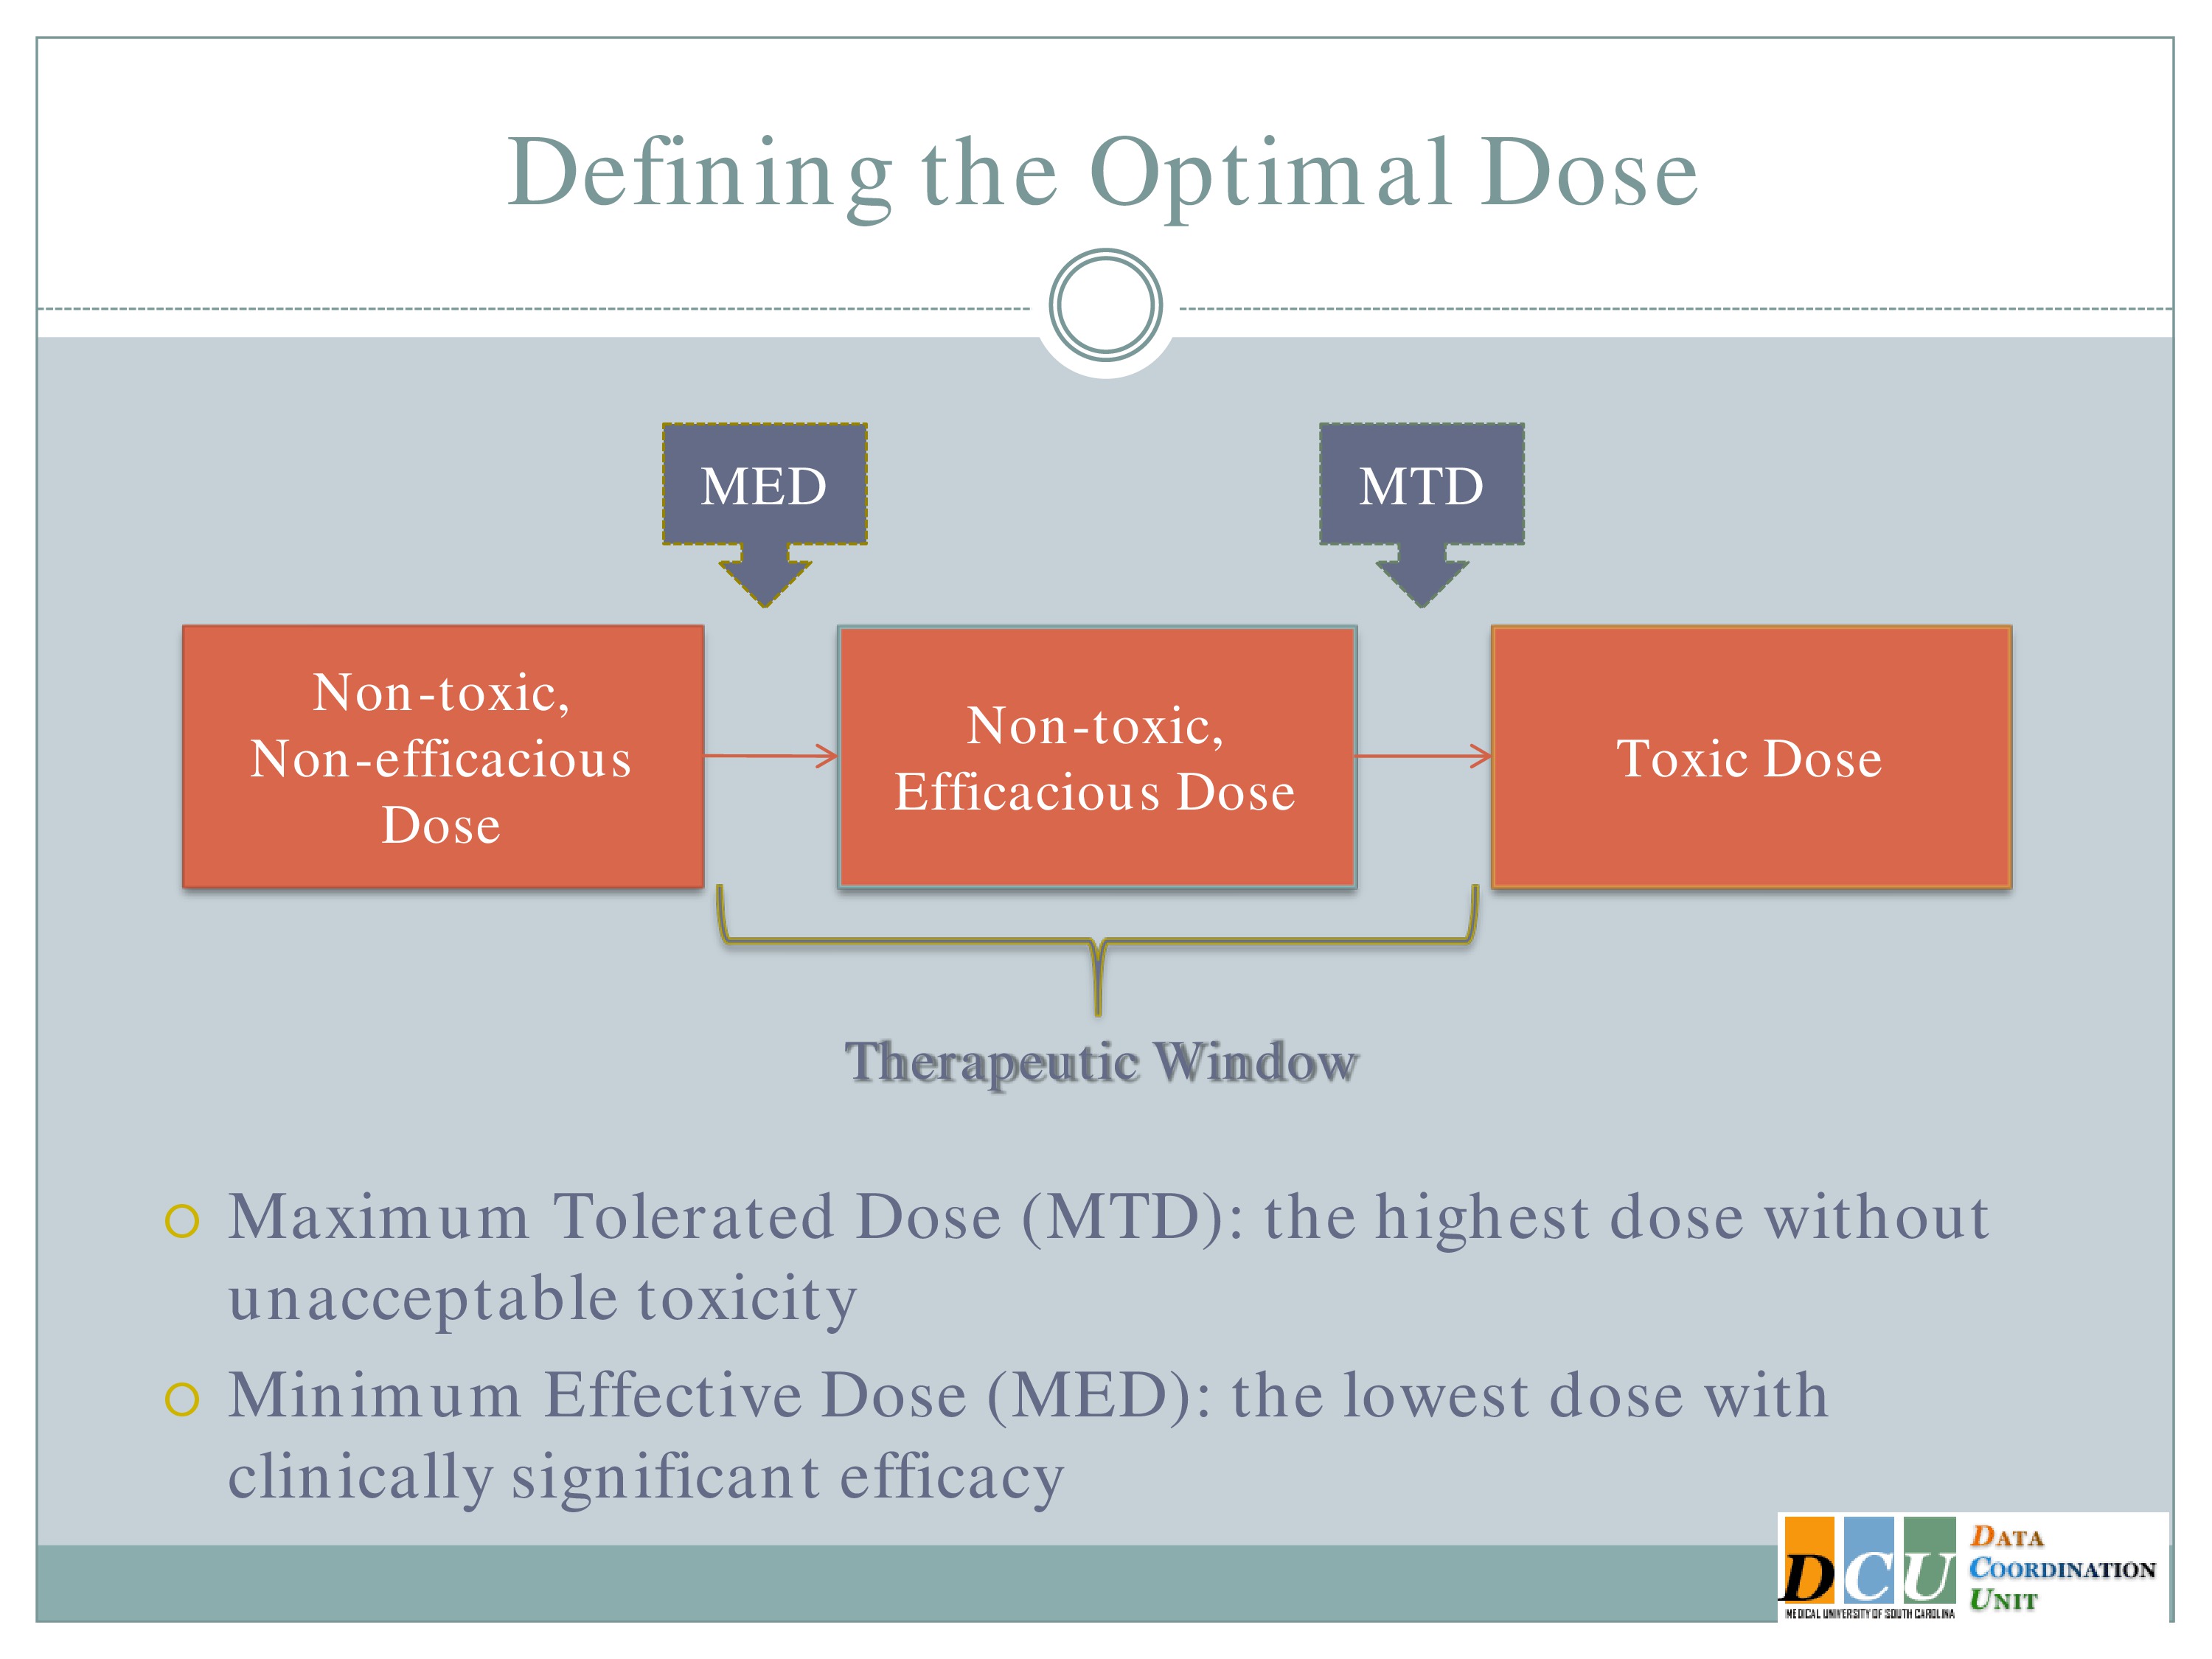
The two definitions, I guess, that I’ll focus on are the Maximum Tolerated Dose, which is the highest dose that you can administer without observing unacceptable toxicity. This is going to basically be the upper end of that therapeutic region.
The other dose that we might be interested in finding is the Minimum Effective Dose. That’s the lowest dose that you can administer that will show you some form of efficacy response and that’s going to give you the lower bond of that therapeutic window.
And again, I’d like to point out that what we really want to do is to spend in our dose-finding studies as much time in this therapeutic window as possible. It’s fine to get data in here [the Non-toxic, Non-efficacious area], and it may be necessary to get some data in that region. We don’t want too much data in this region [the Toxic Dose area], so we really need designs that are going to help us focus our attention, focus our resources in this window.
So why does that have to be so complicated? We all understand the concept behind a randomized control trial. It’s the gold standard in establishing that there is a difference between interventions. So why can’t we use that methodology in a Phase 1 design?
Well, the answer is in some cases maybe you can, but in many cases you can’t and the reason is because of ethics.
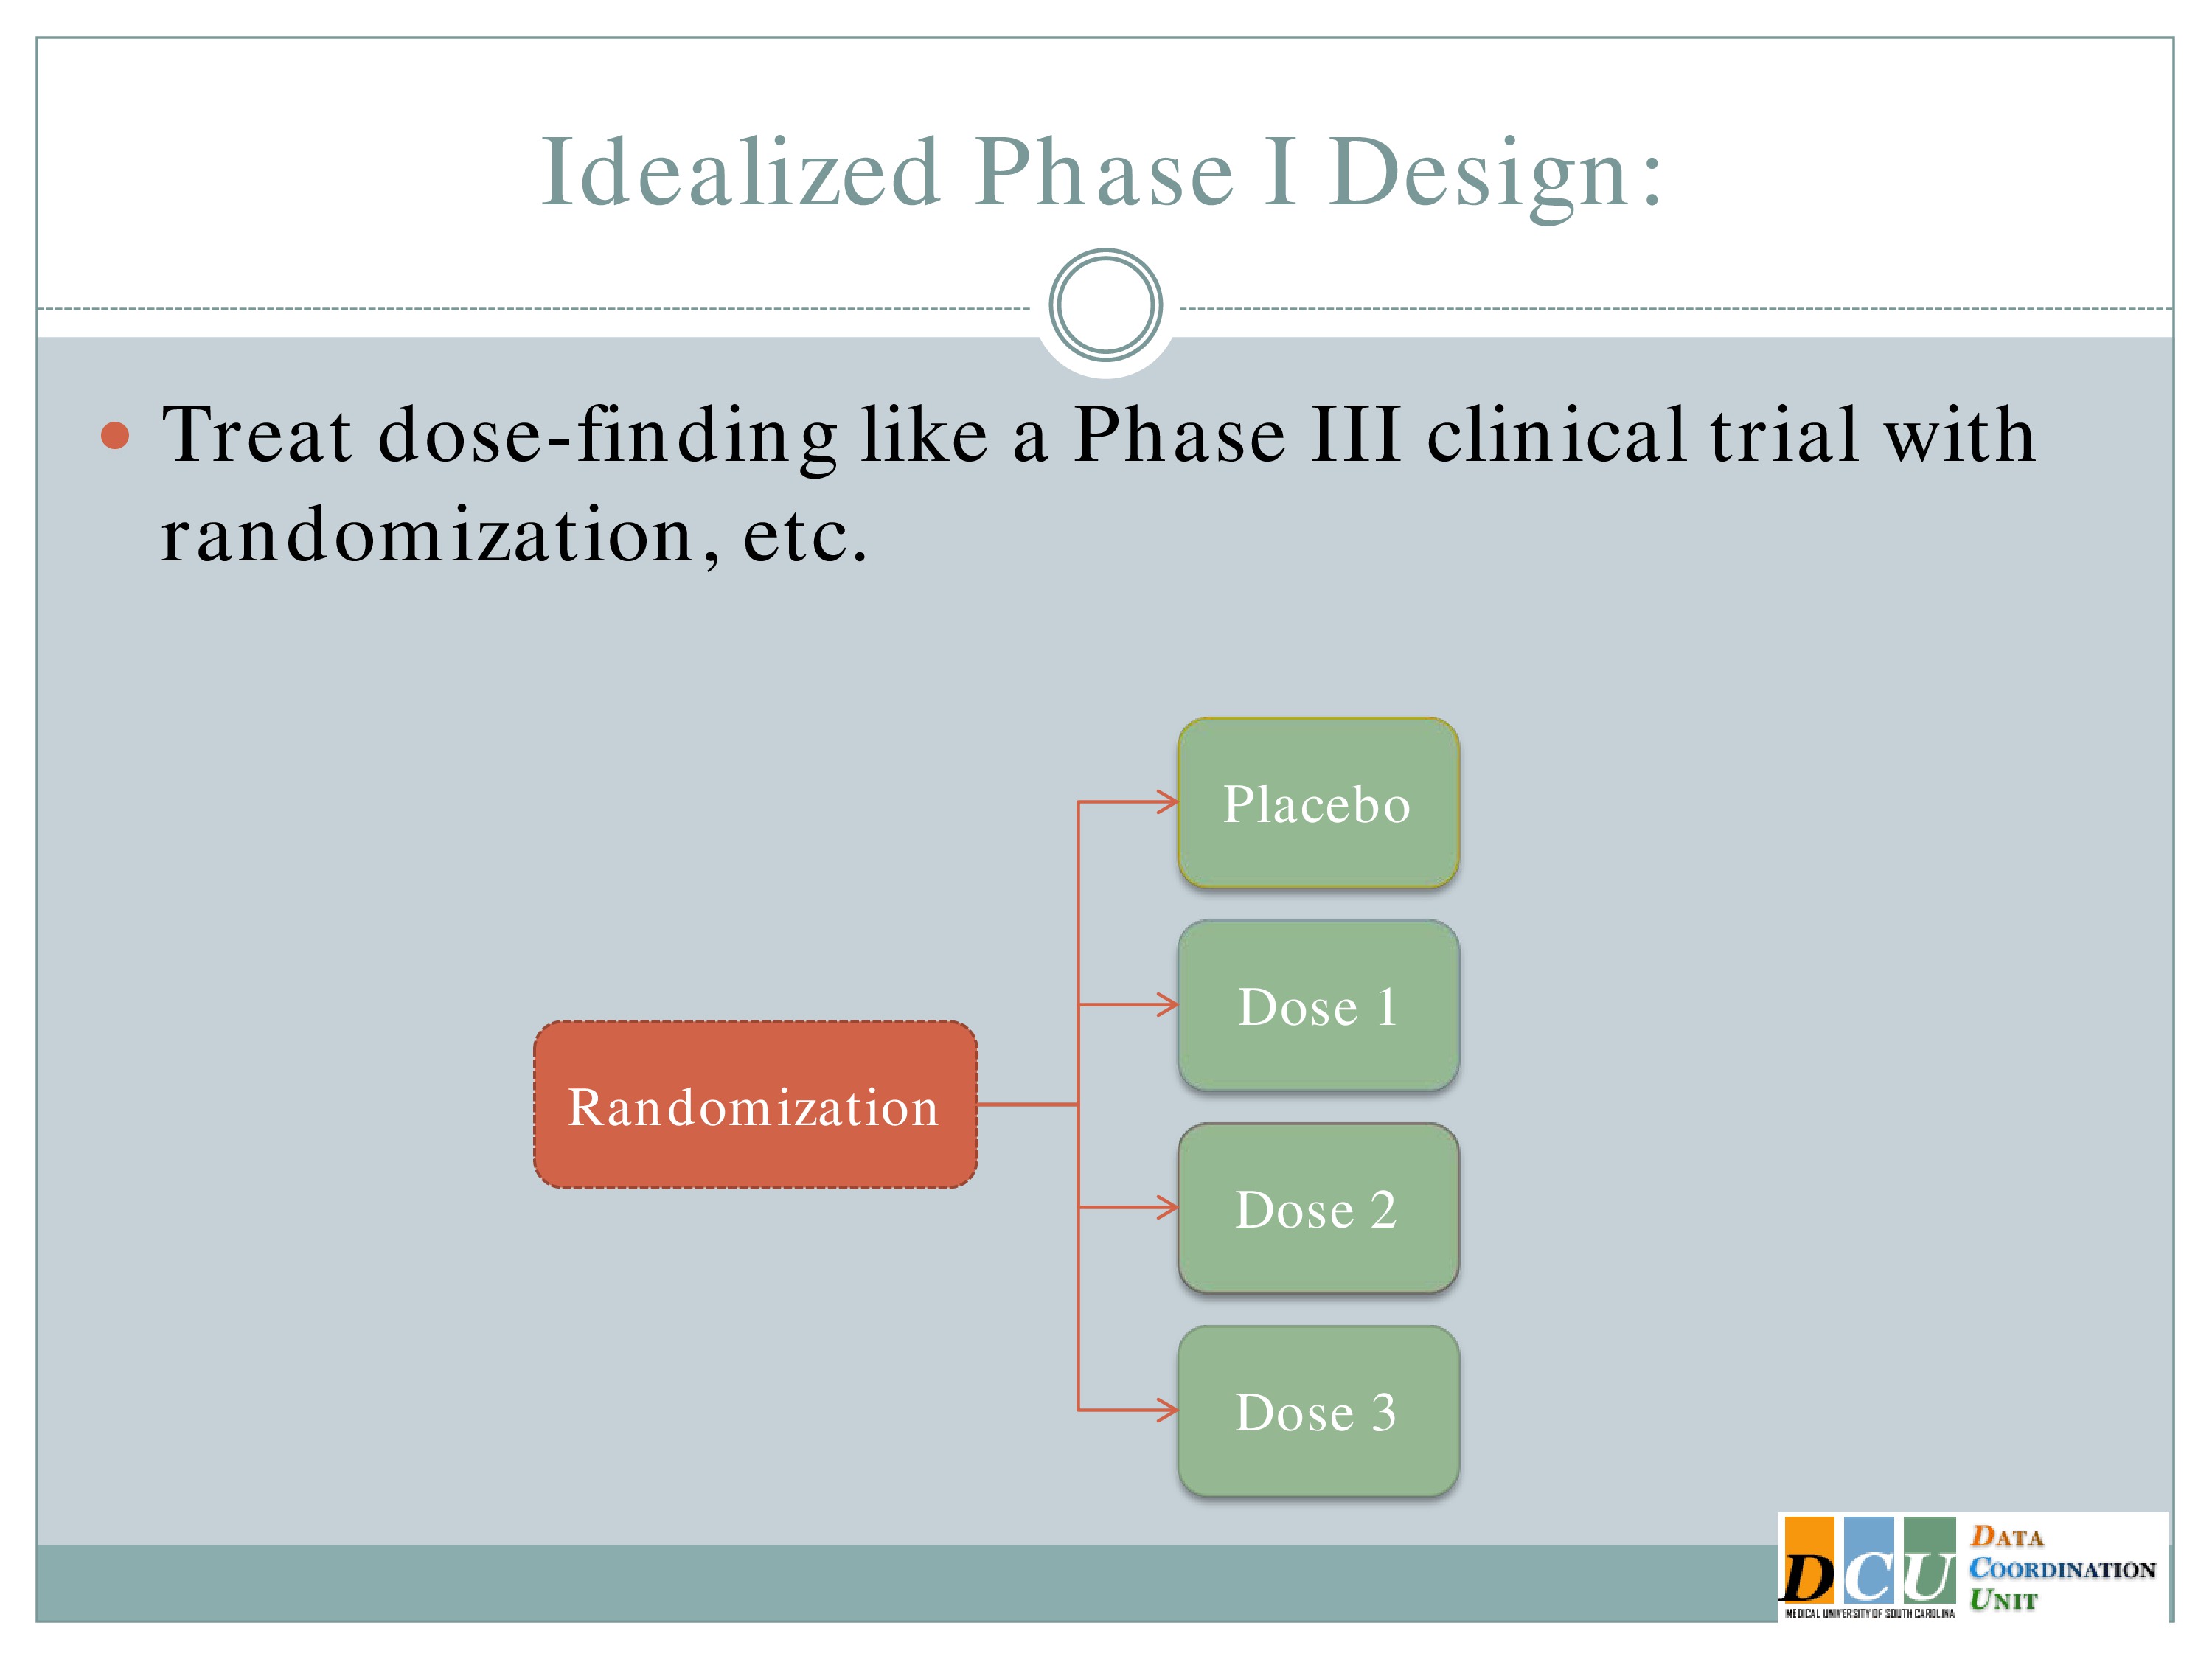
So ideally we would take our subjects as they come in and randomize them to a placebo group and one of K dose groups. But if we think, as we do in many cases, that as the dose increases, either your toxicity events or your fatigue increases as well, then you can’t ethically randomize someone to dose number 3 when you haven’t established that dose number 2 is tolerable. So this doesn’t work.
Dose-Finding Designs
But we still want to treat the dose finding in as statistically sound a manner as possible. We know we’re not going to have very many subjects to figure out what this dose is, so we need to make the best use of the information that we possibly can.
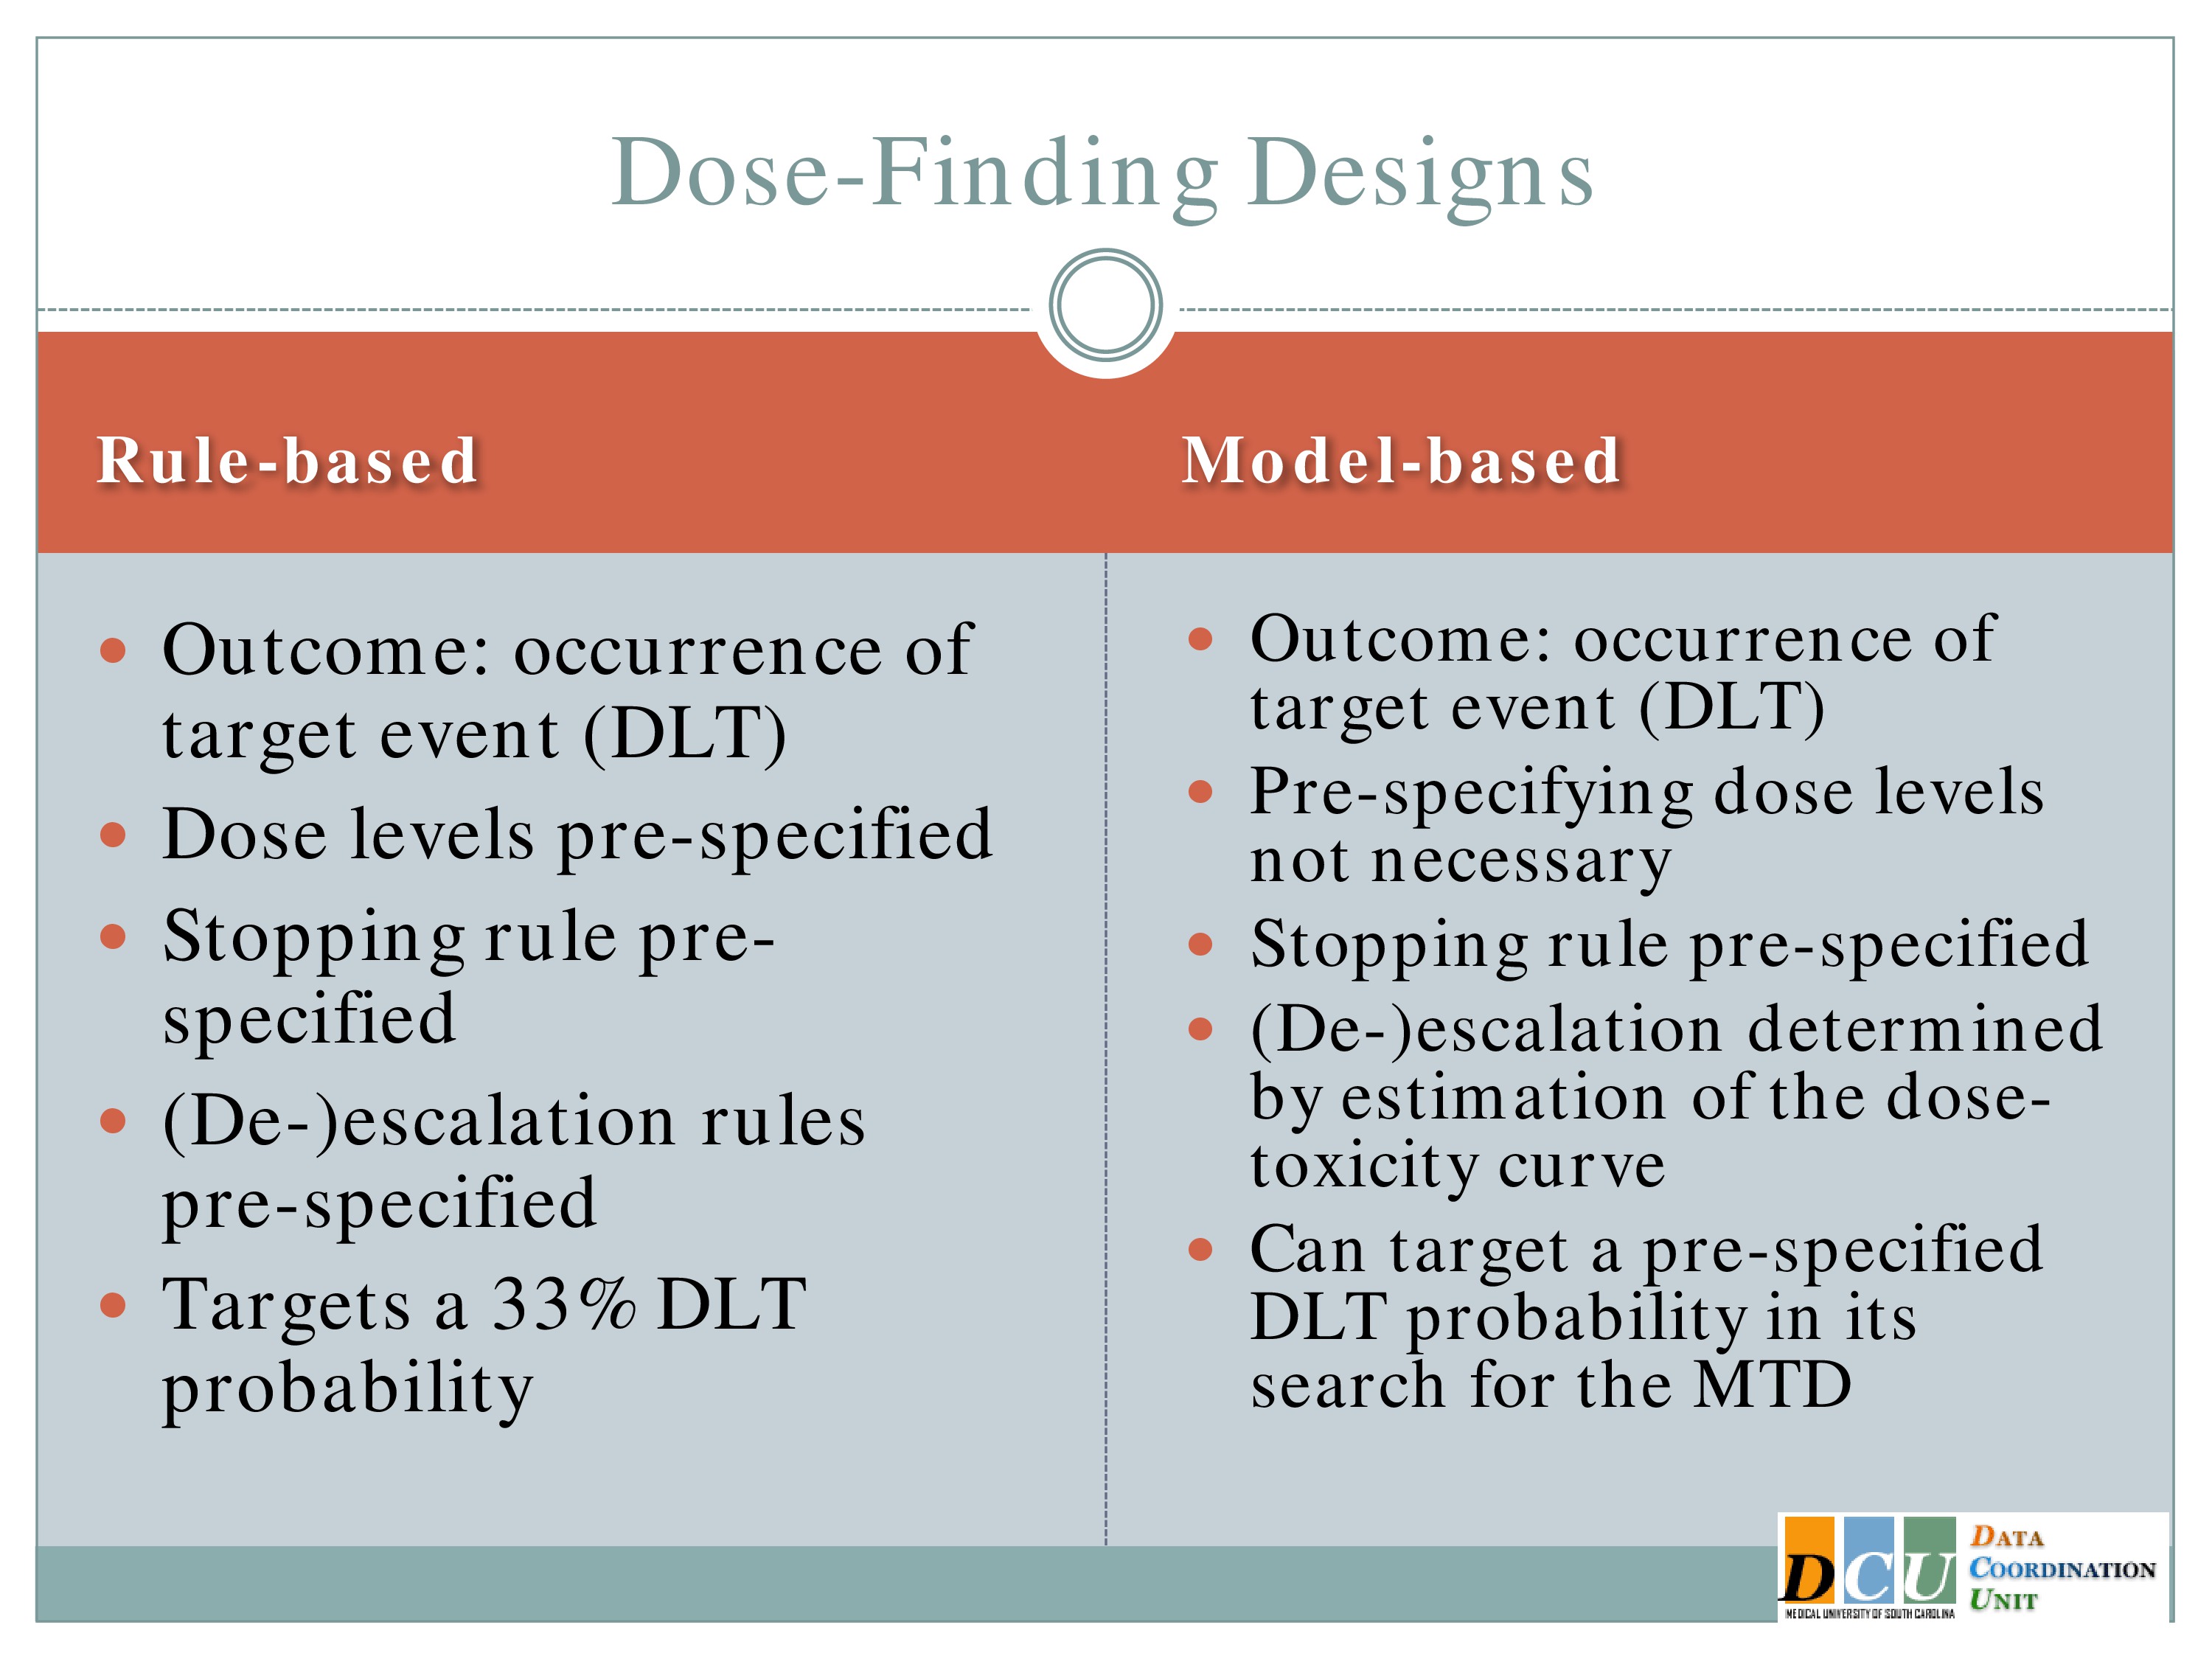
There are basically two schools of designs for dose finding. One of them I’ll refer to as rule based, and the other as model based. The rule-based, many of you might be familiar with. It’s sort of rampant in the literature, regardless of what disease area you work in, and that’s because it’s very easy to implement. In either case, the outcome is the occurrence of some target event. In many cases we refer to this as a dose-limiting toxicity, but again it doesn’t have to be a toxicity event. It could be an indication of fatigue.
The dose levels are prespecified, so the investigator starts with maybe seven dose groups where he knows I’m going to administer 7, 32, 57.
And how you escalate or de-escalate through those dose groups is predefined. I’ll show you the algorithm. It doesn’t look that easy on the page, but when I show you how it works in practice you’ll see it’s very easy to implement. You take the flow chart, as your data come in, you move through it and the trial essentially runs itself.
The stopping rule is prespecified, according to that algorithm and there are reports in the literature that say that this particular design targets a 33% rate of dose-limiting toxicities. So I’m willing to accept that up to a third of my patients will experience fatigue sufficient for them to say, I can’t do this anymore. In practice, that rate is actually a little bit less. It tends to be more in the 15 to 22% range than in the 33% range.
The model based are relatively recent developments in statistical methodology. They use the same outcome, a binary indication of whether or not a target event has occurred, but you don’t have to specify the doses. The algorithm will do that for you.
You don’t have to specify in advance how you’re going to escalate or de-escalate. Again, the algorithm will do that for you. You will specify a stopping rule, and the really nice feature of this is you can change that target probability that you’re willing to accept. So if 33% fatigue is too high, you can say, no, I’d rather do 20, or it’s not high enough, I’d rather do 50. And you can specify that in the model and the algorithm just responds.
Rule-Based: 3 + 3 Designs
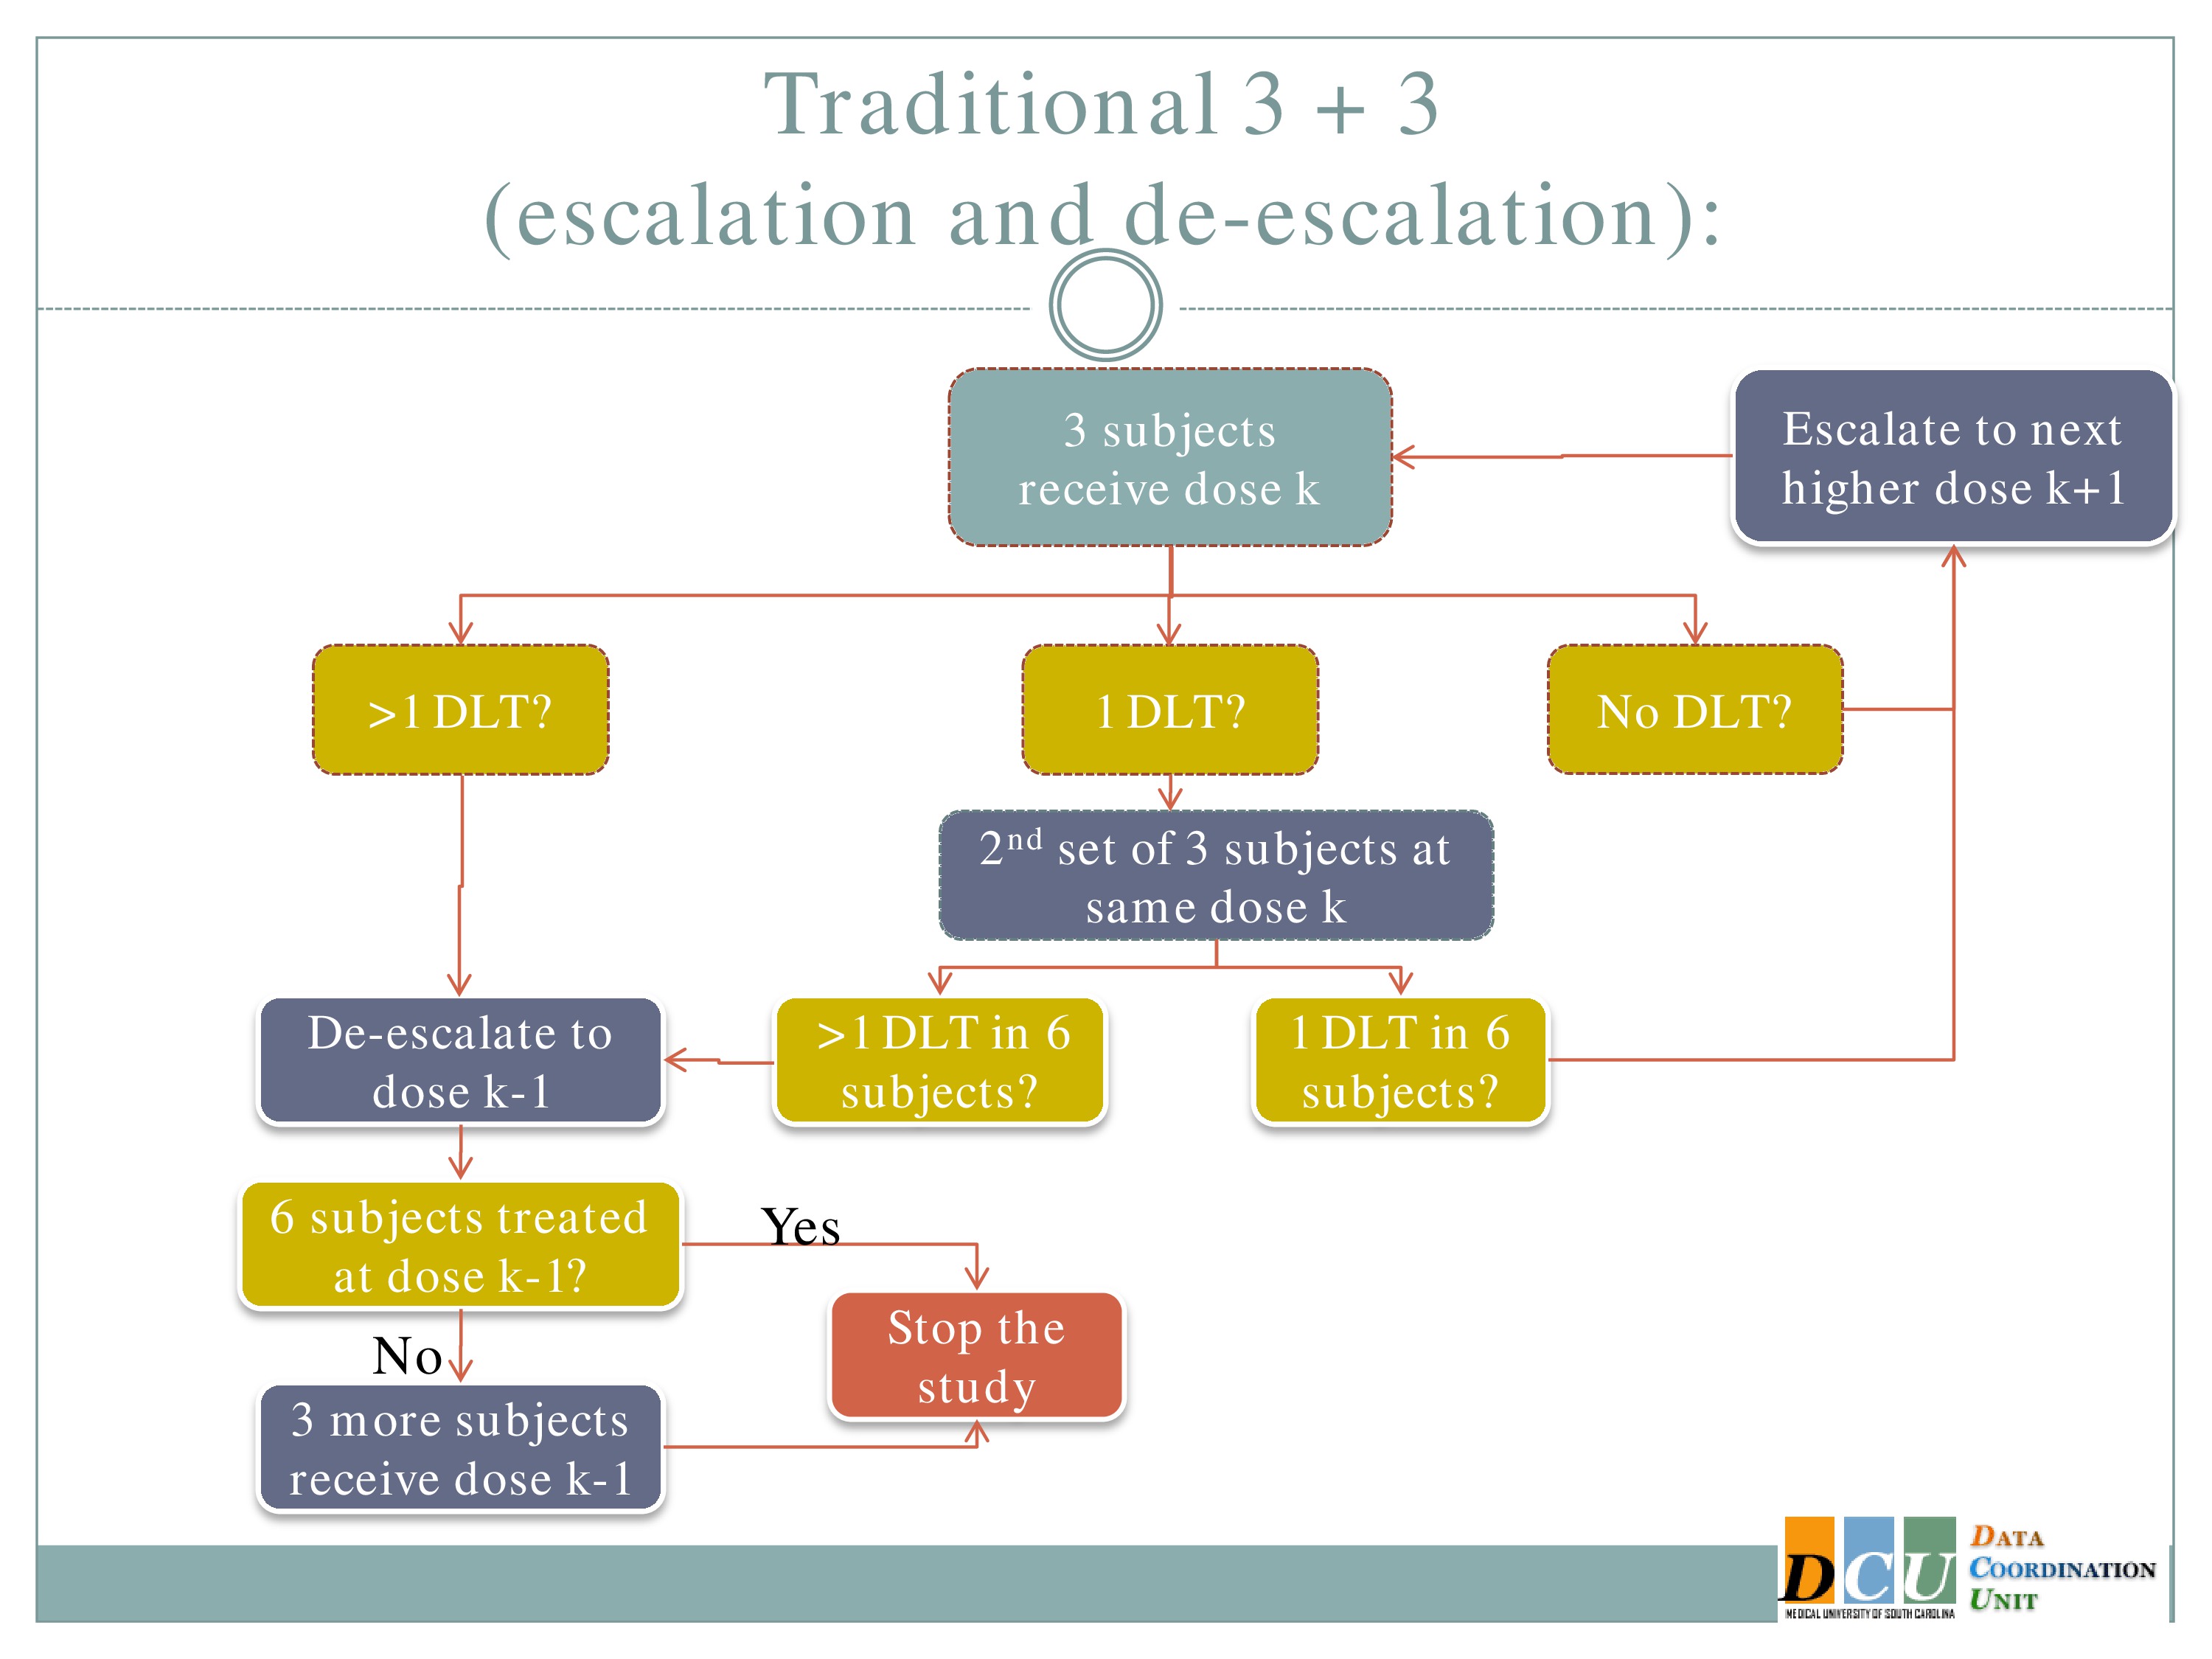
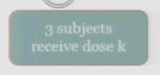
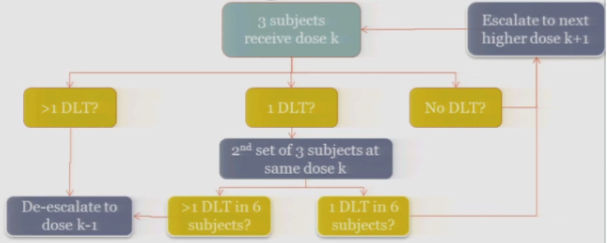
So the rule-based design that is most common is the 3+3. The flow chart is really not that bad, but just on paper without actual patients it can seem a little complicated.
So you start by treating three subjects at a particular dose.
And hopefully none of those subjects experience your target event, and if that’s the case, then you are allowed to escalate to the next higher dose, whatever that may be.
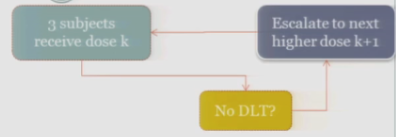
If one of those initial three subjects experiences a target event, then the algorithm says, okay, now we’ve seen something, we have to be a little bit concerned about what’s happening at this dose, so I’m going to enroll another three subjects to get a better handle on what’s happening.
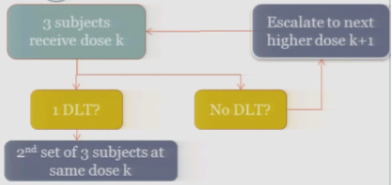
If you observe no toxic events in that second cohort, so you have one out of only six subjects, then the algorithm says, okay, you’re less than the 33%, you can increase.
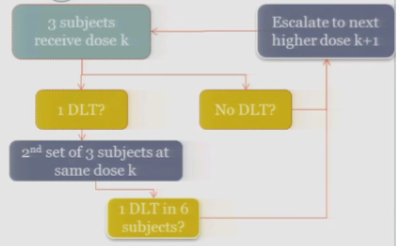
At any point, if you experience more than one DLT out of your treated subjects at a given dose, you de-escalate.
Once six subjects have been treated at the previous dose —
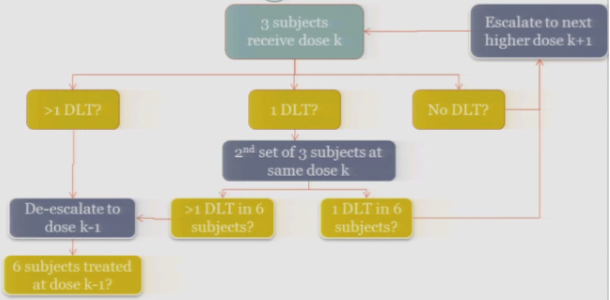
The study stops.
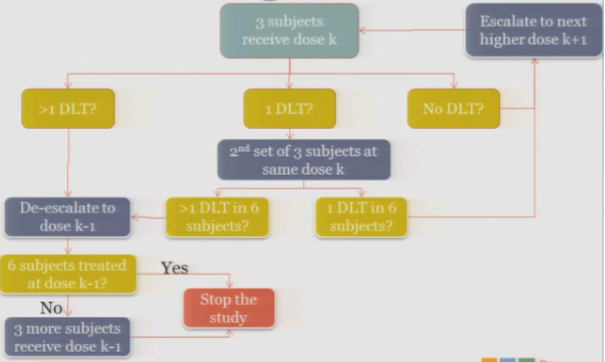
So again, on paper it’s a little complicated. We’re going to run through how this works in practice so you can see.
Simulated Trial
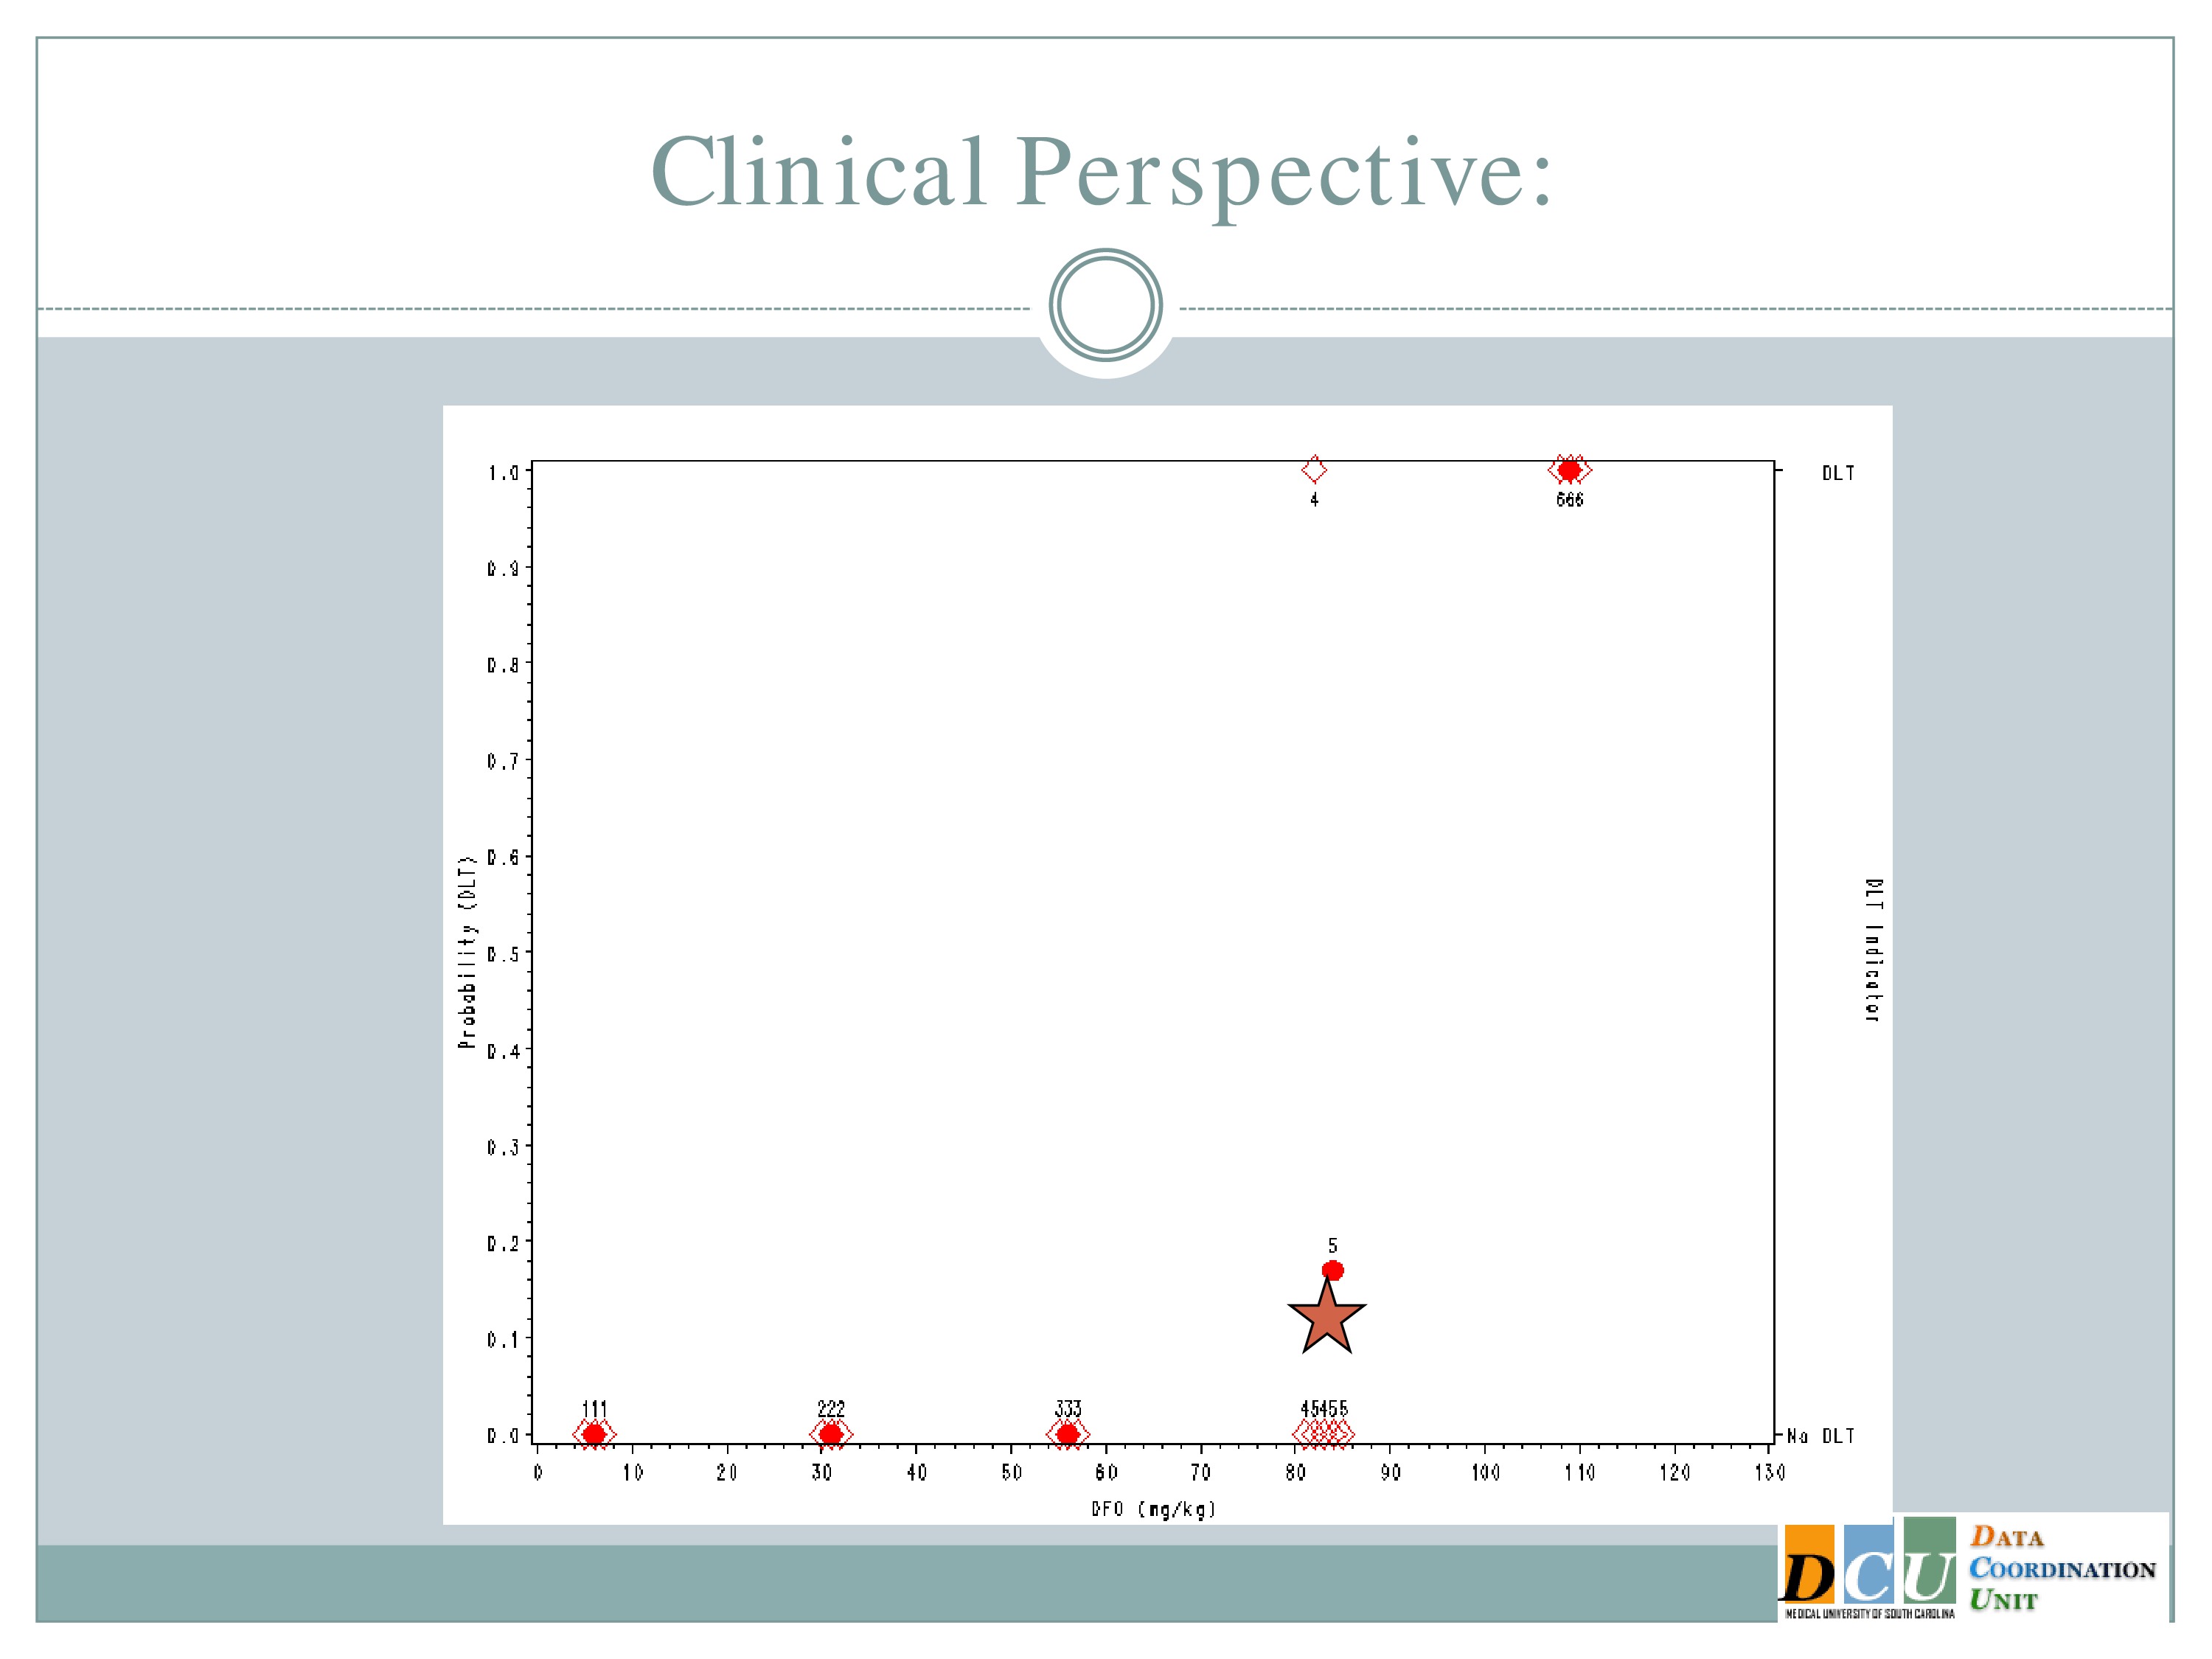
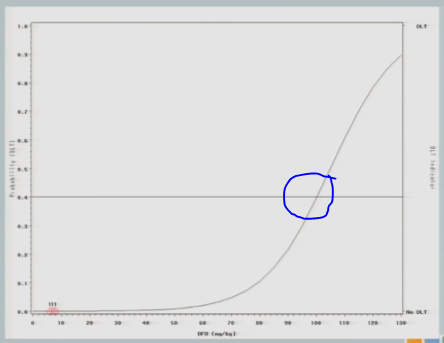
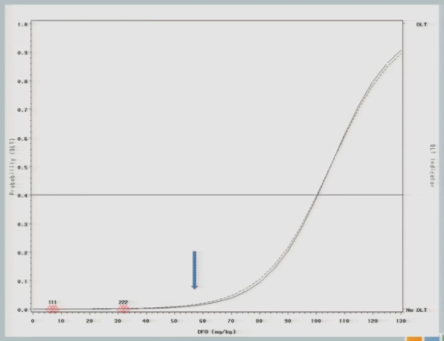
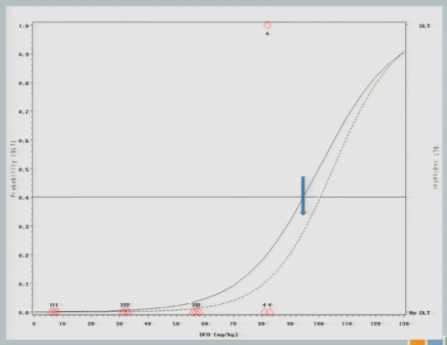
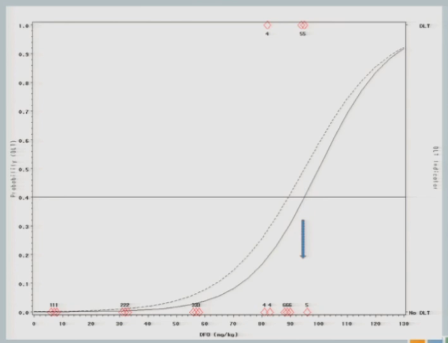
This is a simulated trial — I do apologize for that — that was put together when we were proposing to do one of the model-based designs in an ICH population. So along the x-axis is the dose of deferioxamine that we were planning to administer and along the y-axis the probability of a dose-limiting toxicity.
On the right-hand side, the bottom means no DLT was observed by a given subject, the top means we did observe a toxicity event.
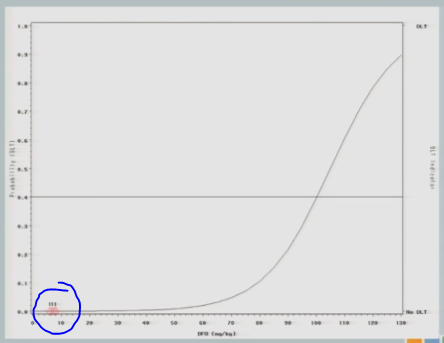
So we specified in advance that we would start treating subjects at 7 milligrams per kilogram and increase in units of 25.
So we treated the first cohort of subjects at 7 milligrams per kilogram, 3 subjects treated, no target events were observed.
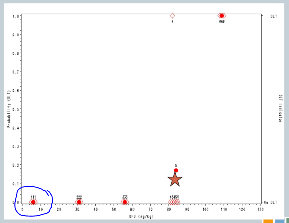
So we increased to 32. We treat another three subjects, no target events are observed.
So we increase to 57. We treat another three subjects, no target events are observed.
We increase to 82. Now, here’s where it gets interesting. At 82, our fourth cohort, one subject experienced a target event, so the algorithm says, okay, now we need to slow down. I need three more subjects in order to understand what’s happening.
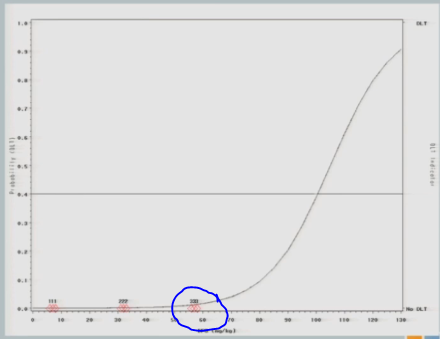
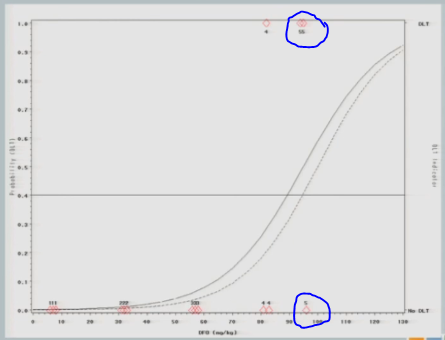
So we enroll another cohort of subjects at the same dose. That’s our fifth cohort, and none of those subjects experience target events, so the algorithm says, you’re good, you can escalate.
So now our sixth cohort of subjects is treated at 107, and all three of them experience target events. So now the algorithm says, you’ve overshot the mark, you need to come down to the previous dose.
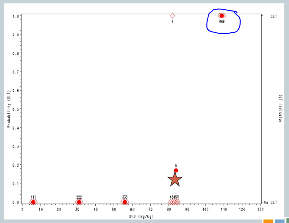
But we’ve treated six subjects at that dose, so the trial is done, and this 82 milligrams per kilogram would be our recommended maximum tolerated dose for future study.
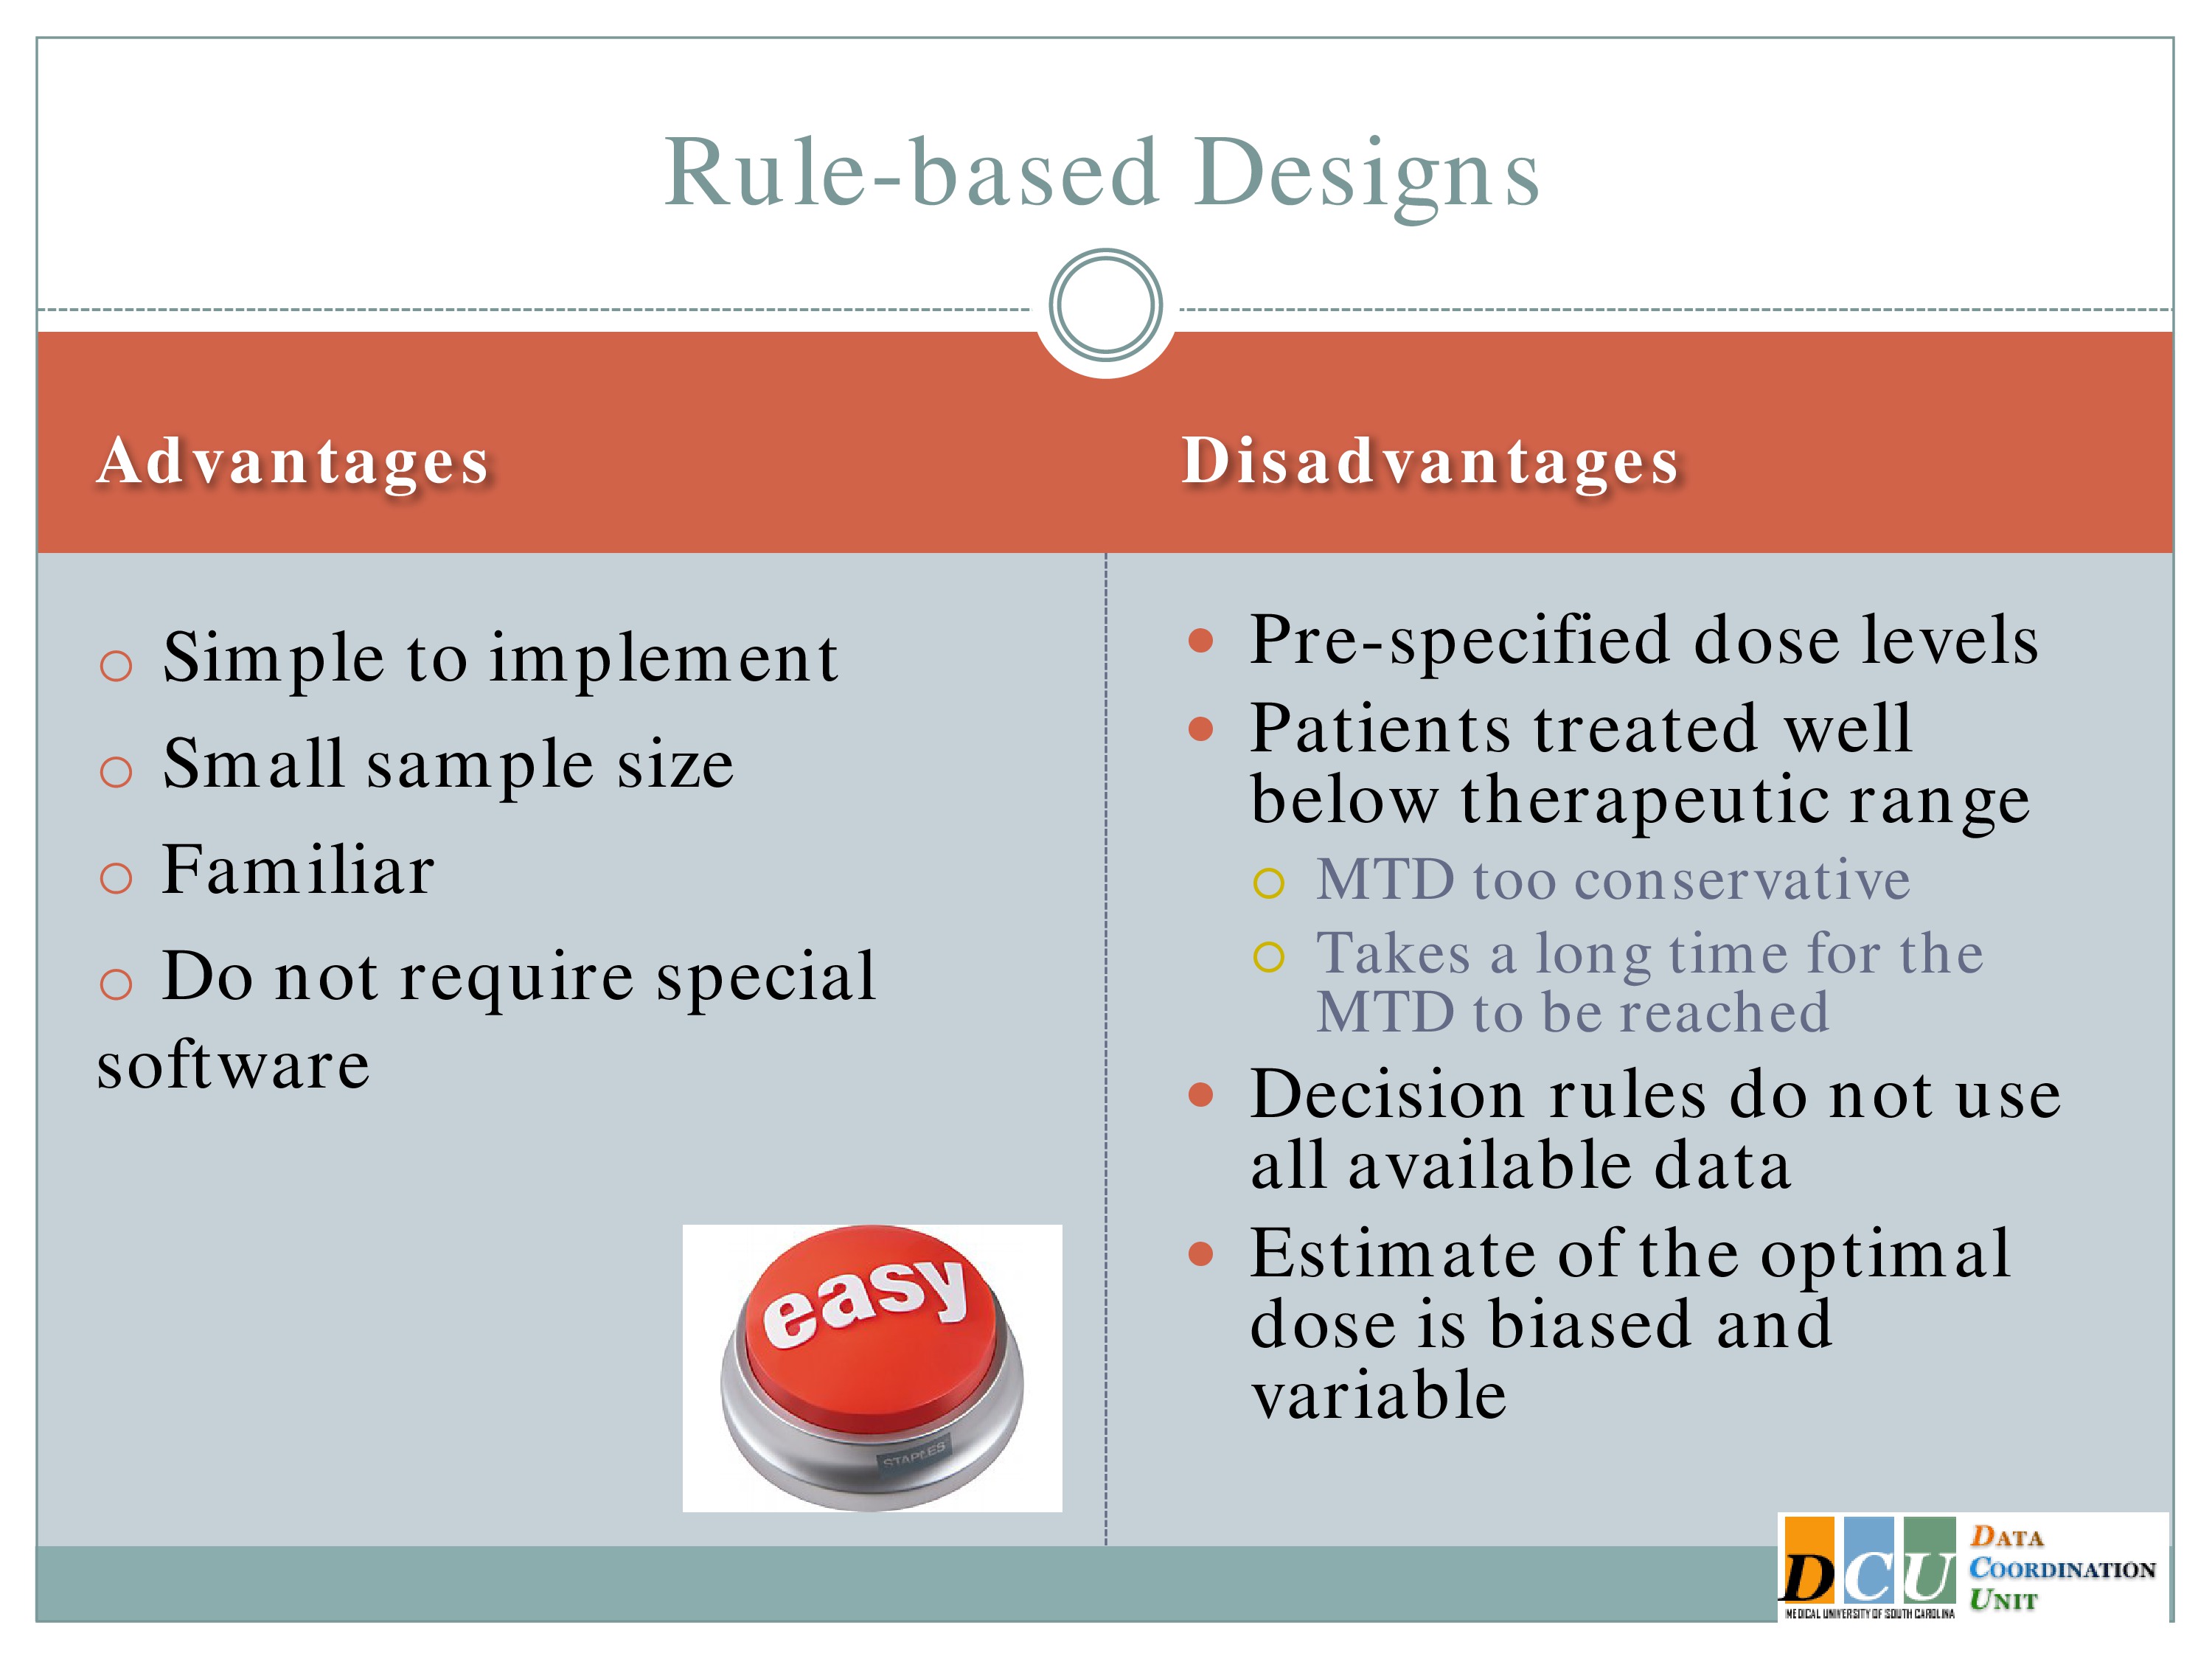
So these rule-based designs do have some advantages.
In practice, it’s actually very easy to implement. As I said, the trial would basically run itself with the use of that flow chart, but I’m hoping that you can already start to think about some of the problems that are associated with this design.
So first of all, what if I missed the dose? I have to prespecify these doses, and so the clinician and I, when he sat down, he said, well, let’s start at 7 and up by 25, because that seems reasonable. But what if the true dose I want to hit is at 70? I’m never going to get there. I can either underestimate it or overestimate it, but I’m almost guaranteed to do one or the other. I’m never going to hit it exactly.
The other issue is that we jump by the same increment regardless of what we’ve observed. Again, it might have been different if I’d specified another dose in the middle, but I didn’t. The algorithm doesn’t take into account the fact that now that we’ve started to see something happening, maybe we should move just a little bit more slowly.
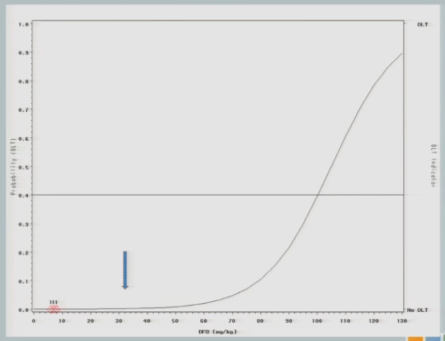
Rule-based designs often have patients who were treated well below the therapeutic range. As you can see in this graph, it took us nine subjects to get to any point of activity of the agent, which in particularly rare diseases, may not be a very good use of the patients that you do have access to.
The decision rules don’t make use of all the available data. When you’re deciding to escalate or de-escalate, you consider only what happened at the dose you’re currently administering. And that’s a real problem.
And the estimate of the optimal dose is biased, and it’s variable. It has no choice but to be, because it’s based on only three subjects, maybe six at any given dose.
Operating Characteristics
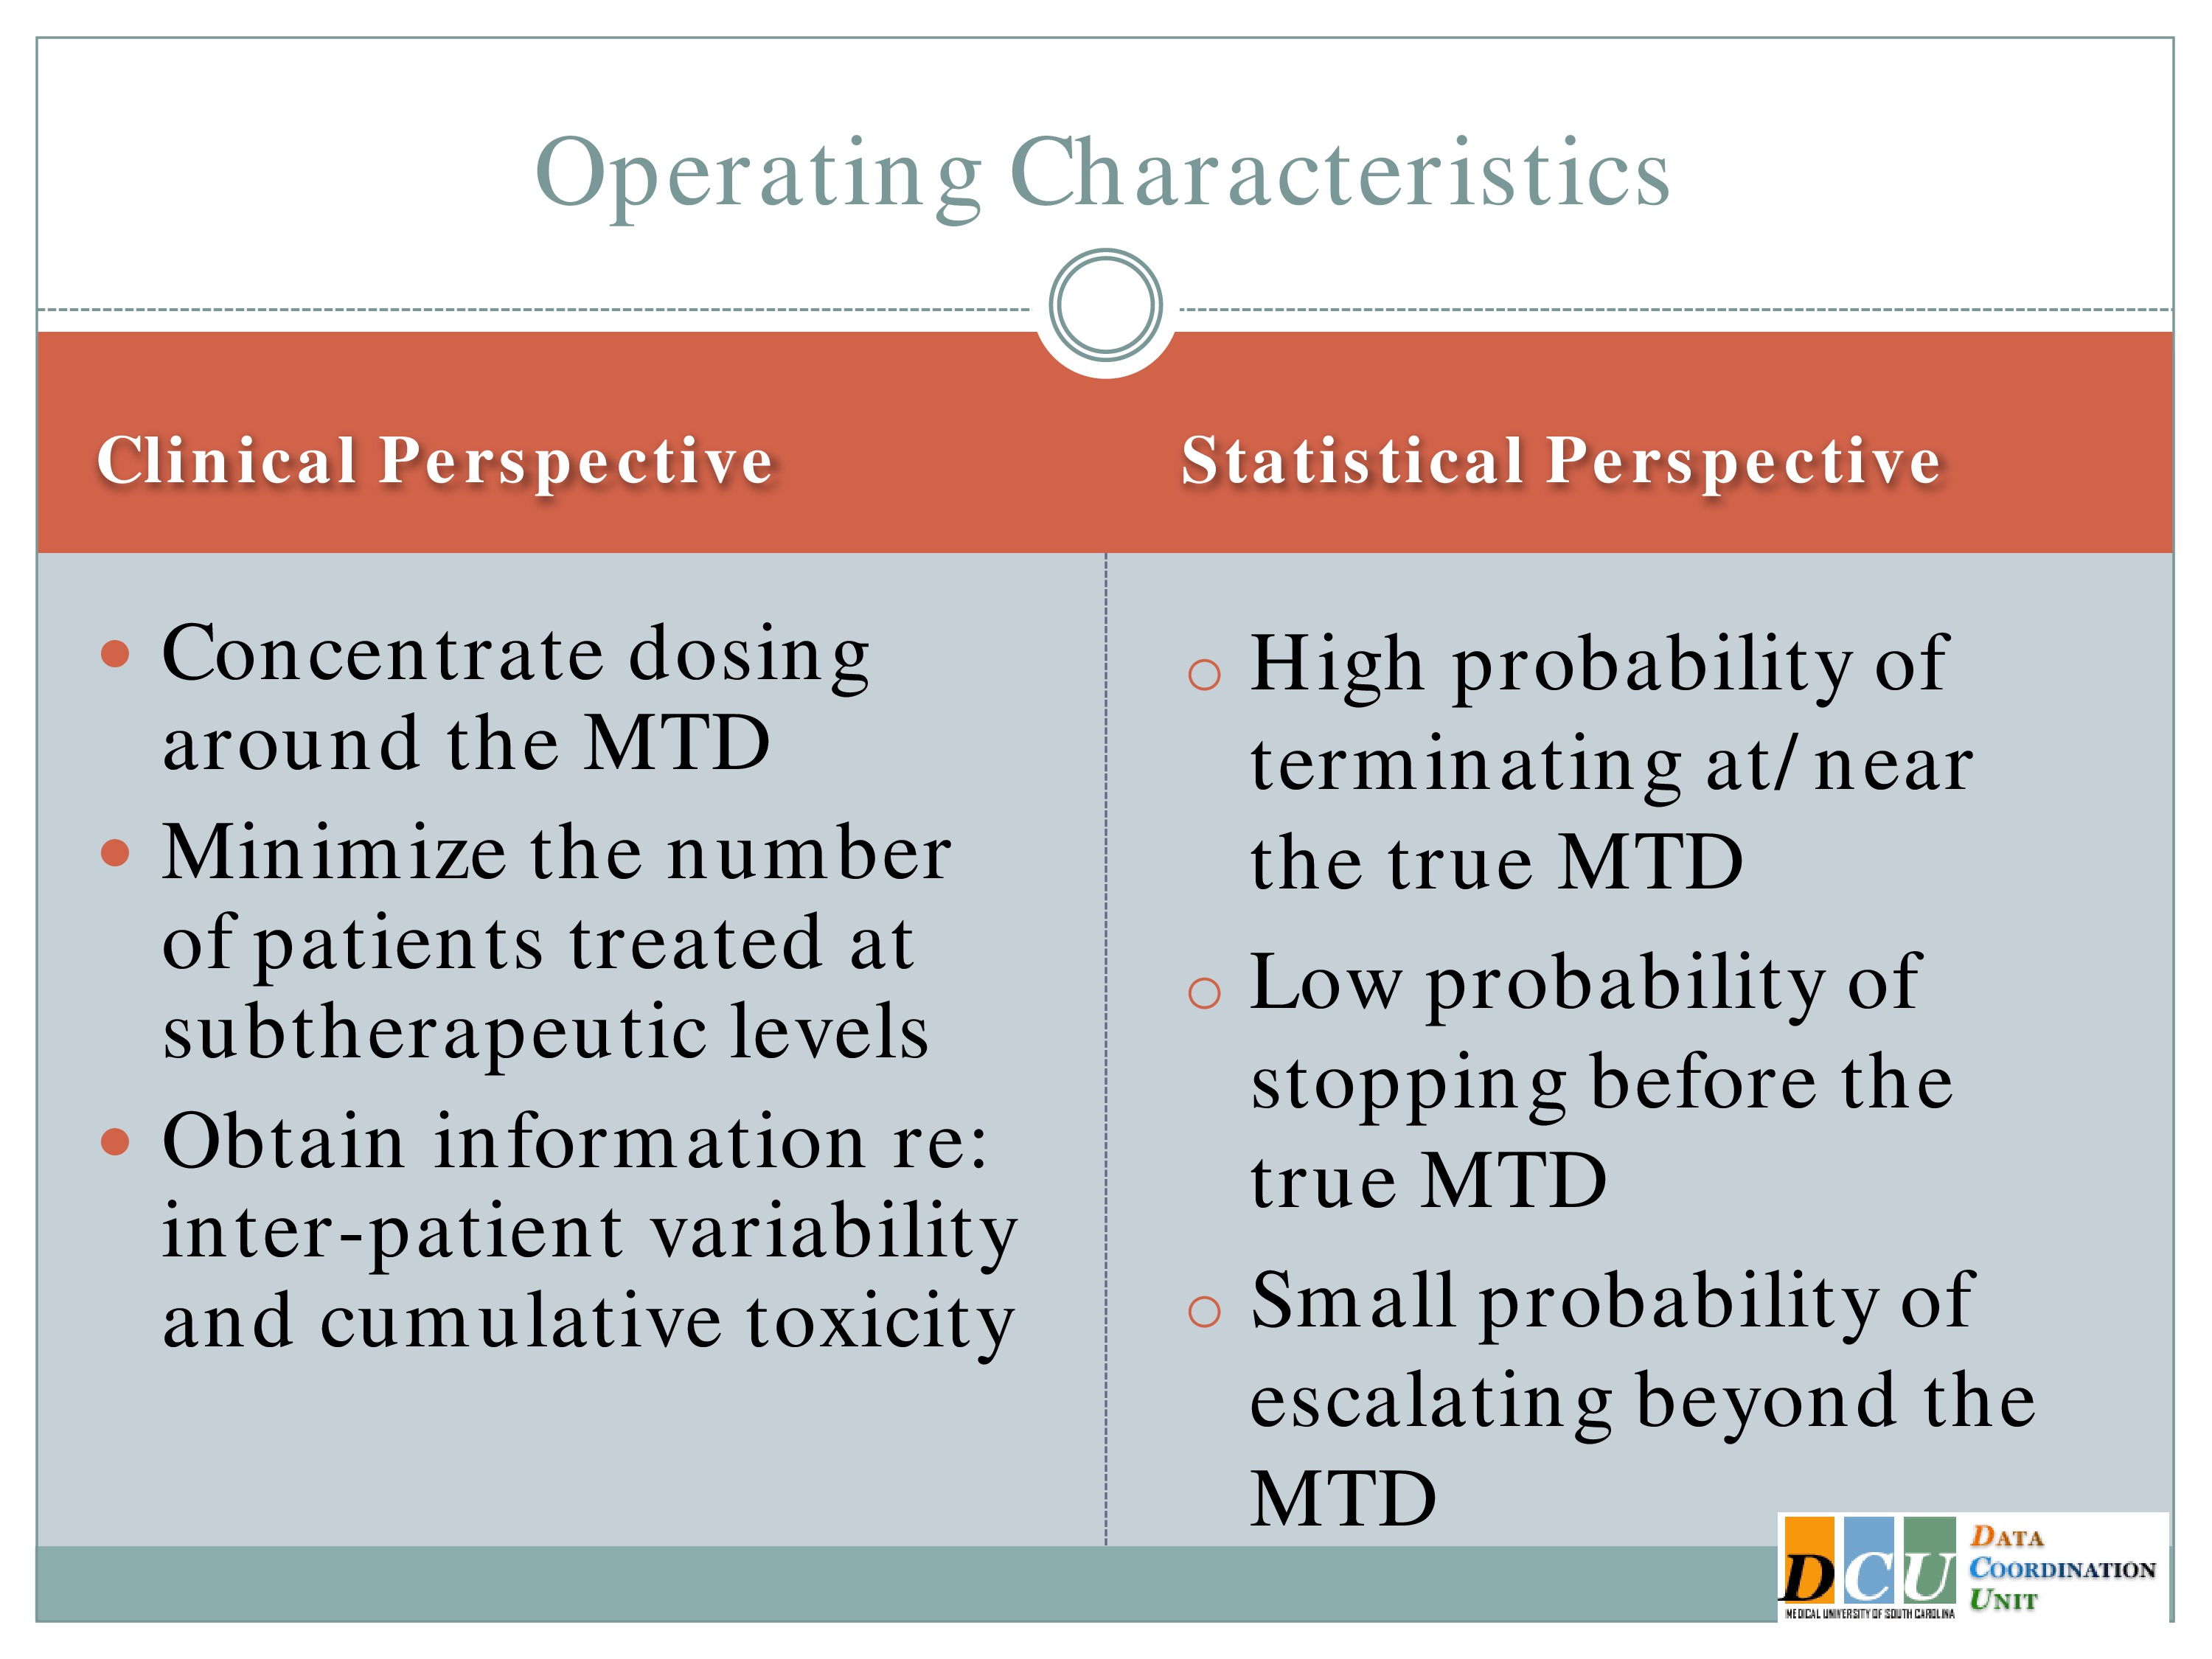
So if we wanted to refine this design, what would we want the design to look like? What characteristics would we want it to have?
From a clinical perspective, we would want to pay attention to doses around the Maximum Tolerated Dose. We don’t want to spend too much time in that subtherapeutic area, we don’t want to spend too much time in the overly toxic area.
By extension we want to minimize how many patients we’re treating at subtherapeutic levels. So keep in mind that this was developed in cancer and in Phase 1 cancer studies, these are usually folks who are basically at the end of their rope. They tried everything else that is available to them, and this is their only option. So we really don’t want to have too many of them treated in doses where we know they’re not getting any efficacy at all.
But we need to obtain information on interpatient variability and cumulative toxicity.
Statistically, we wanted to have a high probability of terminating at the correct dose, or at least near the correct dose. We wanted to have a low probability of stopping before the truth, and a small probability of escalating beyond the truth.
Model-Based Designs: Continual Reassessment Method
And so the statistical answer to that is the continual reassessment method. This was proposed — I’m not sure, maybe 20 years ago — by O’Quigley, and there have been a ton of papers extending it making variations on it, improving upon it in the last couple of decades.
The continual reassessment method allows you to use all of your data and adapt to that data as you accumulate it.
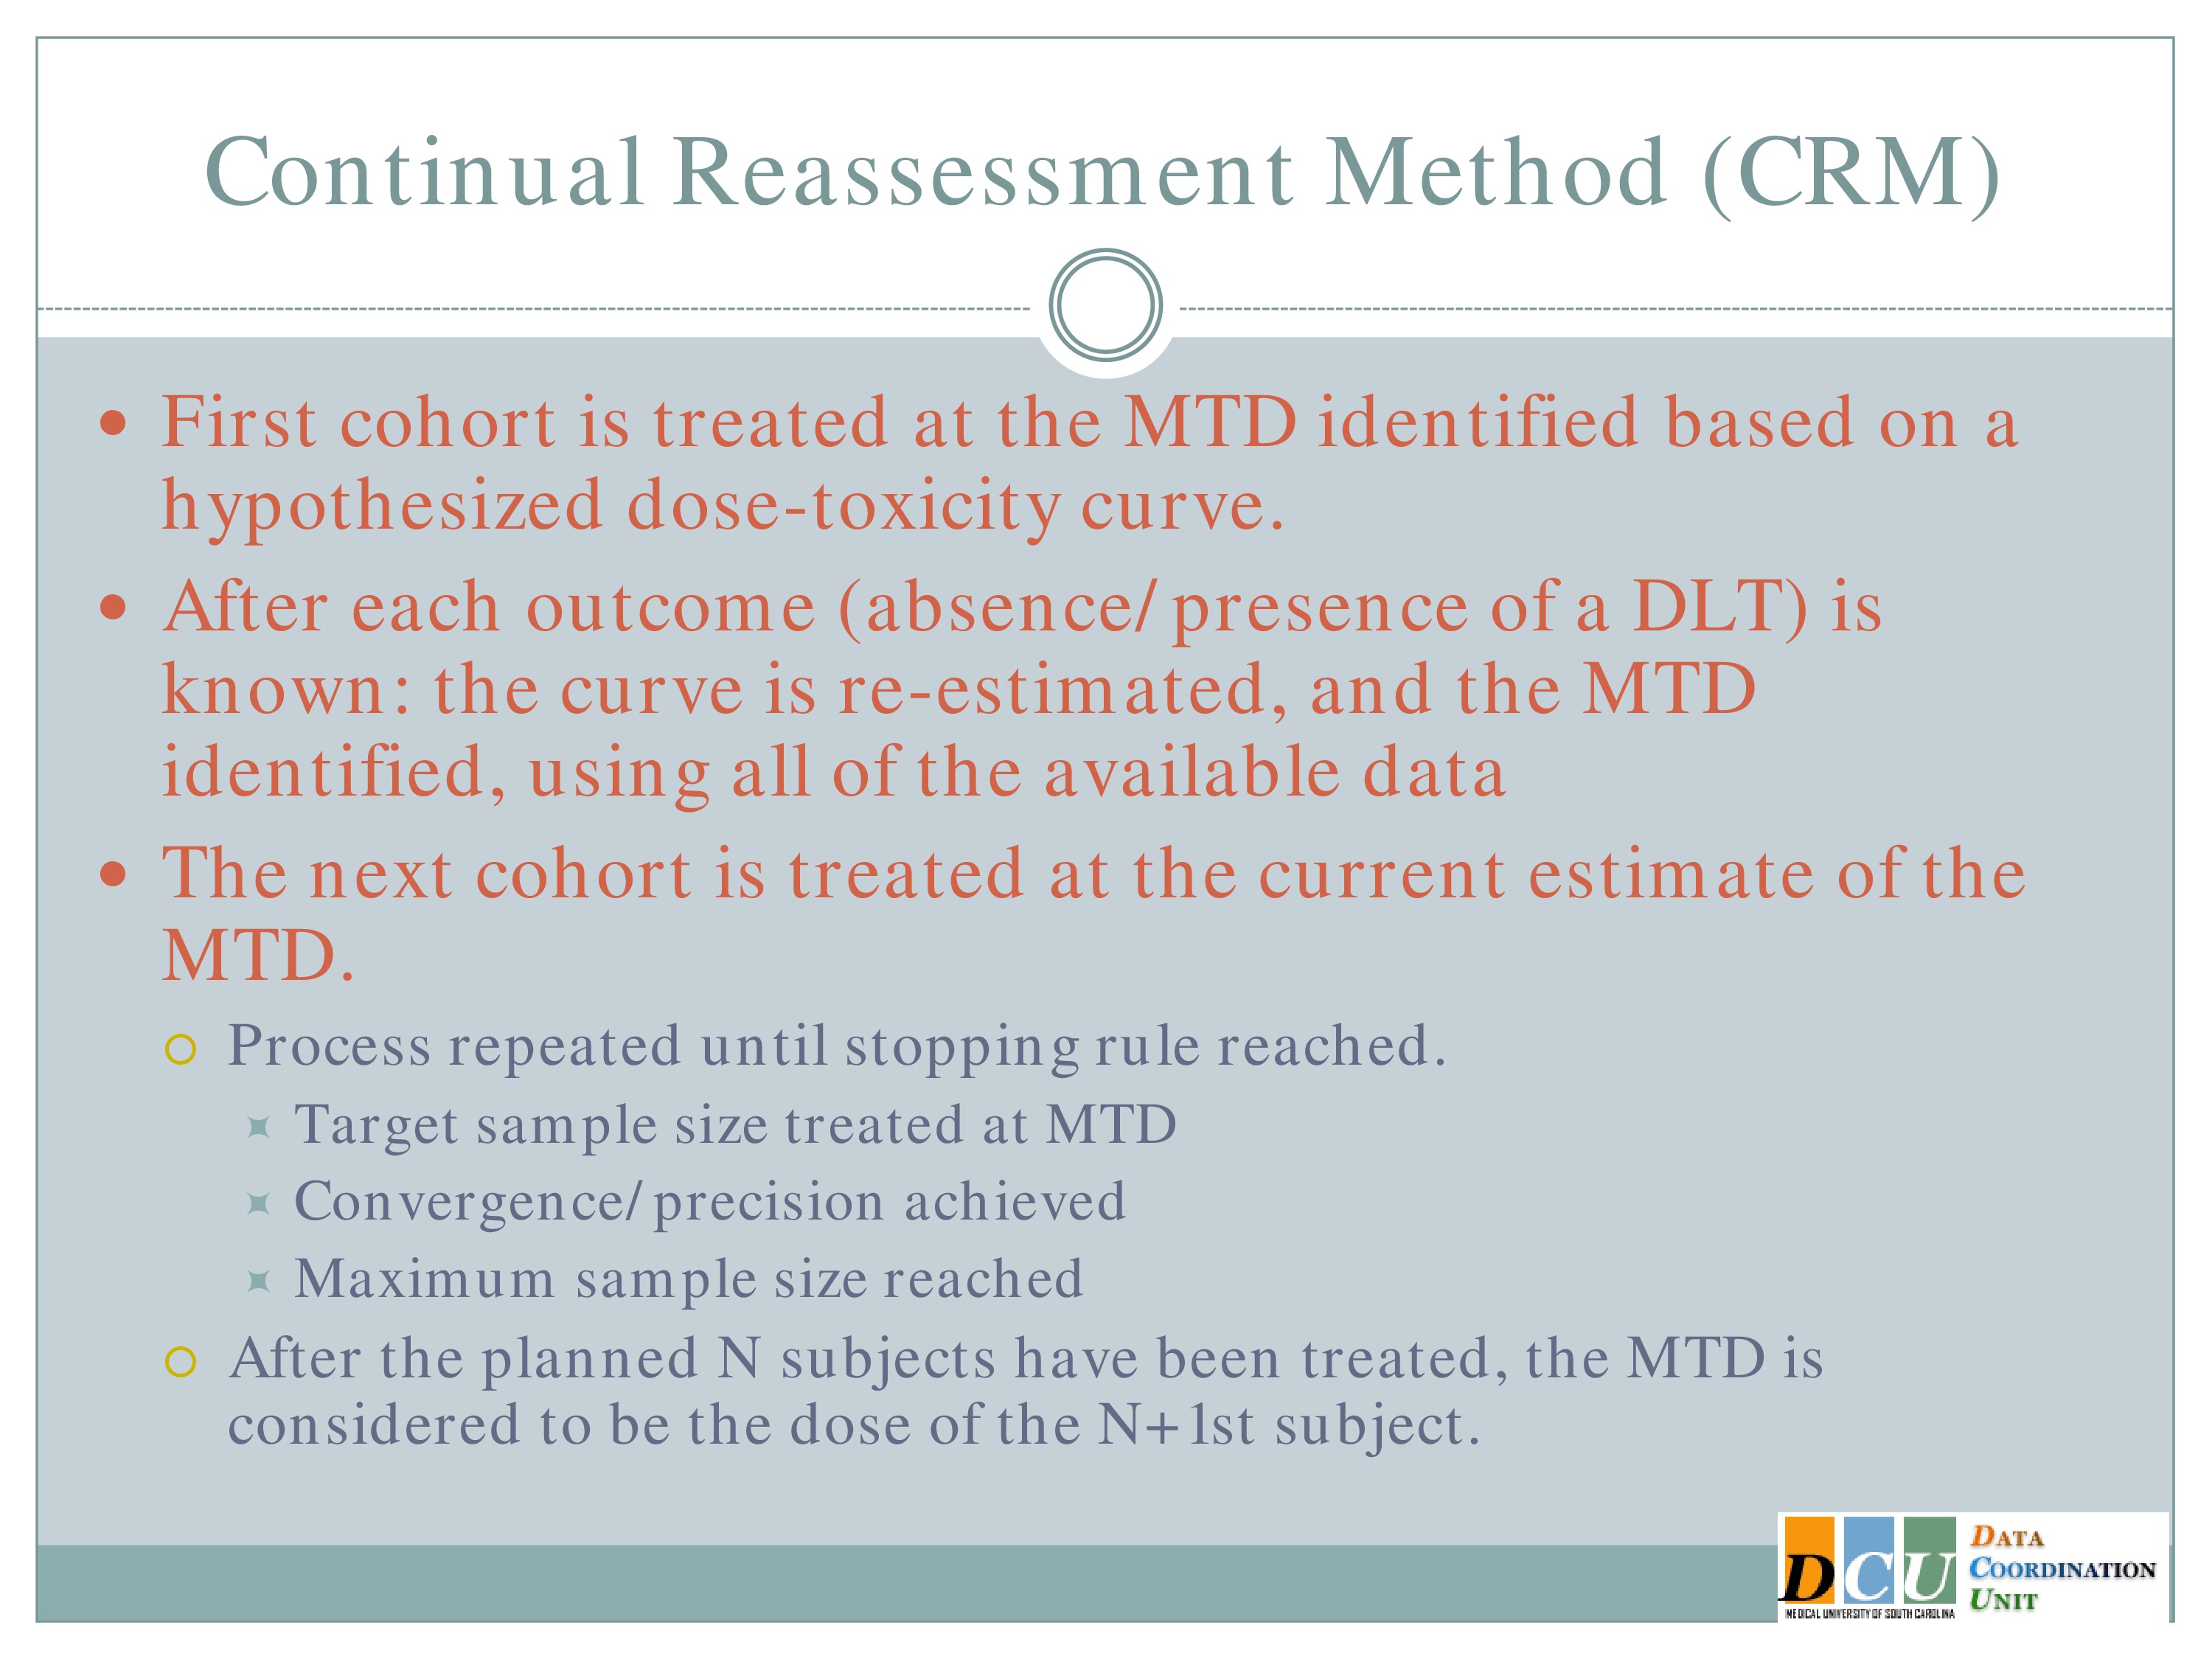
So the idea again, when I show you how the design works in an assimilated trial, I think it will be a little bit more clear — the first cohort is treated at the maximum tolerated dose that’s identified based on some hypothesized curve.
So when we sat down to implement this study in ICH, the clinician and I sat down, and he said, “I think I can make it all the way up to here before anything happens, and then I think I’m going to max it at about here.” And we played with some curves until he said, “I think it’s that one.” And we said, “Okay, now, this is where we’ll start.”
So you treat three subjects at the Maximum Tolerated Dose that you hypothesized based on that curve, you observe the outcome for those subjects, re-estimate the curve using all of the data, both your hypothesis from the beginning and the data you’ve just accumulated, re-identify the Maximum Tolerated Dose, and that next cohort of subjects is going to be treated then at the new estimate of the Maximum Tolerated Dose.
So with each new cohort of subjects, you’re treating them at your best guess of the Maximum Tolerated Dose, which is a nice feature if you believe that the Maximum Tolerated Dose is really going to be your best bet in terms of efficacy.
And you keep repeating this process until some stopping rule is achieved. That stopping rule can be based either on the target sample size having been enrolled and treated at the Maximum Tolerated Dose, until the maximum sample size for the study overall has been met, or until you’ve achieved some level of convergence or precision.
And once the trial ends, the Maximum Tolerated Dose is considered to be the dose that you would have assigned to the next subject to be enrolled. Again, I think this will be a lot easier once I show you an example.
Variations
I’m not above saying that it had some issues when this design was initially proposed. A number of the clinical folks came back and said, “Whoa, whoa, whoa. One, we’re going to treat one subject at each dose? That’s ridiculous, no way, not going to happen.”
They also said if you don’t restrict how you move through that dose space, my hypothesis may be way wrong, and the first cohort of subjects is treated at maybe three times the true Maximum Tolerated Dose, and now I have to wait to come back into the correct dose space.
So there have been a number of variations which were put forth to improve on these, to make the design more palatable to the clinical collaborators. Probably the most widely known of which is to treat a small cohort, so instead of treating one, we treat three subjects at each dose. It’s not a magic number, it’s sort of like .05. It’s just a number. We treat three subjects at each dose, and we can restrict the escalation process so that it doesn’t move too quickly.
And there are a number of ways that you can do that. You can do that by choosing to treat your first cohort of subjects at some low dose based on conventional criteria and not what you think the Maximum Tolerated Dose is.
You can restrict the escalation by specifying that the dose is not going to be governed by the model until you’ve actually observed some toxicity in your patients. The idea behind that is you need to see some patient variability before you can trust that the model is doing what it ought to do.
And you can also restrict escalation by specifying the doses in advance and saying, I’m not going to skip over any dose that I haven’t already tried.
But all of these modifications are going to impact the statistical operating characteristics a bit. Right, so if you restrict the escalation, you’re not going to get to the Maximum Tolerated Dose as quickly as you would have otherwise, so we need to keep those things in mind.
Another popular variation is the continual reassessment method with an expansion cohort, which says that once I’ve identified what that Maximum Tolerated Dose is I’m going to enroll another 6 to 15 subjects in order to gain some additional safety data at that dose as well as to gain some efficacy information.
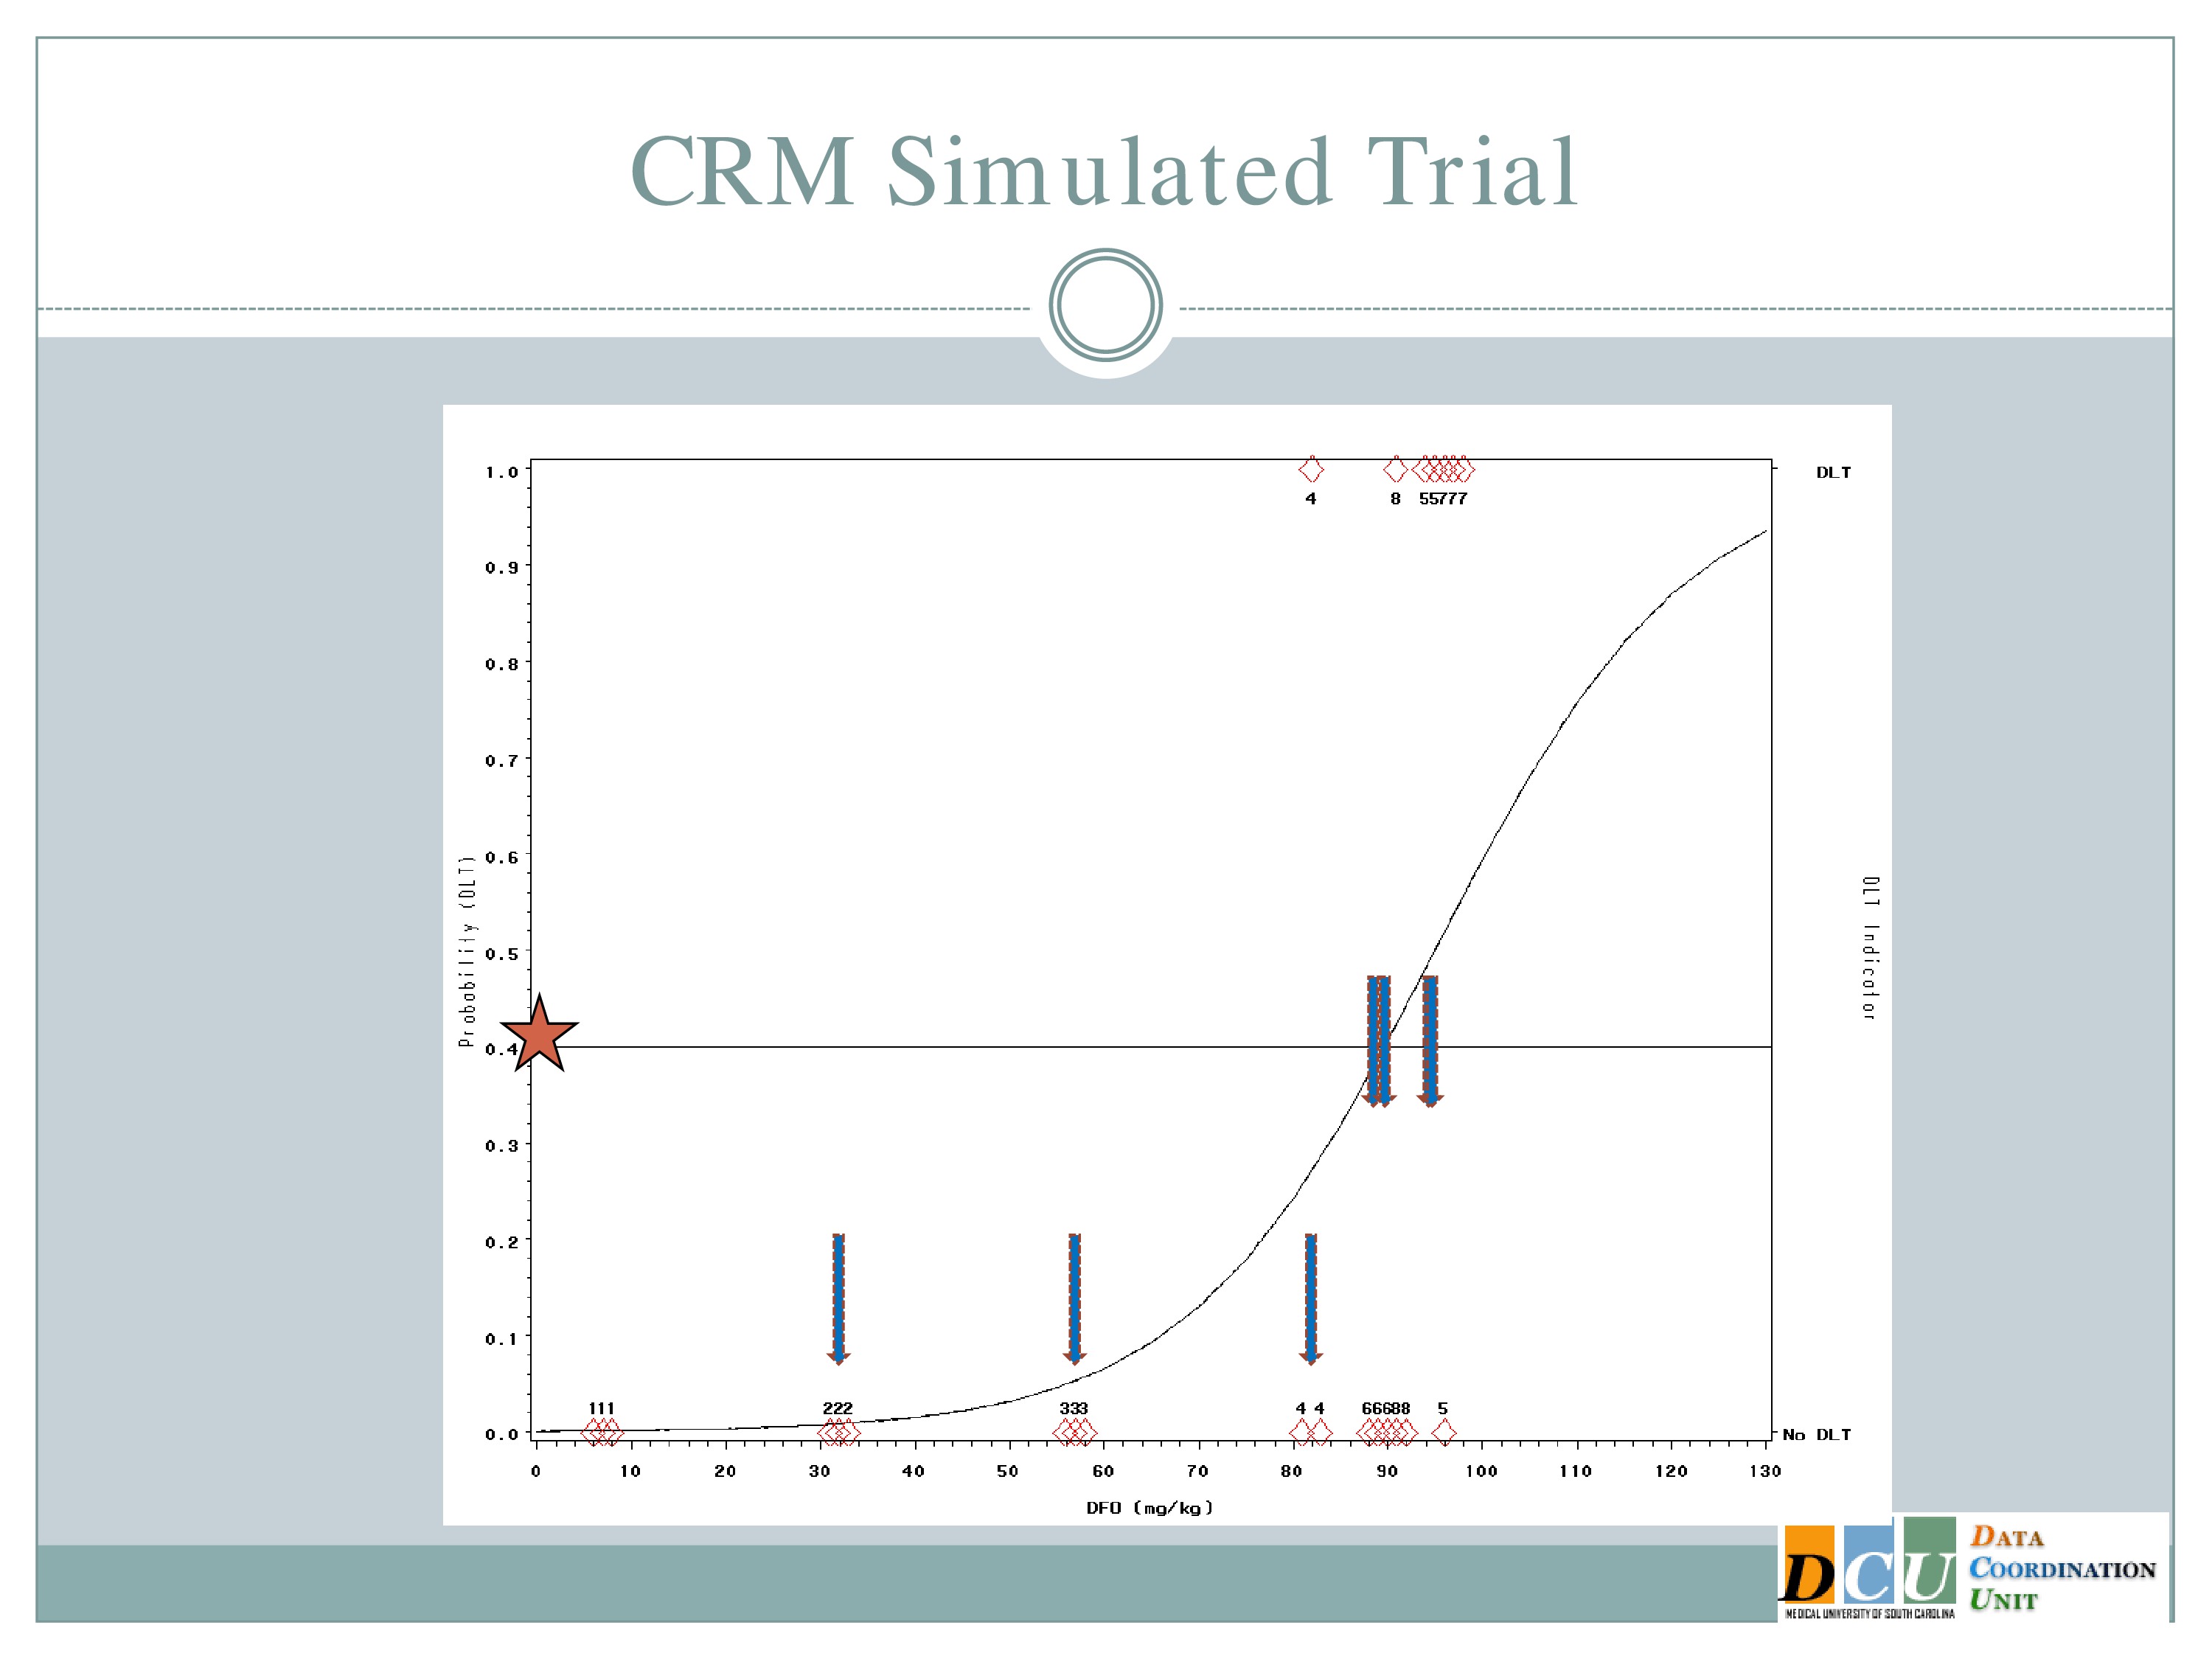
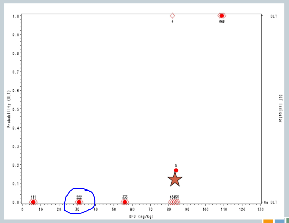
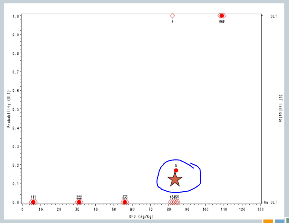
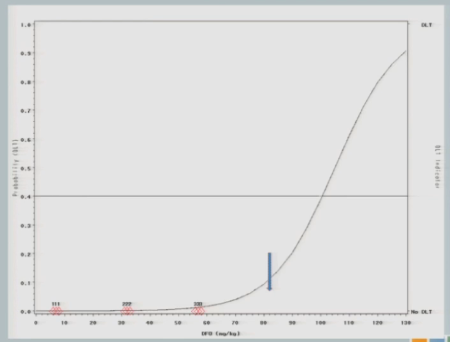
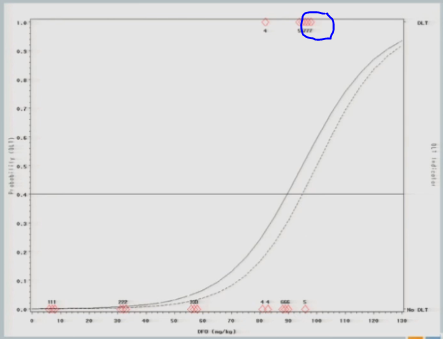
So what does this look like in practice? This is another simulated trial. This is the same scenario that I described before.
So some differences that I would like to point out. So here our preference in ICH is actually to target a 40% dose limiting toxicity rate, because the literature suggests that 40% of subjects untreated are going to have serious adverse events. So it doesn’t make sense for us to restrict our dose to something less than what’s available in an untreated population.
And the curve that you see here is what we hypothesized that dose toxicity curve to look at before we started the study.
So if we were to go with the strict definition of a CRM, our first cohort of subjects would have been treated somewhere out here at 92 milligram per kilogram.
The neurologist who is the PI of the study is a very nice guy, and he is very concerned about patient safety and there was no way this would fly. So we restricted the escalation, as I described to you. So we started the same 7 milligrams per kilogram I showed you in the 3+3 design and we restricted to 25 unit increments until a toxicity event was observed.
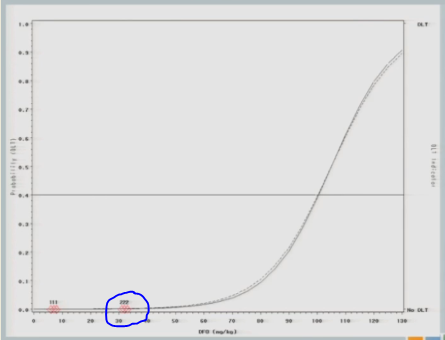
So we hypothesized this curve and treated our first cohort of subjects at 7 milligrams per kilogram, and there were no target events observed.
So we increased to 32. The next cohort of subjects is treated at 32 milligrams per kilogram.
And what I’ll show you here — it’s a little bit difficult to see in this cohort. It’ll become more obvious later on — is that after we get the information from a cohort of subjects, we re-estimate the curve and the curve shifts just a little bit, so you can see this curve [dashed line] is where we started our hypothesis. After we get that information, we switch the curve and it shifts just a little bit [solid line] — not a whole lot, because no target events means not a lot of information added to our hypothesized model.
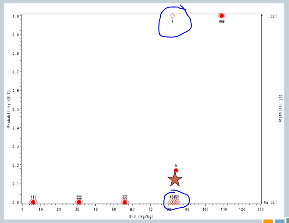
The next cohort of subjects is going to be treated at 57.
And again, no toxicity events. So this looks exactly like the simulated trial I just showed you so far, right?
When we get to 82, again, same situation.
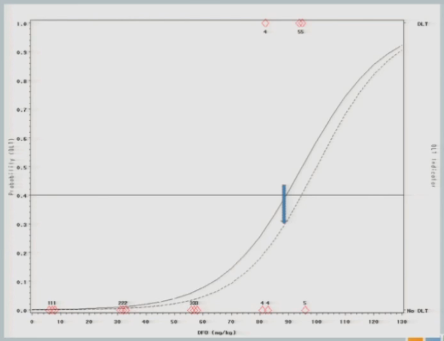
I have three subjects treated, one of them experiences a toxicity and now you can see that shift in the curve [from the dashed line (original) to the solid line (updated)], and now this is where you’re going to see how different this design is from the 3+3.
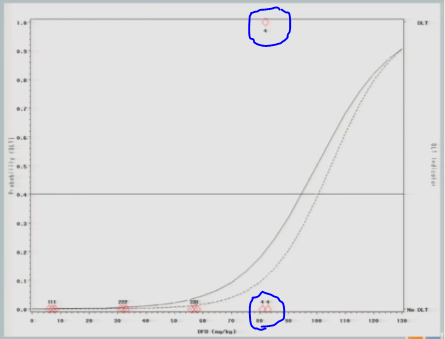
So now that I’ve experienced one toxicity event, I’m going to let the model tell me where my next subject should be treated. So I follow my 40% line over to the curve, I drop it down, and we think the Maximum Tolerated Dose is now at about 87.
So we treat our next cohort of subjects at 92. I treat three subjects, and two of them experience a target event. And so you can see now that the curve has shifted [from the dashed line (original) to the solid line (updated)]. We’re shifting to the left, because we have new data to suggest that maybe 92 is a little bit too much.
And again, if we follow the .04 probability over to the curve, now we have 87.
I treat three subjects at 87 milligrams per kilogram and none of them experienced a target event.
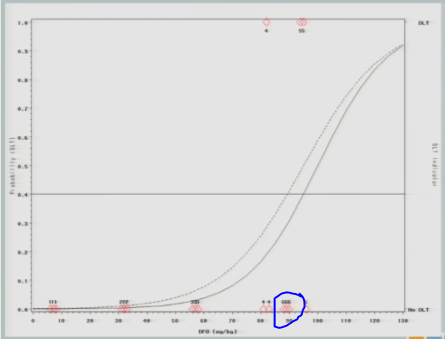
The curve shifts again and says, okay, I should go back to the 92 and see what happens there.
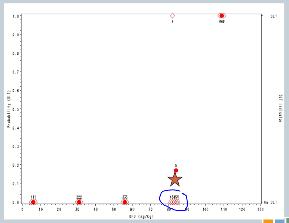
I treat three subjects at 92, and all of them experience toxicity events.
The model adjusts and takes us back down to about 89, so my next cohort of subjects is treated at 89 milligrams per kilogram.
One of them experiences a toxicity event, and now you’ll notice there’s no change in my curve.
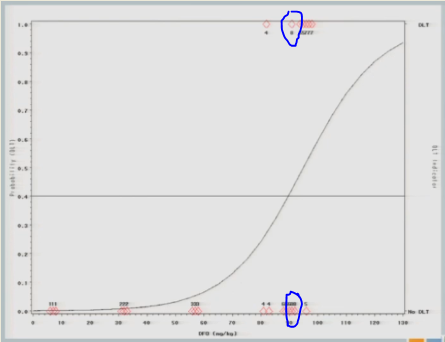
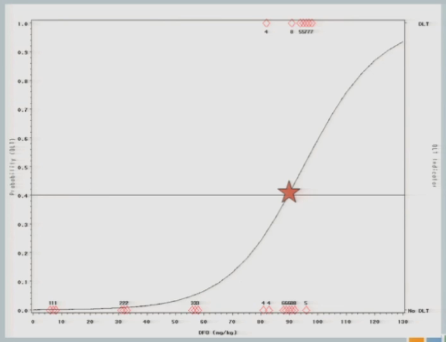
So we might consider at this point that the algorithm has converged and we’re going to claim that the Maximum Tolerated Dose is this 89 milligrams per kilogram.
Advantages and Disadvantages
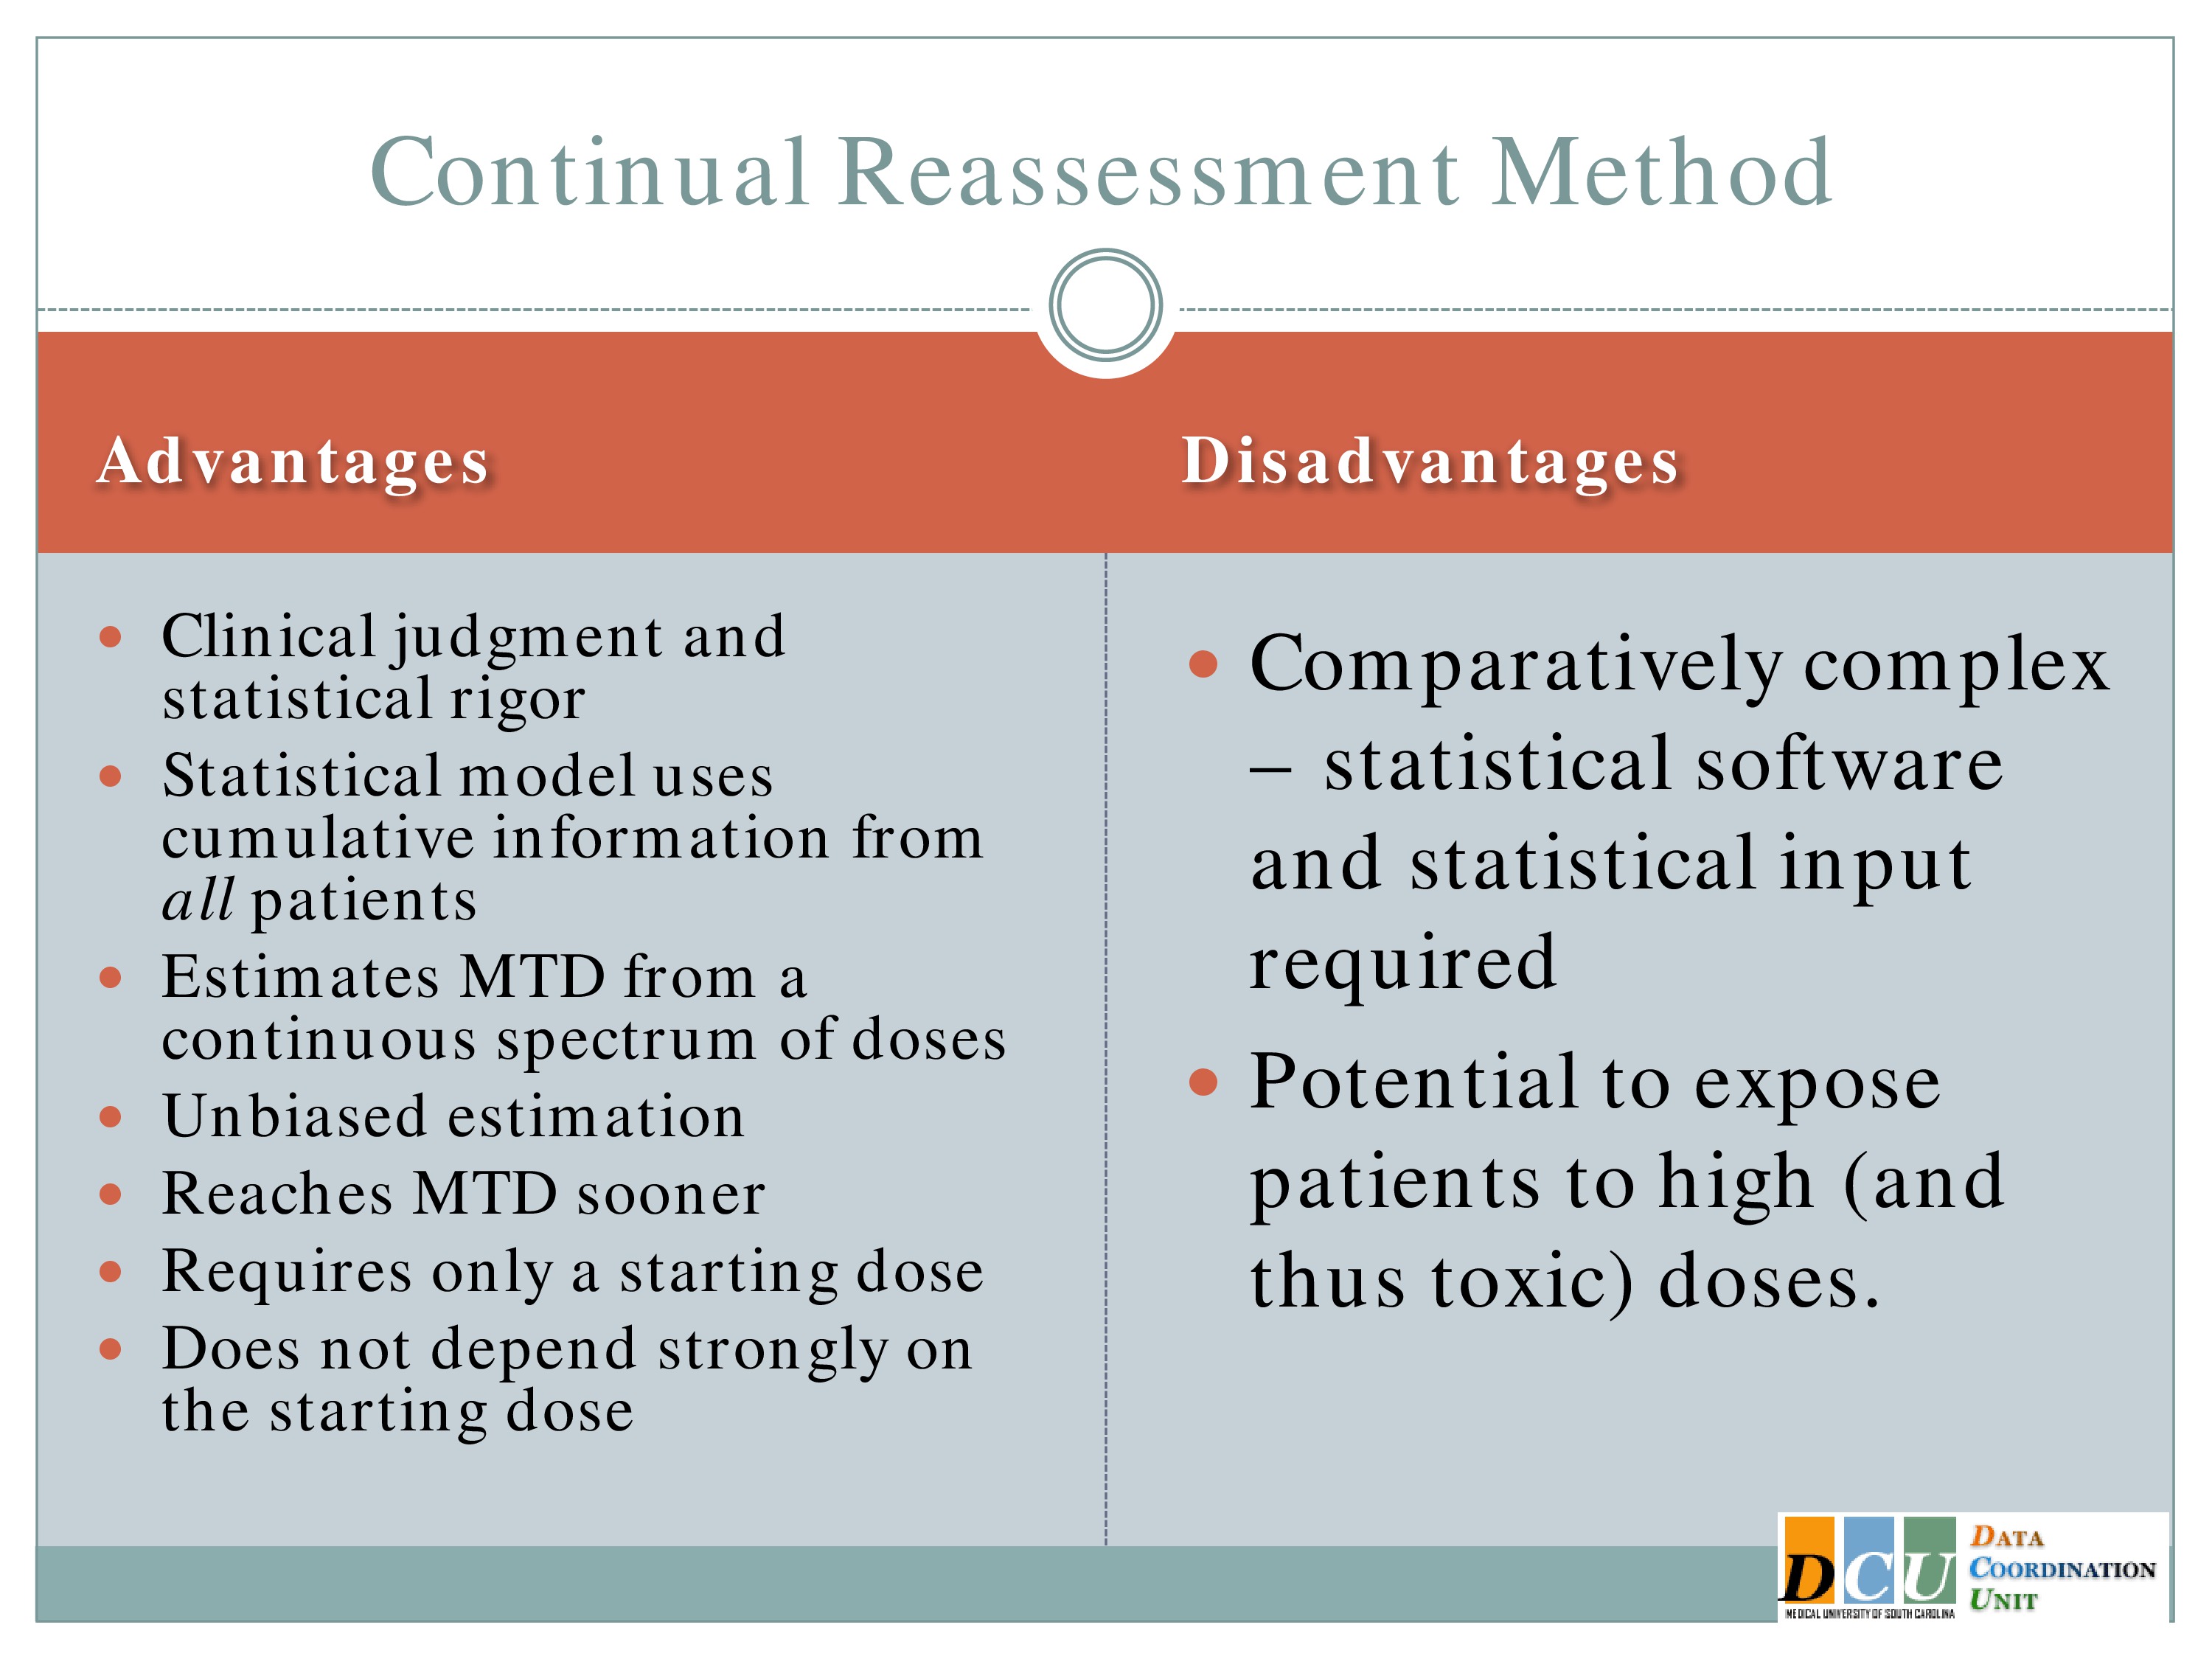
So what sort of advantages do we get from this approach? Well, it’s a combination of clinical judgment and statistical rigor. We can understand the operating characteristics, we can control the target probability rate that we’re interested in, and the model uses cumulative information from all of the patients, not just the three that are being treated at the current dose, but it lumps your initial hypothesis and all of the accumulated data that you have thus far to guide you in future steps, so you really are using that sort of adaptive mind frame. You’re adapting to the information as it comes in to update your best guess of the Maximum Tolerated Dose.
It allows you to estimate the Maximum Tolerated Dose from a continuous spectrum of doses. I didn’t have to specify in advance what doses I was interested in. The model tells you.
And you can restrict it. If it’s too hard to come up with a dose of 89 and a dose of 88, you tell the model the doses have to be so many units apart in order for me to distinguish them.
Audience Question
In our field we don’t typically have a toxicity problem. We’re not interested in killing the patient, but we have this issue where we could get to a point where we’ve either irritated the patient so much or they are too tired — it’s not a toxicity issue, it’s a tolerability issue. Can we get them to do the extra swallows that they need in order to proceed?
There are tweaks to this model that I will talk about, so I would argue that you are in this case where you’re not interested in moving smoothly through this dose space. So if you say along the x-axis maybe that this is the number of minutes per session, that you’re not interested in starting at zero or five minutes and going in 10-minute increments through the session.
You’re interested in saying, this is what I think is the right place to start, let’s collect some data and let it guide me through. So it’s really just sort of tweaking what I’m referring to as a toxicity event really to be a tolerability event. How much can the patient stand in order to continue along this therapy that we think will help them if they just do it?
In many cases we treat dose finding as we’re trying to find the Maximum Tolerated Dose and then we’re done. In cases such as this, I don’t think that’s the answer. You want to find the Maximum Tolerated Dose and then maybe start there and work backwards to find the Minimum Effective Dose.
How little can we get away with and still have a reasonable outcome? I’m glad you brought that up.
Defining the Optimal Dose
I’m going to jump ahead just a minute. So defining the optimal dose — I mentioned this already — so in this case it’s probably just as important, maybe more important to talk about the Minimum Effective Dose. And you can do that in a couple of different ways.
Finding Effective Doses
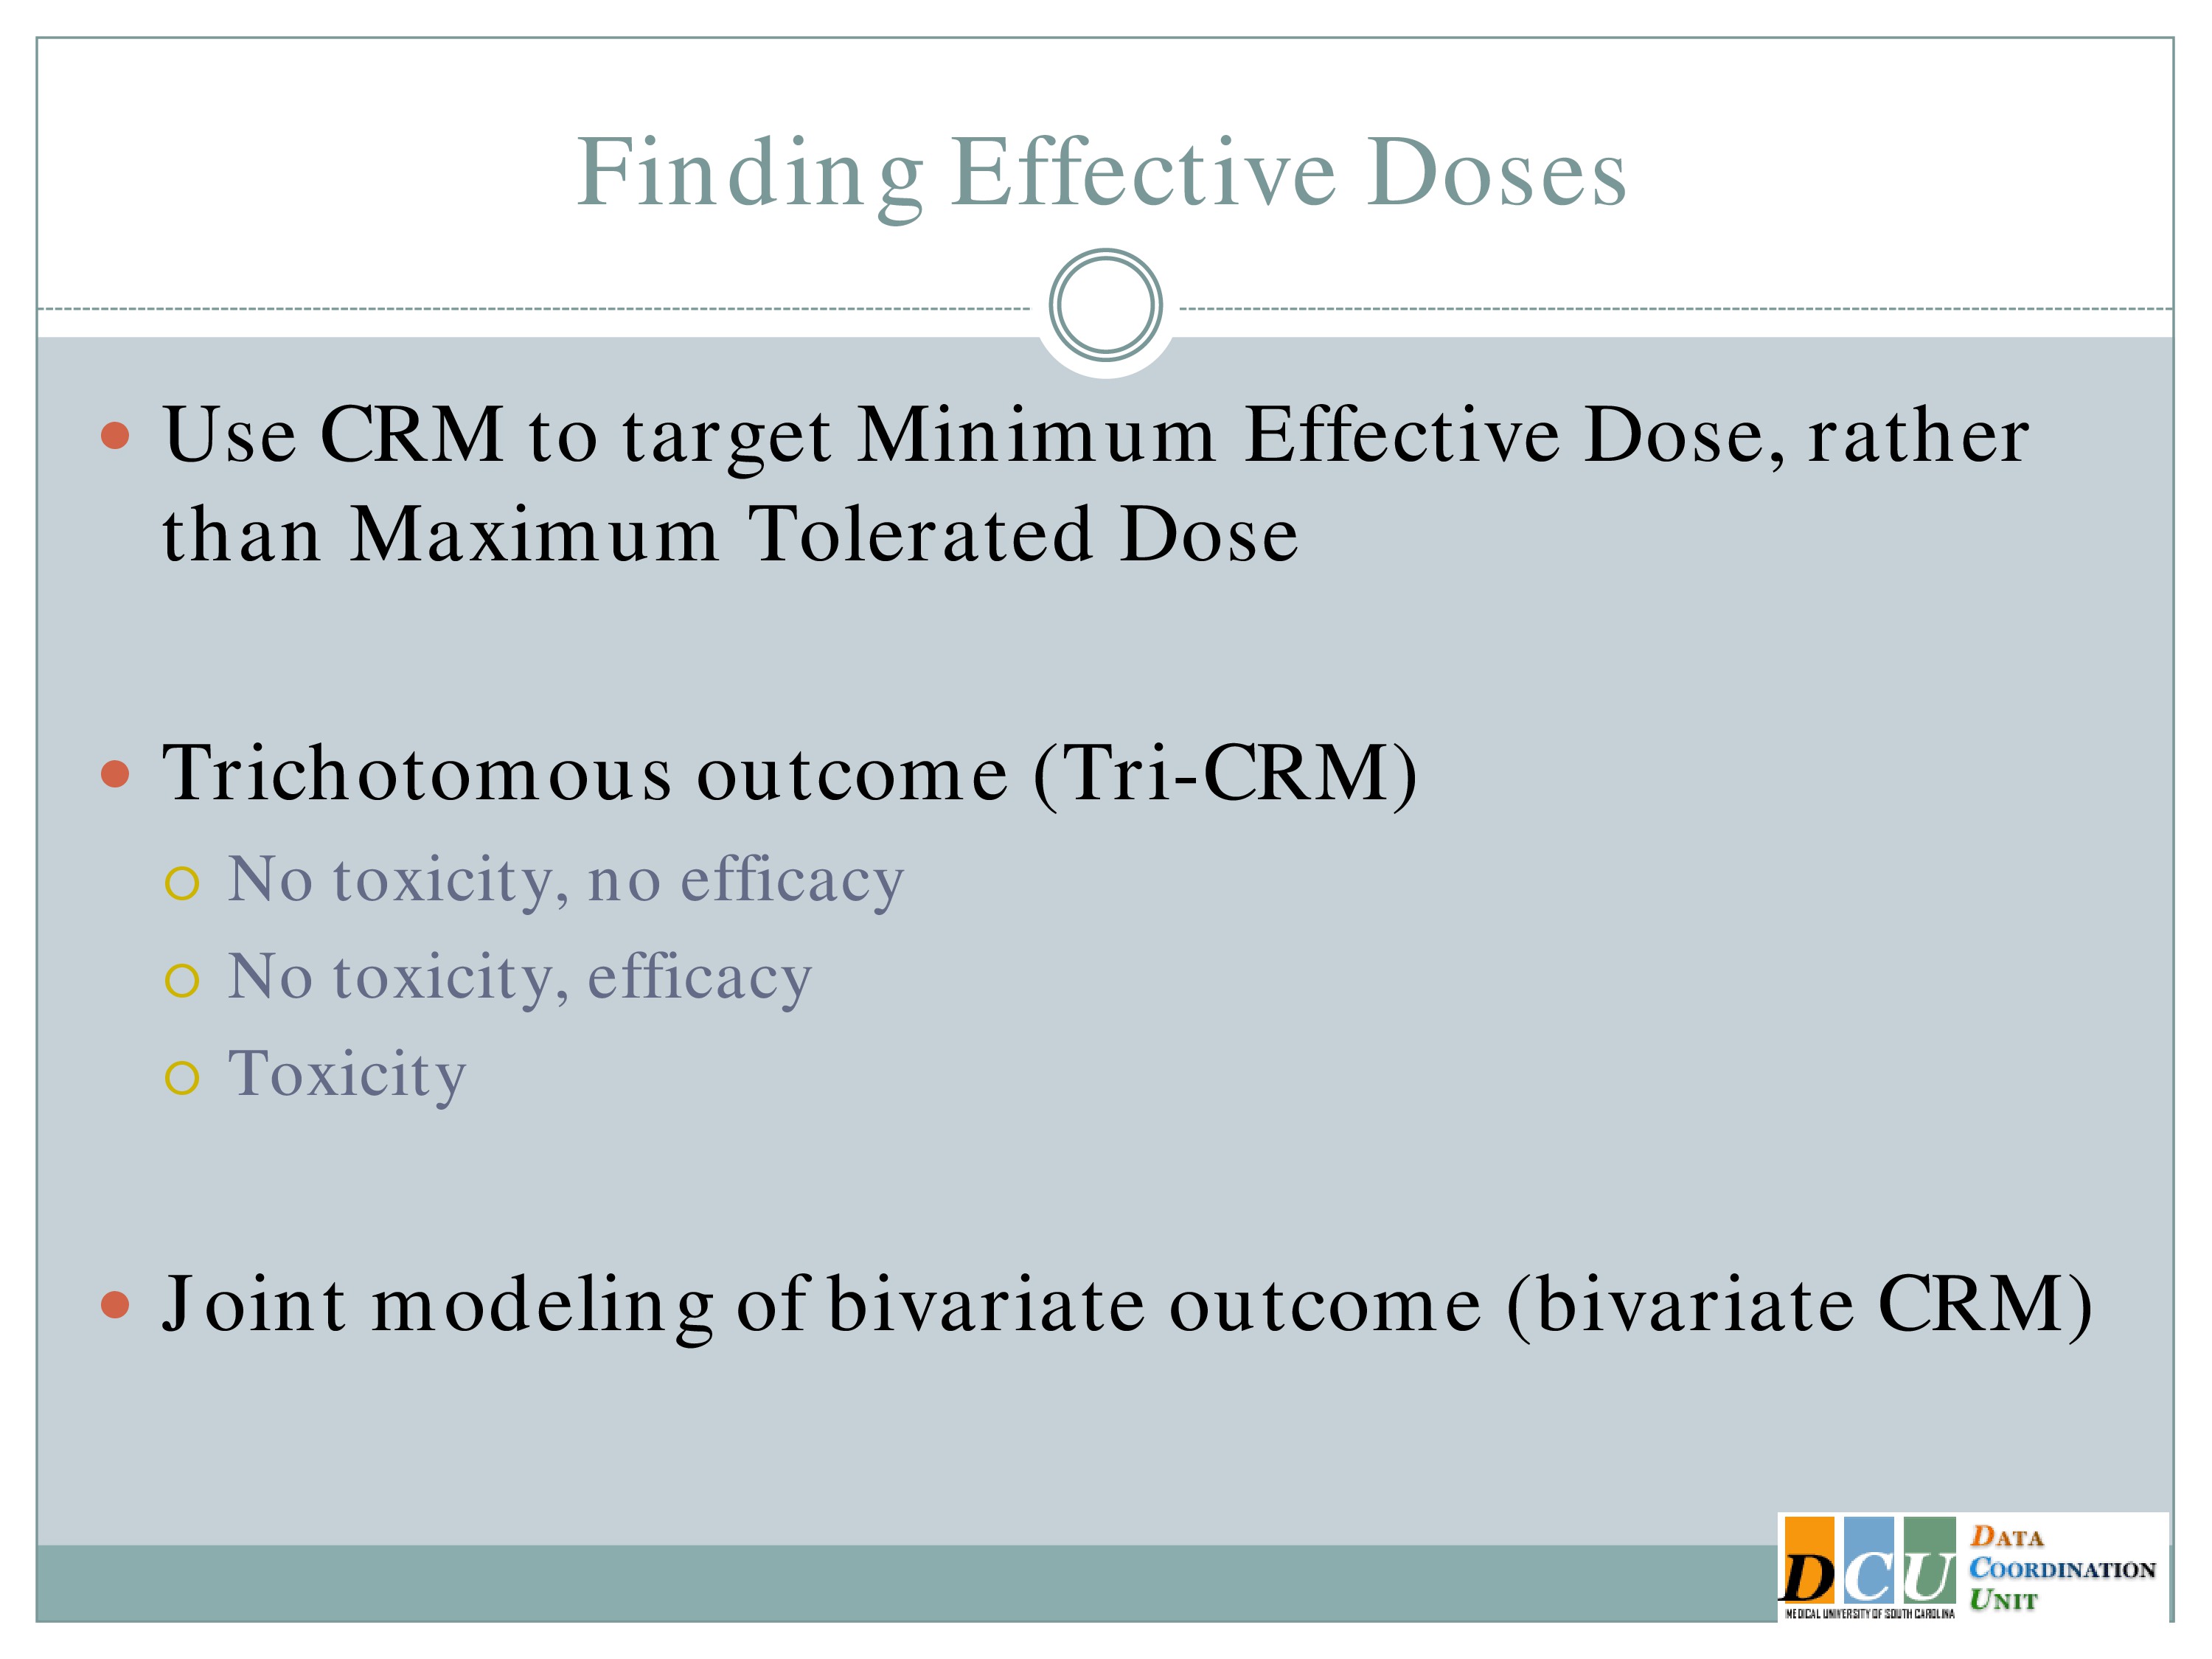
So you could redesign that continual reassessment method so that you’re looking at an efficacy outcome instead of a toxicity outcome. That’s very easy to do. It really requires no switch on the methodology, it’s just training yourself to think about the outcome from an efficacy standpoint.
Another option is to jointly model the outcome, so you can model one tolerability outcome and one efficacy outcome simultaneously and try to find the optimal balance between those two.
Defining the Optimal Dose
Another possibility, which is really nice, is to basically think about your outcome the same way we think about this dose space. So here we have non-toxic, non-efficacious doses; non-toxic, efficacious doses; and toxic doses.
We can define our outcome the same way, so combine efficacy and tolerability into one outcome for each subject so that a subject gets graded as having no toxicity but also no efficacy, no toxicity and some efficacy established, and toxicity. And so model that trivariate outcome at one time to find the optimal dose that way. That would be another way to bring the efficacy in.
But you’re right, in pharmacologic agents, we often assume this Maximum Tolerated Dose is the one, that’s the one we want. In this case it probably isn’t. You really want to know what is this minimum.
Audience Question
How does continual reassessment work in the context of modeling continuous outcomes? Are you setting a threshold?
For example, in swallowing, which many of us are in, you might say my aim for benefit is applied swallowing without aspiration. And that would be what I would measure in each patient who does a particular dosage, until I get 80% at that, perhaps.
So the continual reassessment is a statistical reassessment, not a patient level reassessment.
In the study I described to you, our outcome was 90-day modified rank and scale, and it was assessed at one time point for the efficacy design. For the toxicity design we did Day 7, the occurrence of any serious adverse event. And so it’s a continually updated statistical design, but not that the patient is continually assessed over and over.
There are ways that you can account for that variability in the outcome. There are also approaches — you could switch the design around, I haven’t seen this implemented in practice, but you could implement it with a continuous outcome rather than a binary. I don’t see why not.
If you know what the target level of improvement is, if you know what the mean is that you’re trying to achieve, we could sketch out what that dose response curve should look like and just target that mean instead of a proportion. I think that would be fine.
Or, statisticians don’t like to tell people it’s okay to categorize continuous measures, but you could do that.
Advantages and Disadvantages
Okay, so let me back up just a minute again. So the reason that stat folks like the Continual Reassessment Method, it has unbiased estimation.
I told you the 3+3 is going to give you a biased estimate of the Maximum Tolerated Dose. The CRM does not. It has been shown to reach the Maximum Tolerated Dose sooner than the 3+3, but again, you have to keep in mind that any modifications that you make to restrict escalation is going to impact how much sooner you can get to that estimate. And it does not depend strongly on the starting dose, because you’re again, adapting to the information as it comes in.
Disadvantages, of course, I have to point out it’s way more complication to actually implement than the 3+3. There is software that makes it much easier. It’s sort of black box software. I don’t know of a clinical trial that’s done it with just the clinician using the black box software. It generally requires statistical effort, because every three patients, once that outcome becomes available, we have to re-update the curve, we have to update the Maximum Tolerated Dose, we have to somehow let the sites know what the new dose is without letting them know what happened at previous doses, so it is a little bit more complicated.
It does again, unless you implement those restrictions, it does have the potential to expose patients to higher doses more quickly than the 3+3 would.
Variations
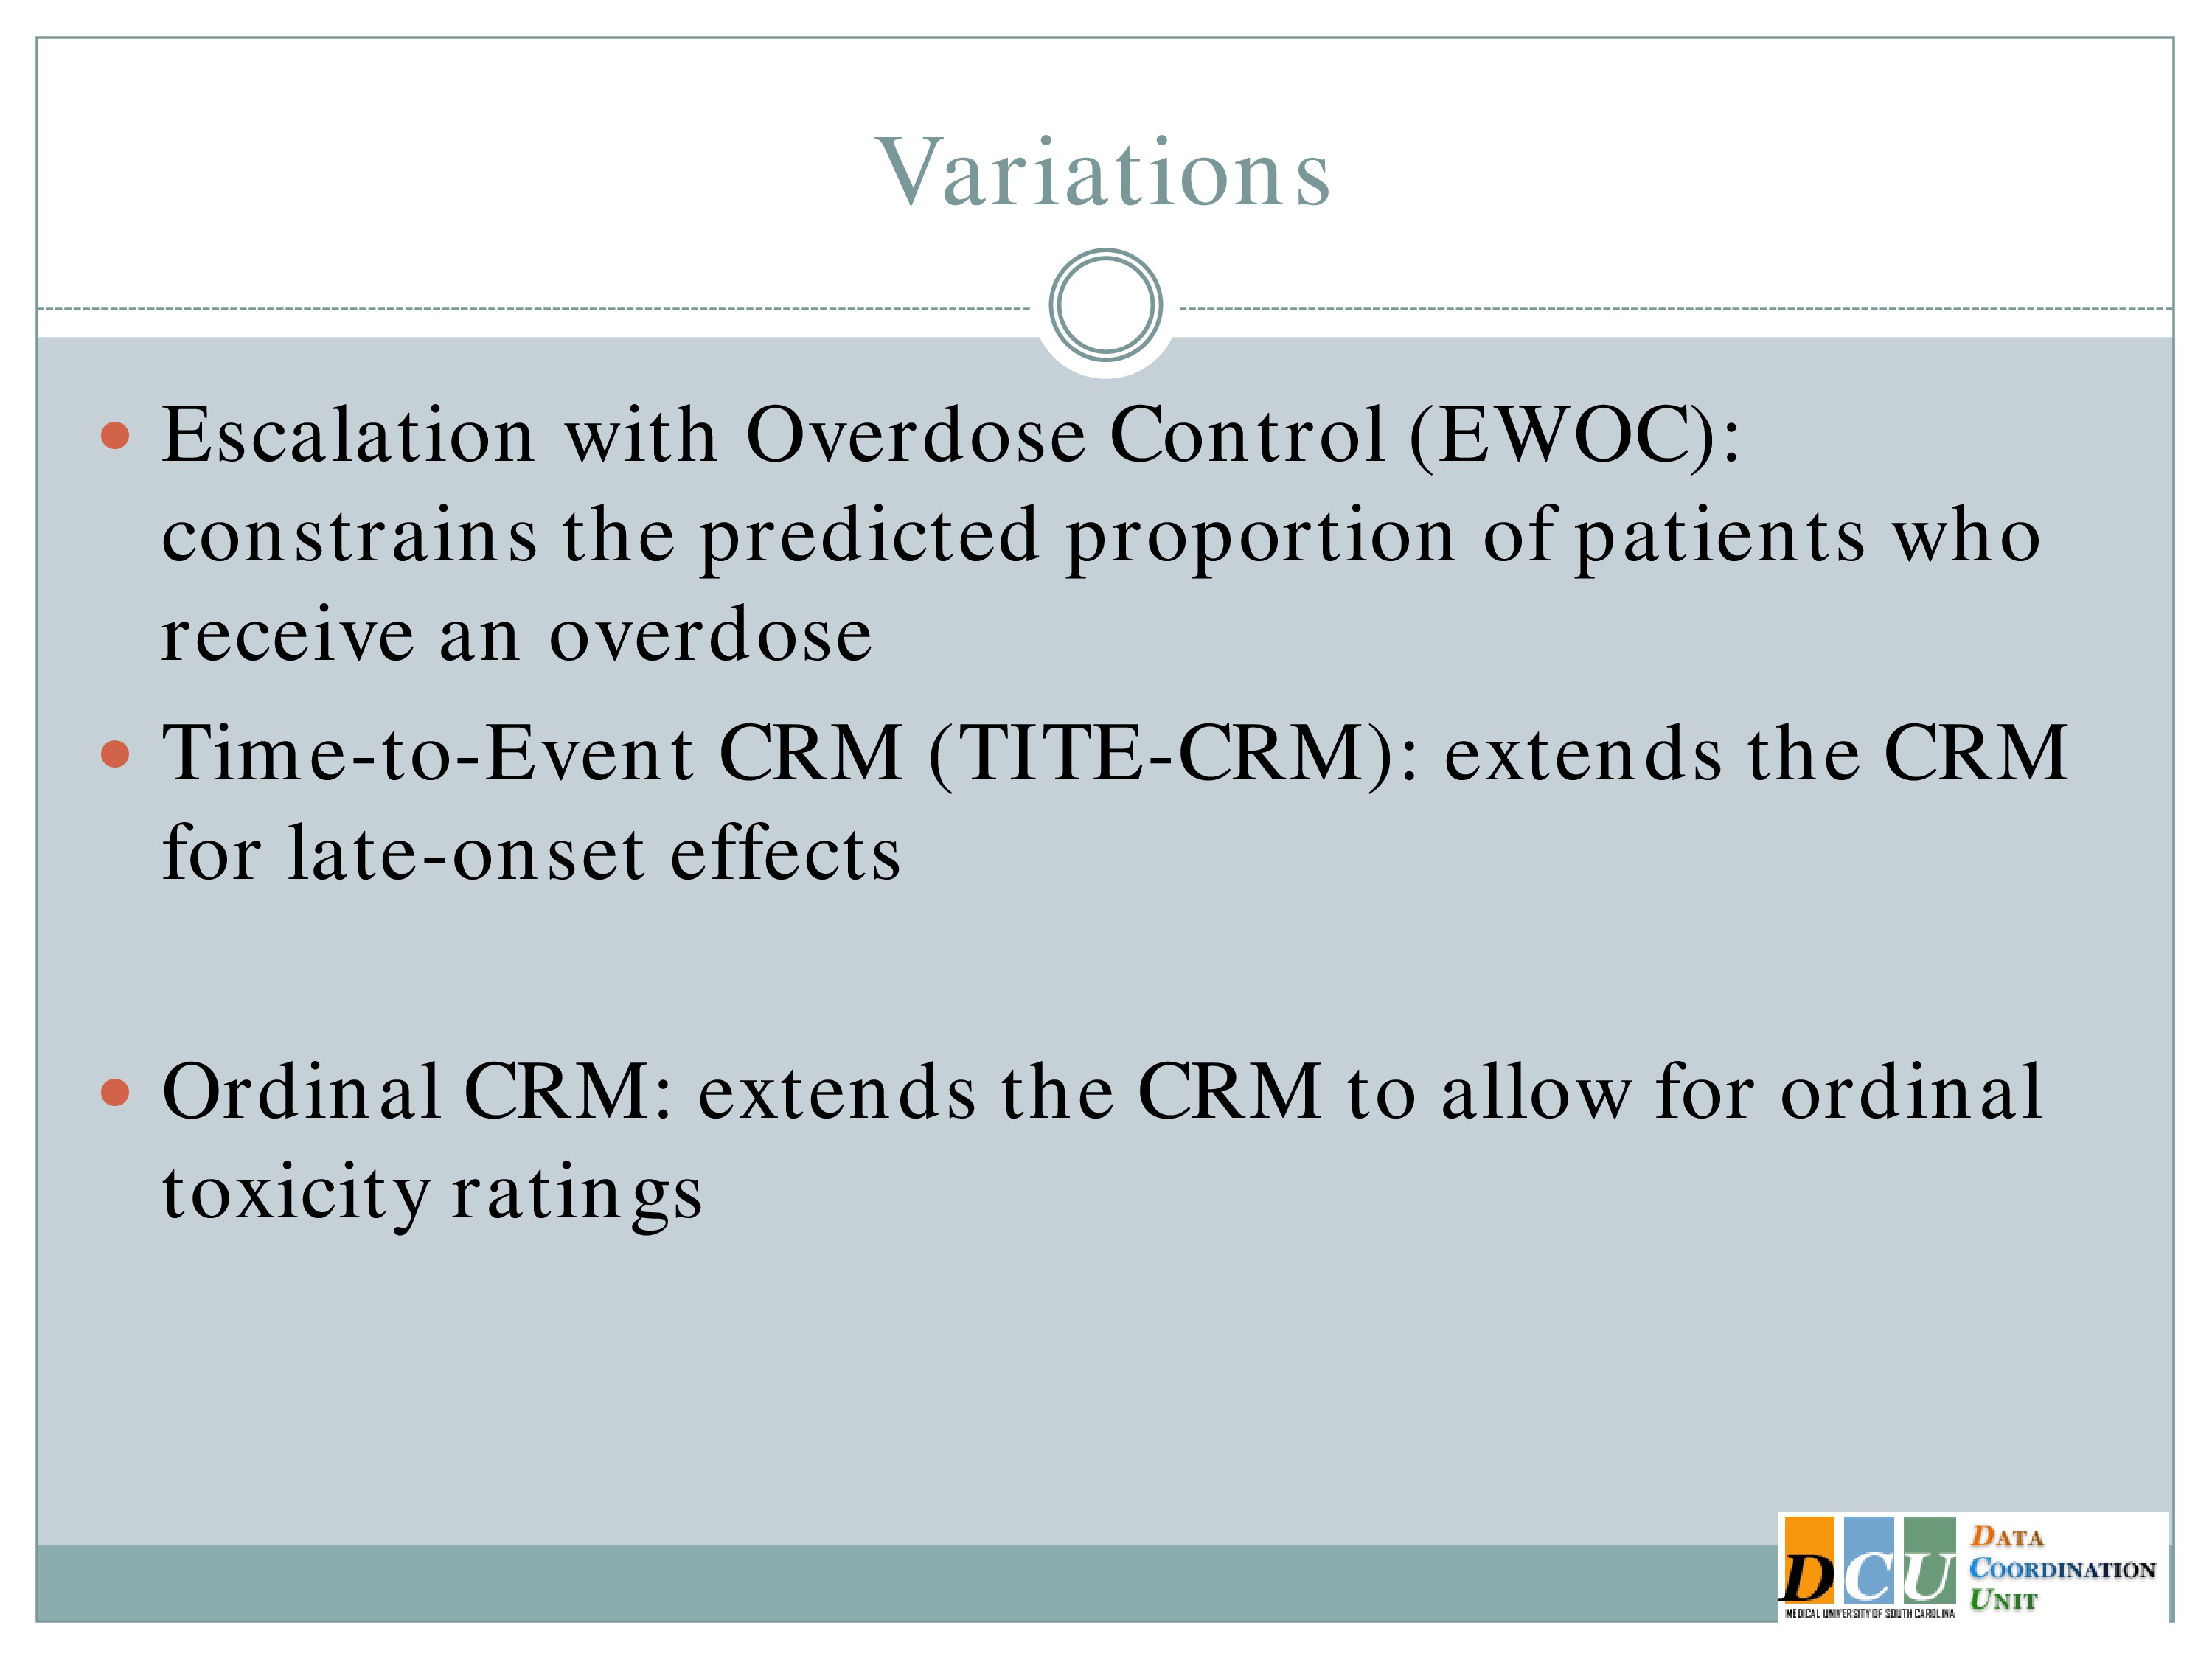
But there have been other variations as well. Escalation with overdose control may not be as relevant to you all in this field, but it essentially a CRM that constrains the proportion of patients who receive an overdose to some acceptable number.
There is also the time to event CRM, which extends the CRM for late onset effects.
So what does that mean? If I have to wait for every three subjects to experience an outcome and the outcome is at 90 days, let’s say, I don’t want to stop enrollment from the time my third subject is enrolled until that 90-day follow-up is available.
So let’s say it’s a relatively slow and rolling trial; I have three subjects enrolled, my fourth is available when two of them have complete follow-up and one of them is only halfway through.
The time to event allows me to weight the data I have for that third subject who hasn’t yet completed and use what I have to update the dose for the fourth subject. So I’m not losing anybody. And then once that third subject’s follow-up is available, it gets incorporated into the model very easily.
The ordinal CRM was proposed a couple of years ago by one of our students. It extends the CRM to allow for ordinal toxicity ratings. So you can think about rather than just saying was there an adverse event, was it mild, moderate or severe, and you can incorporate that, I would think the same would be true with fatigue. Folks might say yes, I’m tired but how tired are you? Are you so tired you’re not going to do anymore, or are you getting there but I could still try for a couple more minutes. And so you could grade the outcome in that way.
Audience Question
Could this model include a placebo arm?
Yeah, you could certainly incorporate a placebo arm. You’d have to think about whether you want it to be the first of your doses tested and then you want to move through, or whether, say with every cohort you want to enroll three subjects at a dose and one subject at a placebo. And that way there’s no time effect in that placebo.
Phase II Adaptive Designs
Okay, so at the end of Phase 1, let’s assume we have a Maximum Tolerated Dose and a Minimum Effective Dose and now we want to move to Phase 2.
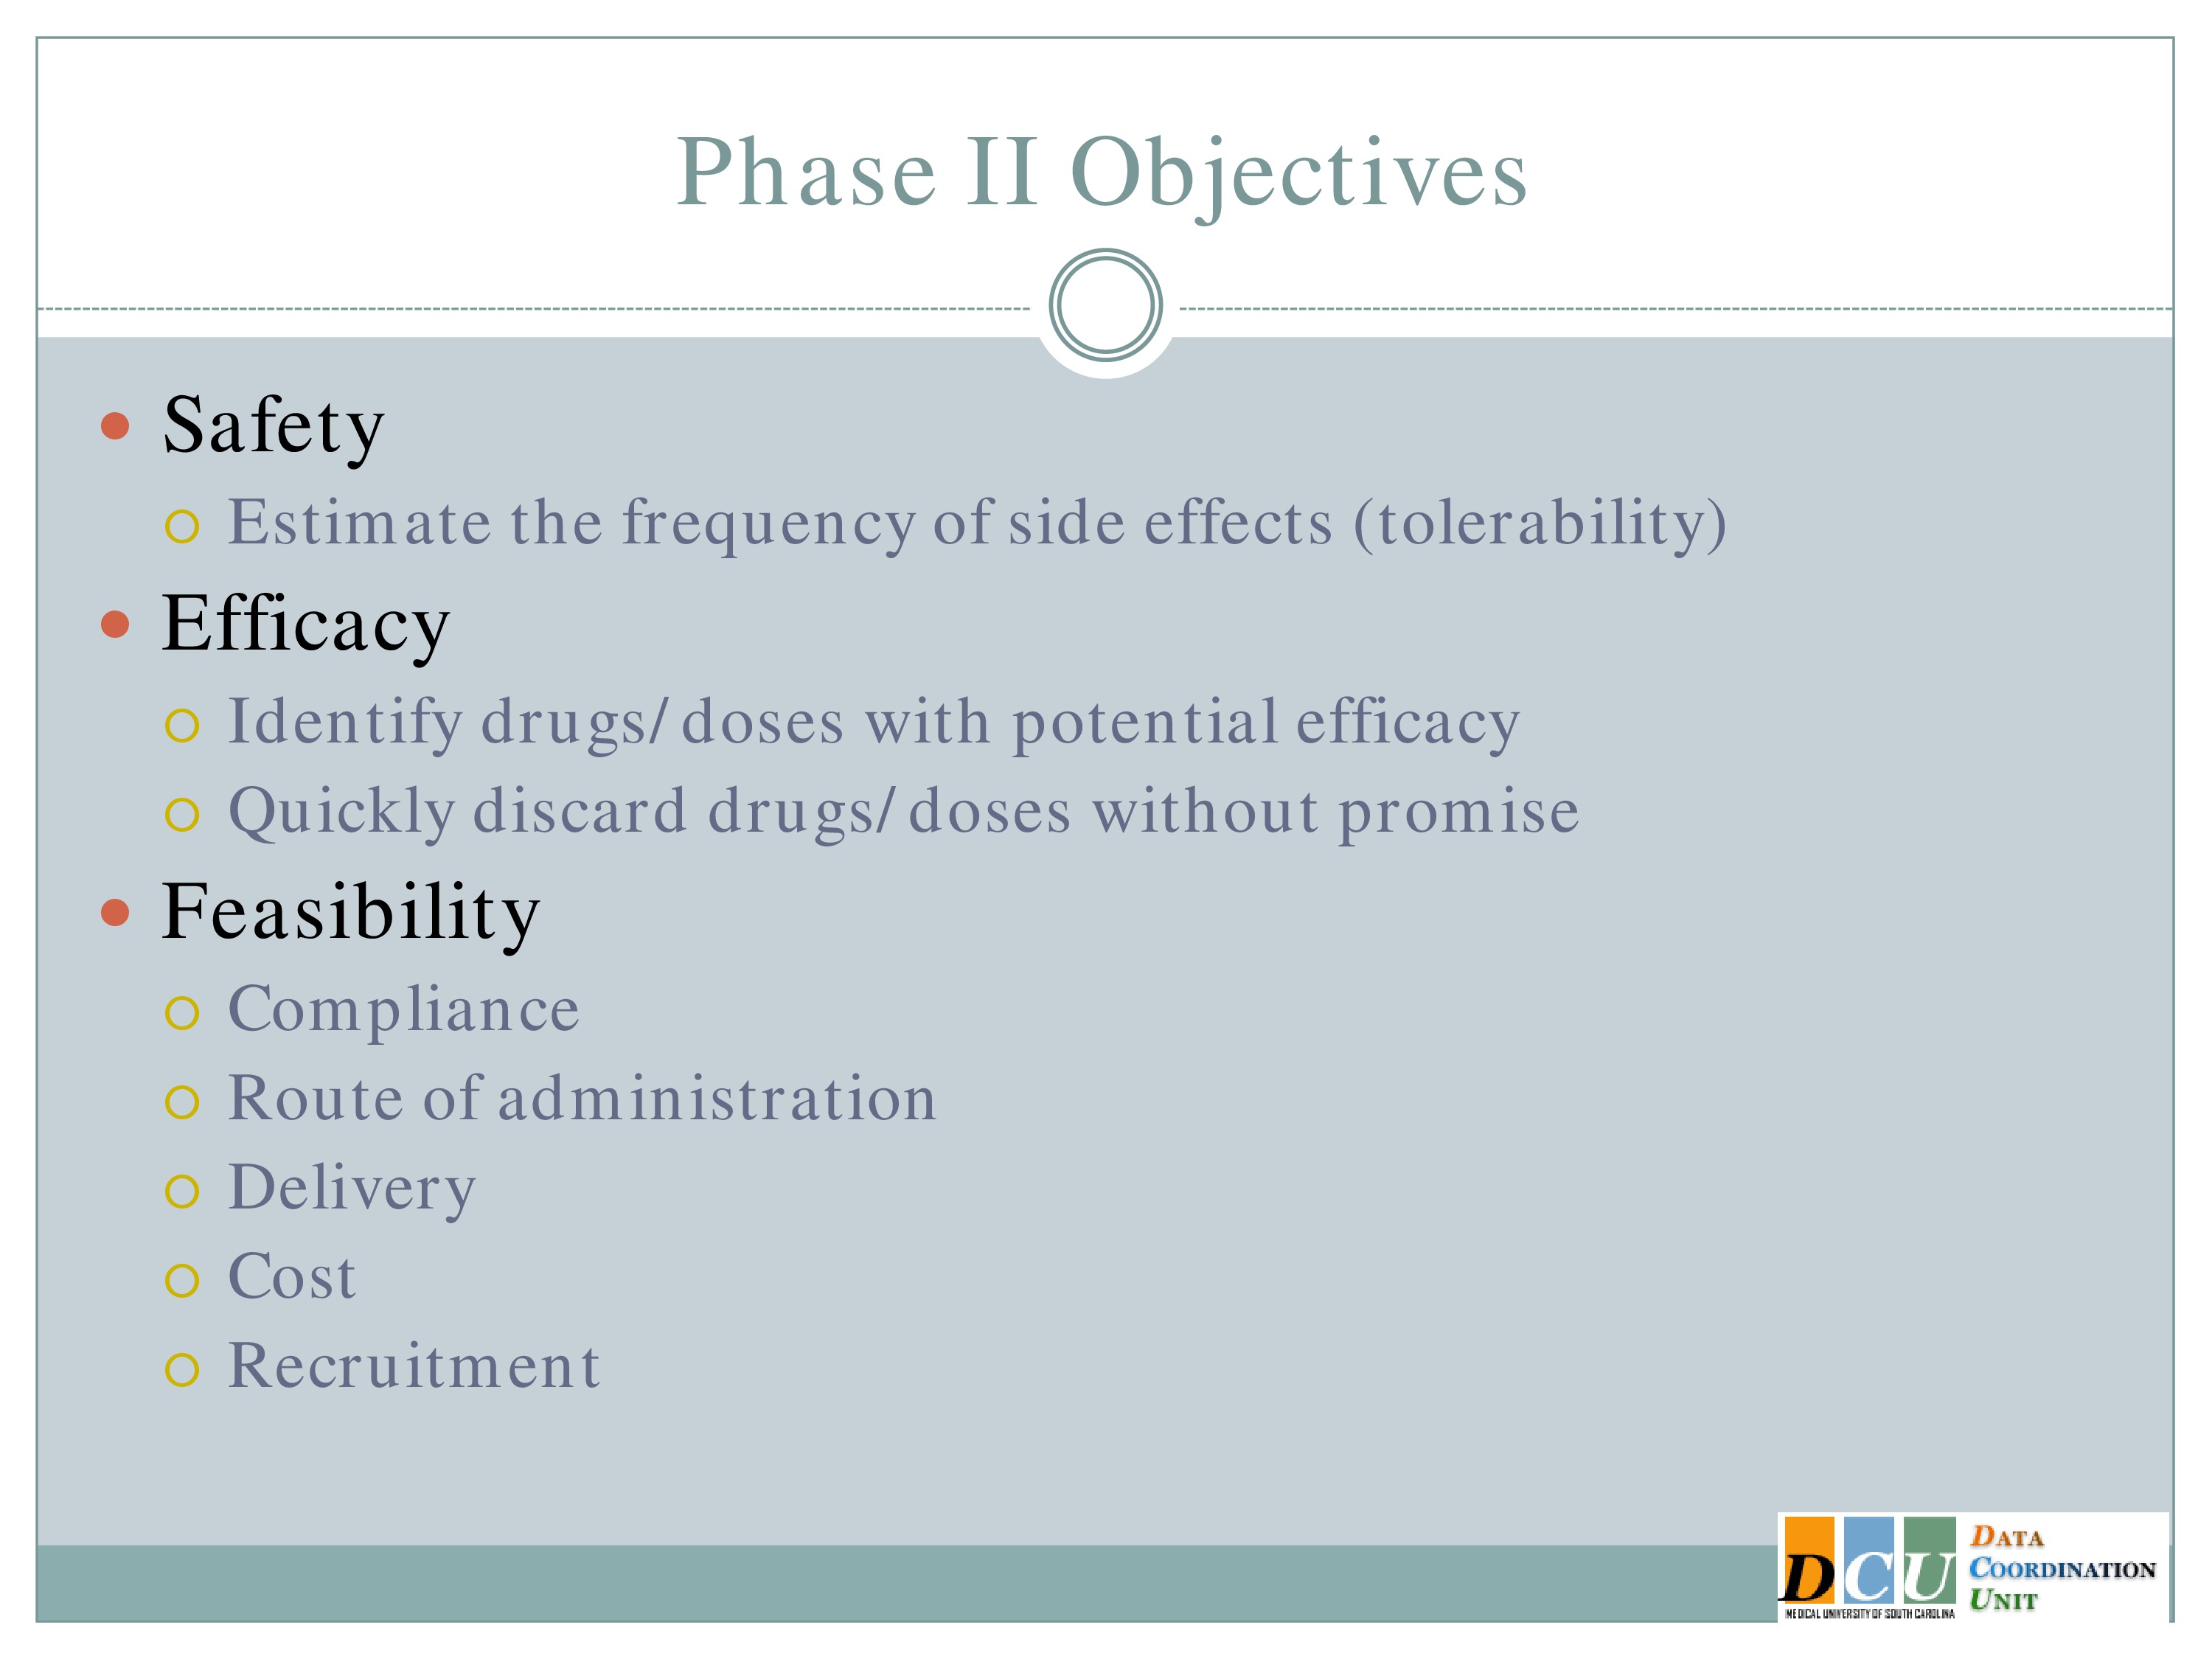
Just having those doses is not enough. It may be the case that some dose in the middle is actually the optimal in terms of your efficacy. And so in Phase 2 we’re trying to still estimate the frequency of side effects, we want to identify doses with potential efficacy and quickly get rid of anything that doesn’t look promising. And again, we’re always looking at feasibility.
Selection Designs
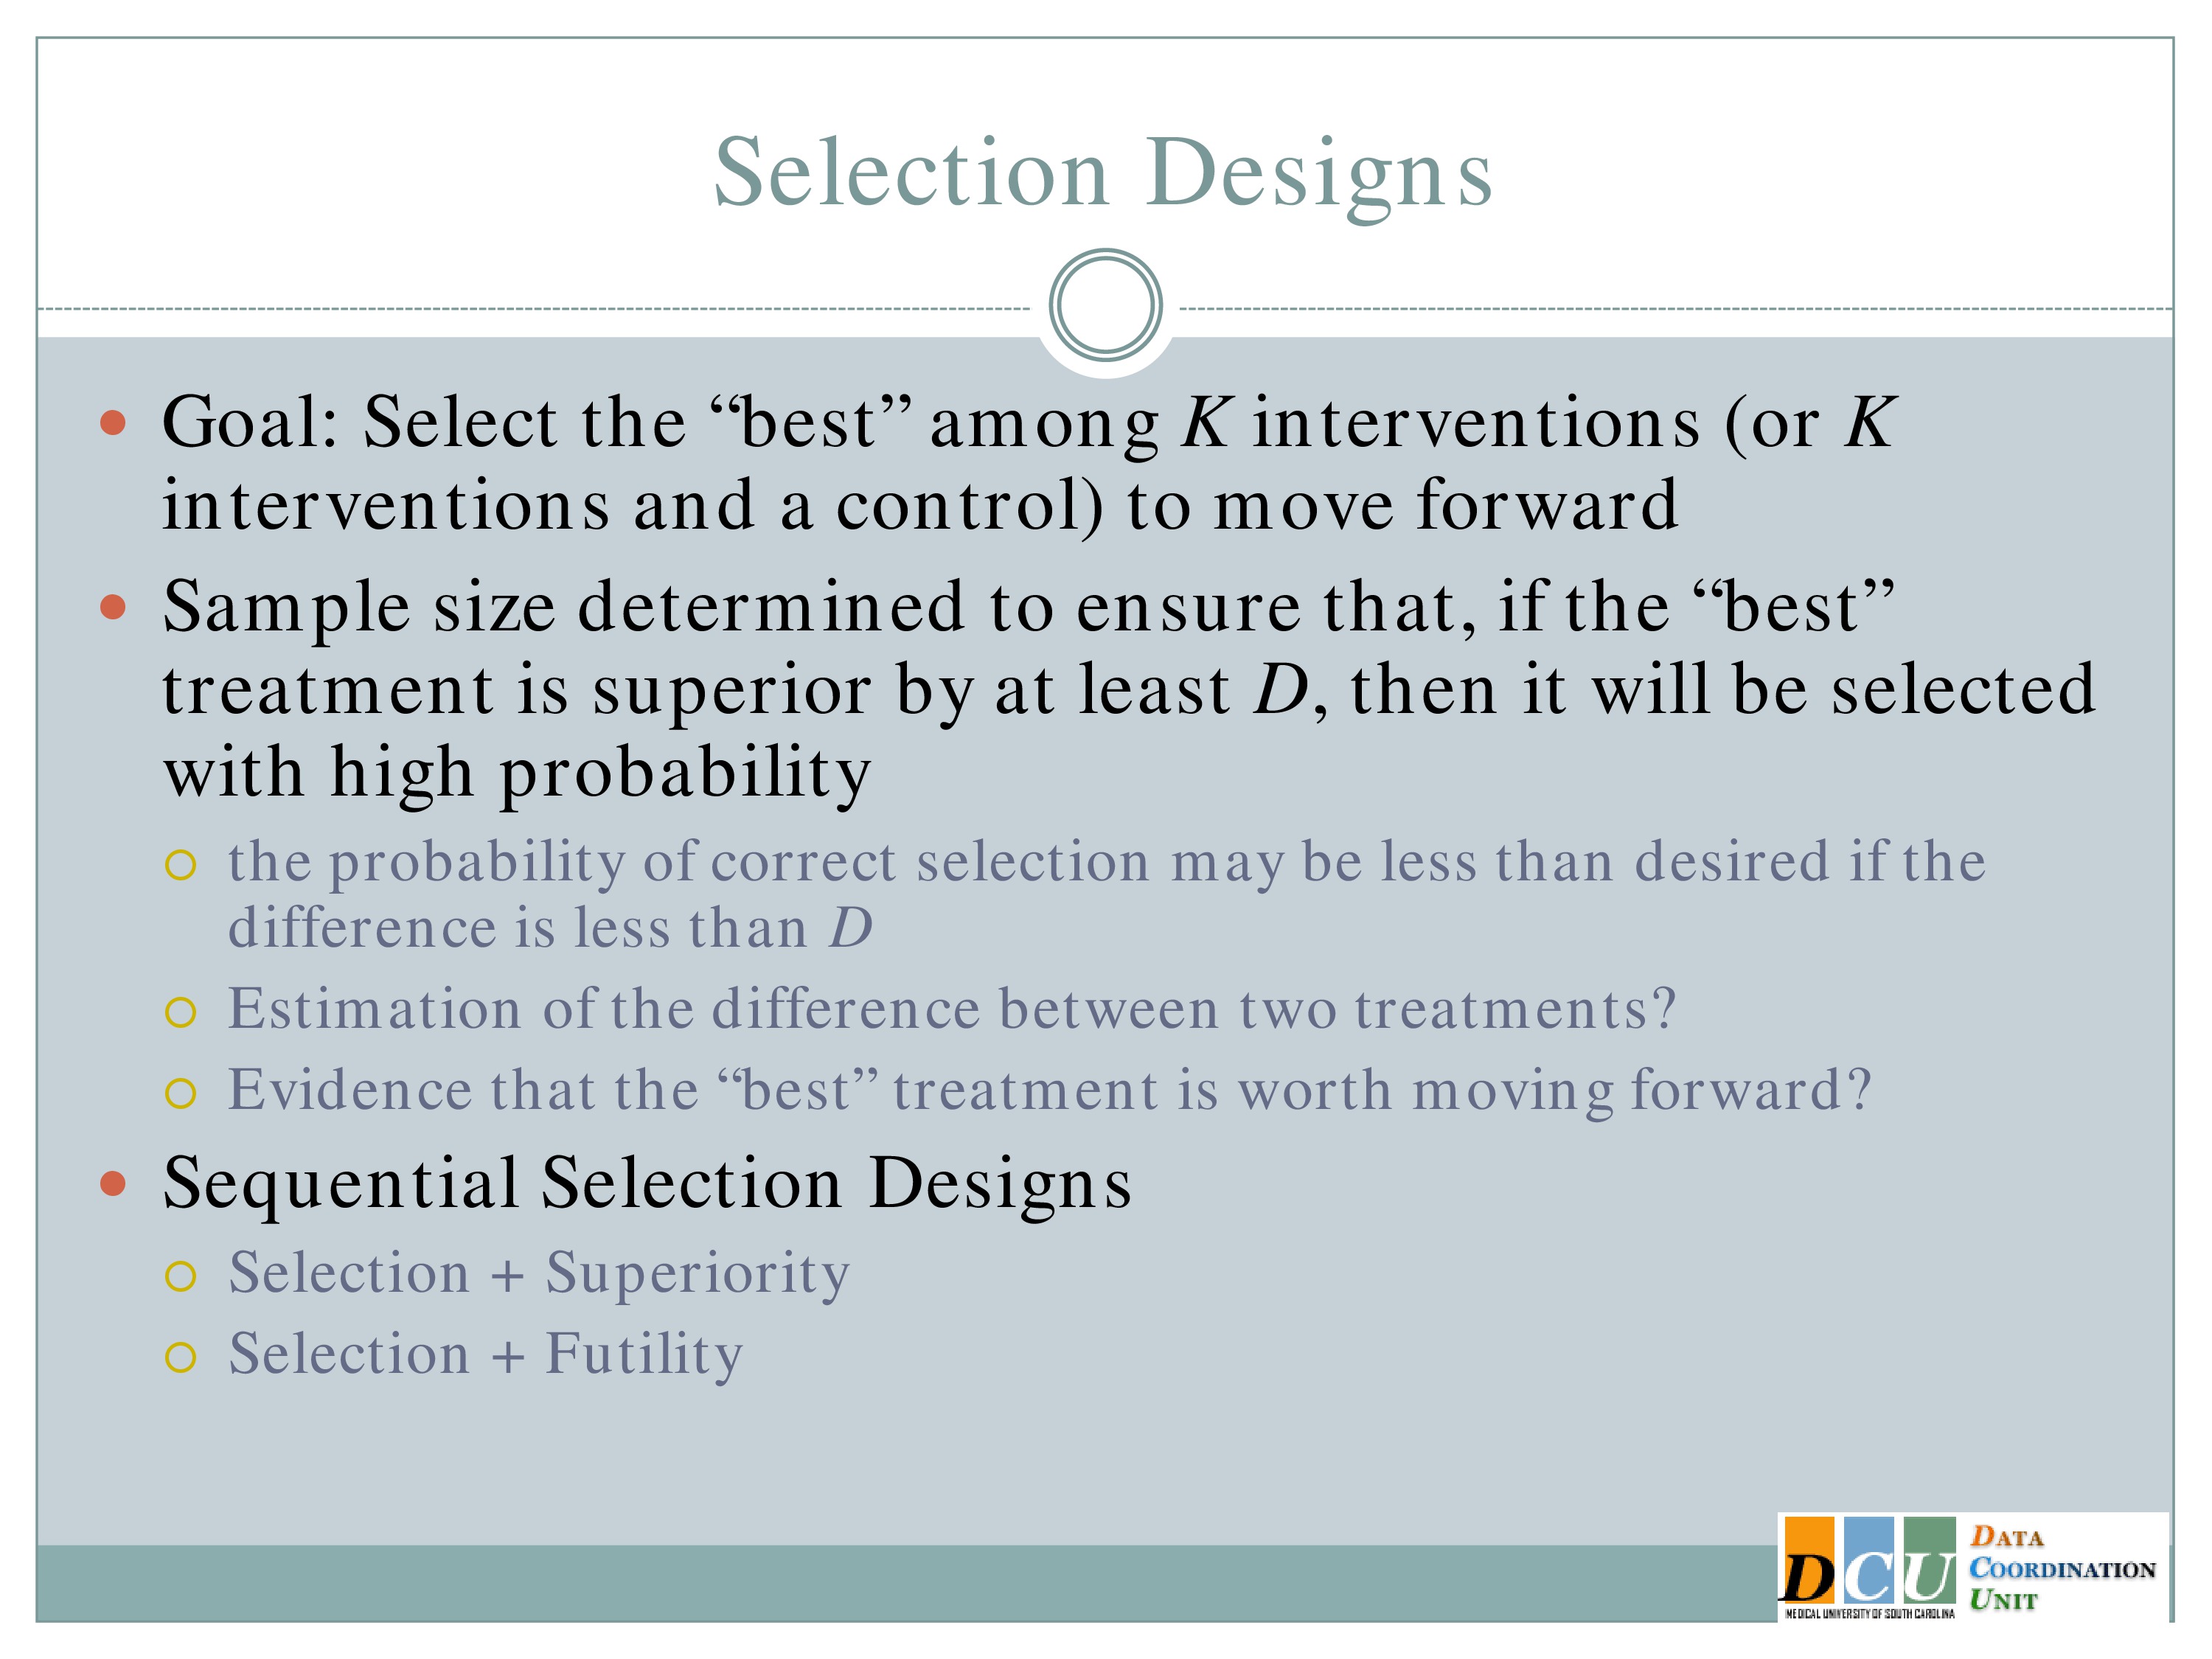
A design that I don’t think has received enough attention in Phase 2 as it probably should is the selection design, which is going to allow you to select the best among K interventions or K interventions and a control to move forward.
And what gets people about this, I think is that it’s not based on a statistical test. It’s whichever one looks best. And when we proposed this to our clinical collaborators, I’ve had at least two of them say, “But I tried to do that and you told me that was not allowed.”
And the reason it’s allowed in this case is because the study is designed to have again, statistical operating characteristics, which make us pretty confident that if we just pick the best one, it has a high probability of actually being the best one.
Okay, so if we think the best treatment is superior by at least some margin D, then we’re going to come up with a sample size that’s required to make sure that we’re going to pick that treatment with high probability. If it turns out that the difference between treatments is less than that margin, your probability of correct selection, of course, is going to be less, but at least there is some statistical basis for going with the one that looks numerically better.
It does not allow for an estimation of the difference between the two treatments, or it doesn’t pay any attention to it, so if treatment A is numerically best but it’s numerically best by .01 percentage points, we don’t care. We’re going to pick Treatment A regardless of whether it’s more costly or has a similar side effect profile or whatever.
And there’s no evidence unless you include that control arm that the best treatment is actually worth studying. It may still be that it’s the best out of a bunch of duds, but it’s the best of what you studied.
Perhaps the best use of the selection design is to make it sequential, so that you combine the selection in Stage 1 with either a superiority test or a futility test in Stage 2. And again, these are adapting to the information that you get after Stage 1. You’re picking what looks best and then you would move that forward.
A Two-Stage Design for a Phase II Clinical Trial
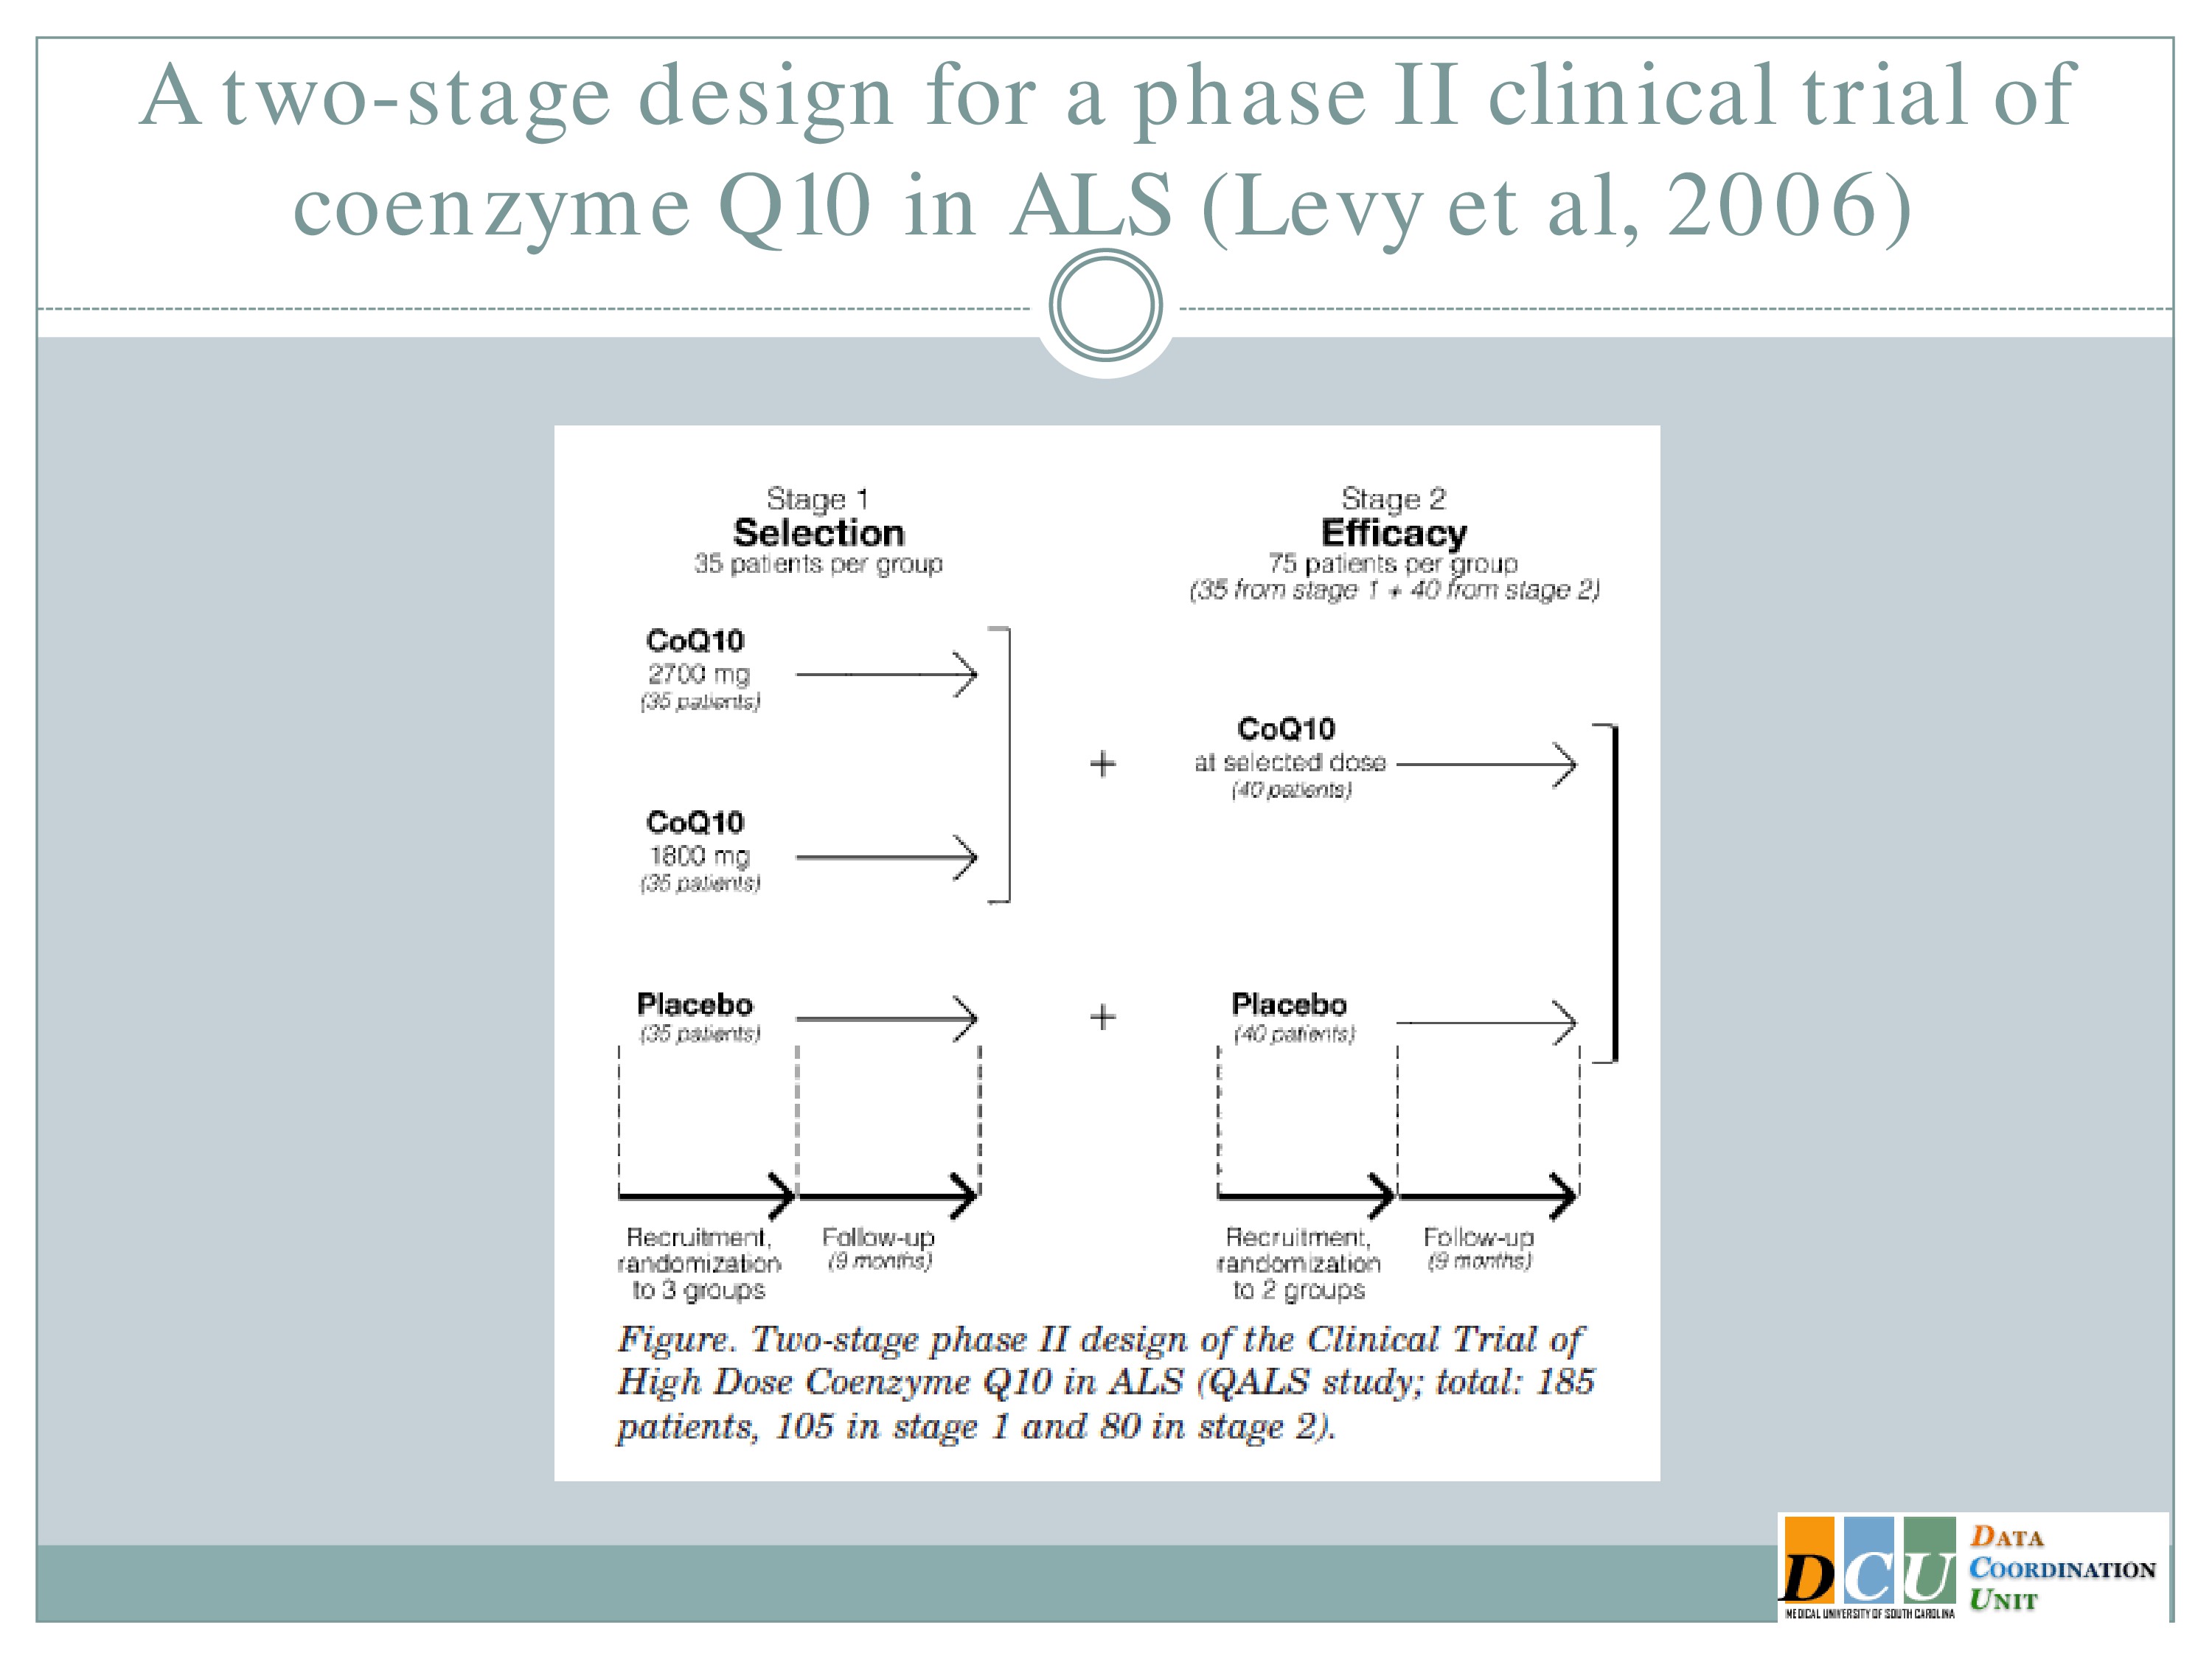
And this has been implemented actually in ALS. The study here published by Levy, et al. looked at two doses of co Q10 and a placebo in Stage 1 and this study was designed so that at the end of Stage 1 they selected among those two doses, carried that one forward, carried the placebo forward, and then did a superiority test at the end of Stage 2.
So it’s sort of combining these components of figuring out which treatment parameter is working and establishing that it’s definitively working.
Early Two-Stage Design with Adaptive Randomization
And now I’m going to spend a few minutes talking about a relatively new design that — so I guess my disclosure is that this was proposed by one of our students.
So it basically combined Phase 1 and Phase 2, in a situation where toxicity is not really an issue. We’re not really concerned about the safety of the intervention; we’re really interested in establishing which dose has the best efficacy while maintaining some level of safety control.
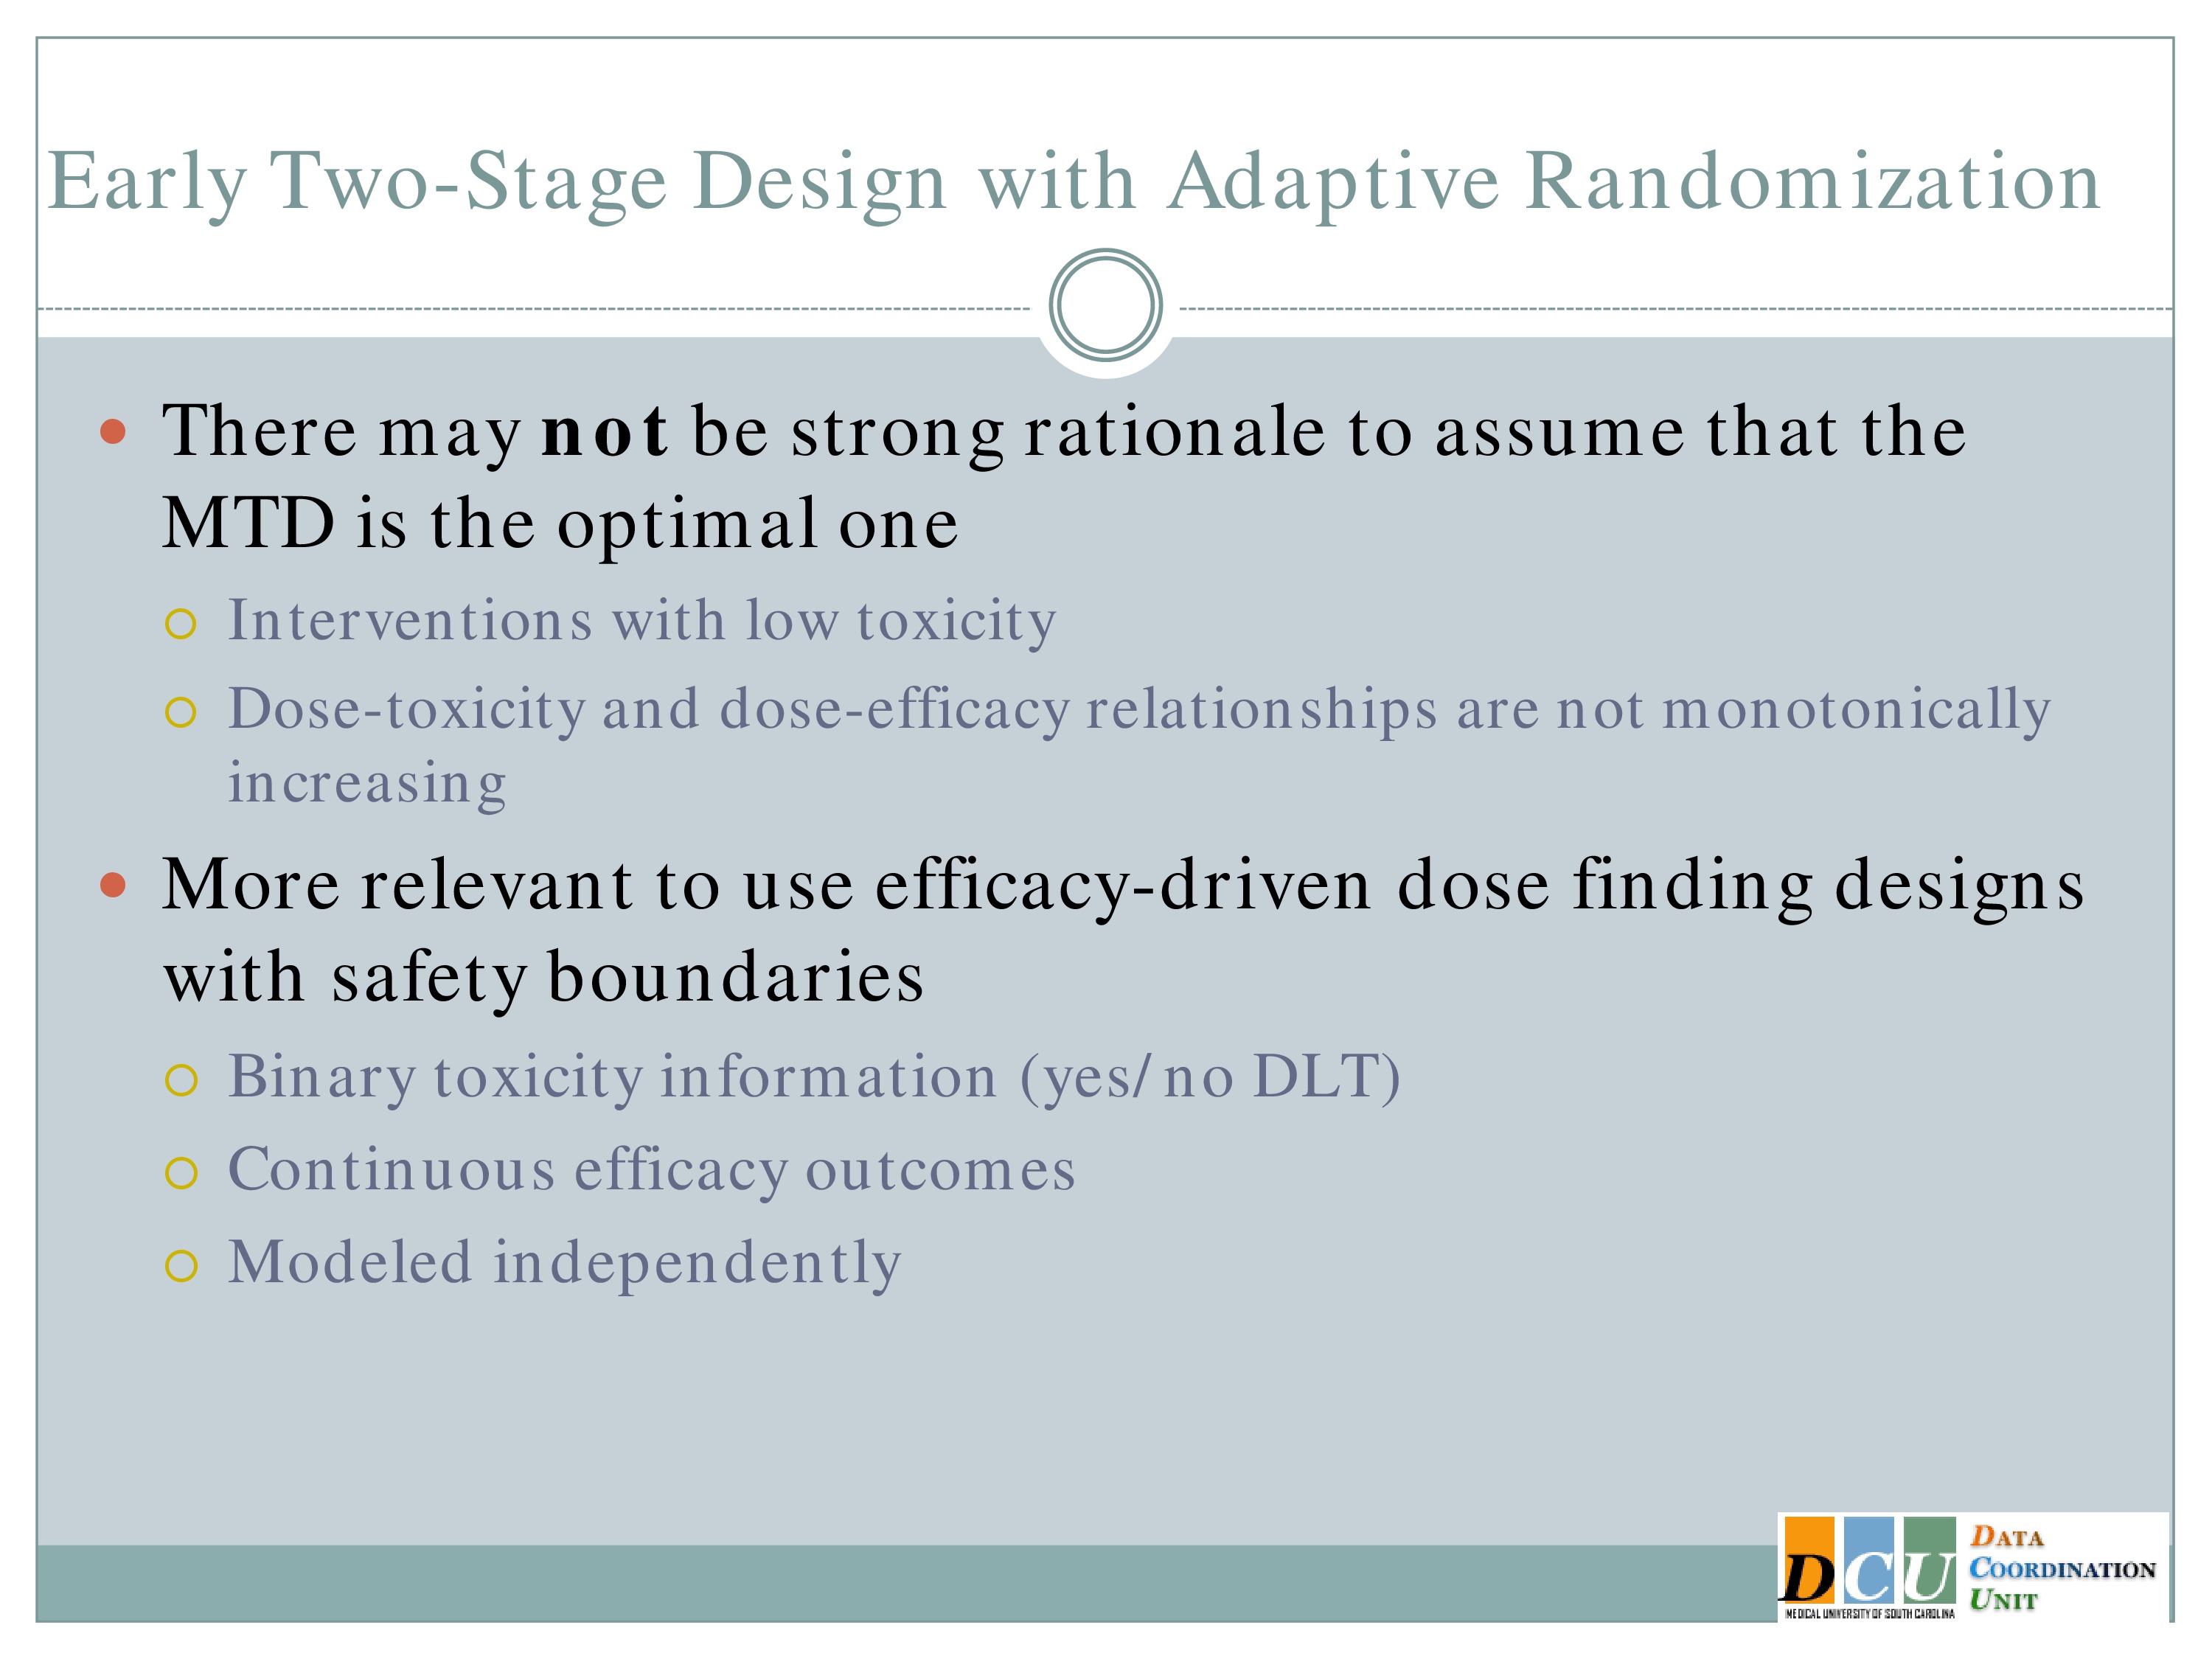
So in many cases there’s not strong rationale to assume that the maximum tolerated dose is the best dose. We know that there are some interventions that just have inherently low toxicity. We also know that there are some interventions where those curves that I showed you which looked very nice and were strictly increasing, may not actually be increasing. They may look U-shaped and you’re trying to figure out where that maximum in the curve is.
In those cases it’s more relevant to base the design on efficacy and just keep safety boundaries in mind. And so in the design I’m going to show you now, we’re using binary toxicity information still, so you could dichotomous variable indicating fatigue or no fatigue, but your outcome is continuous and they’re modeled independently.
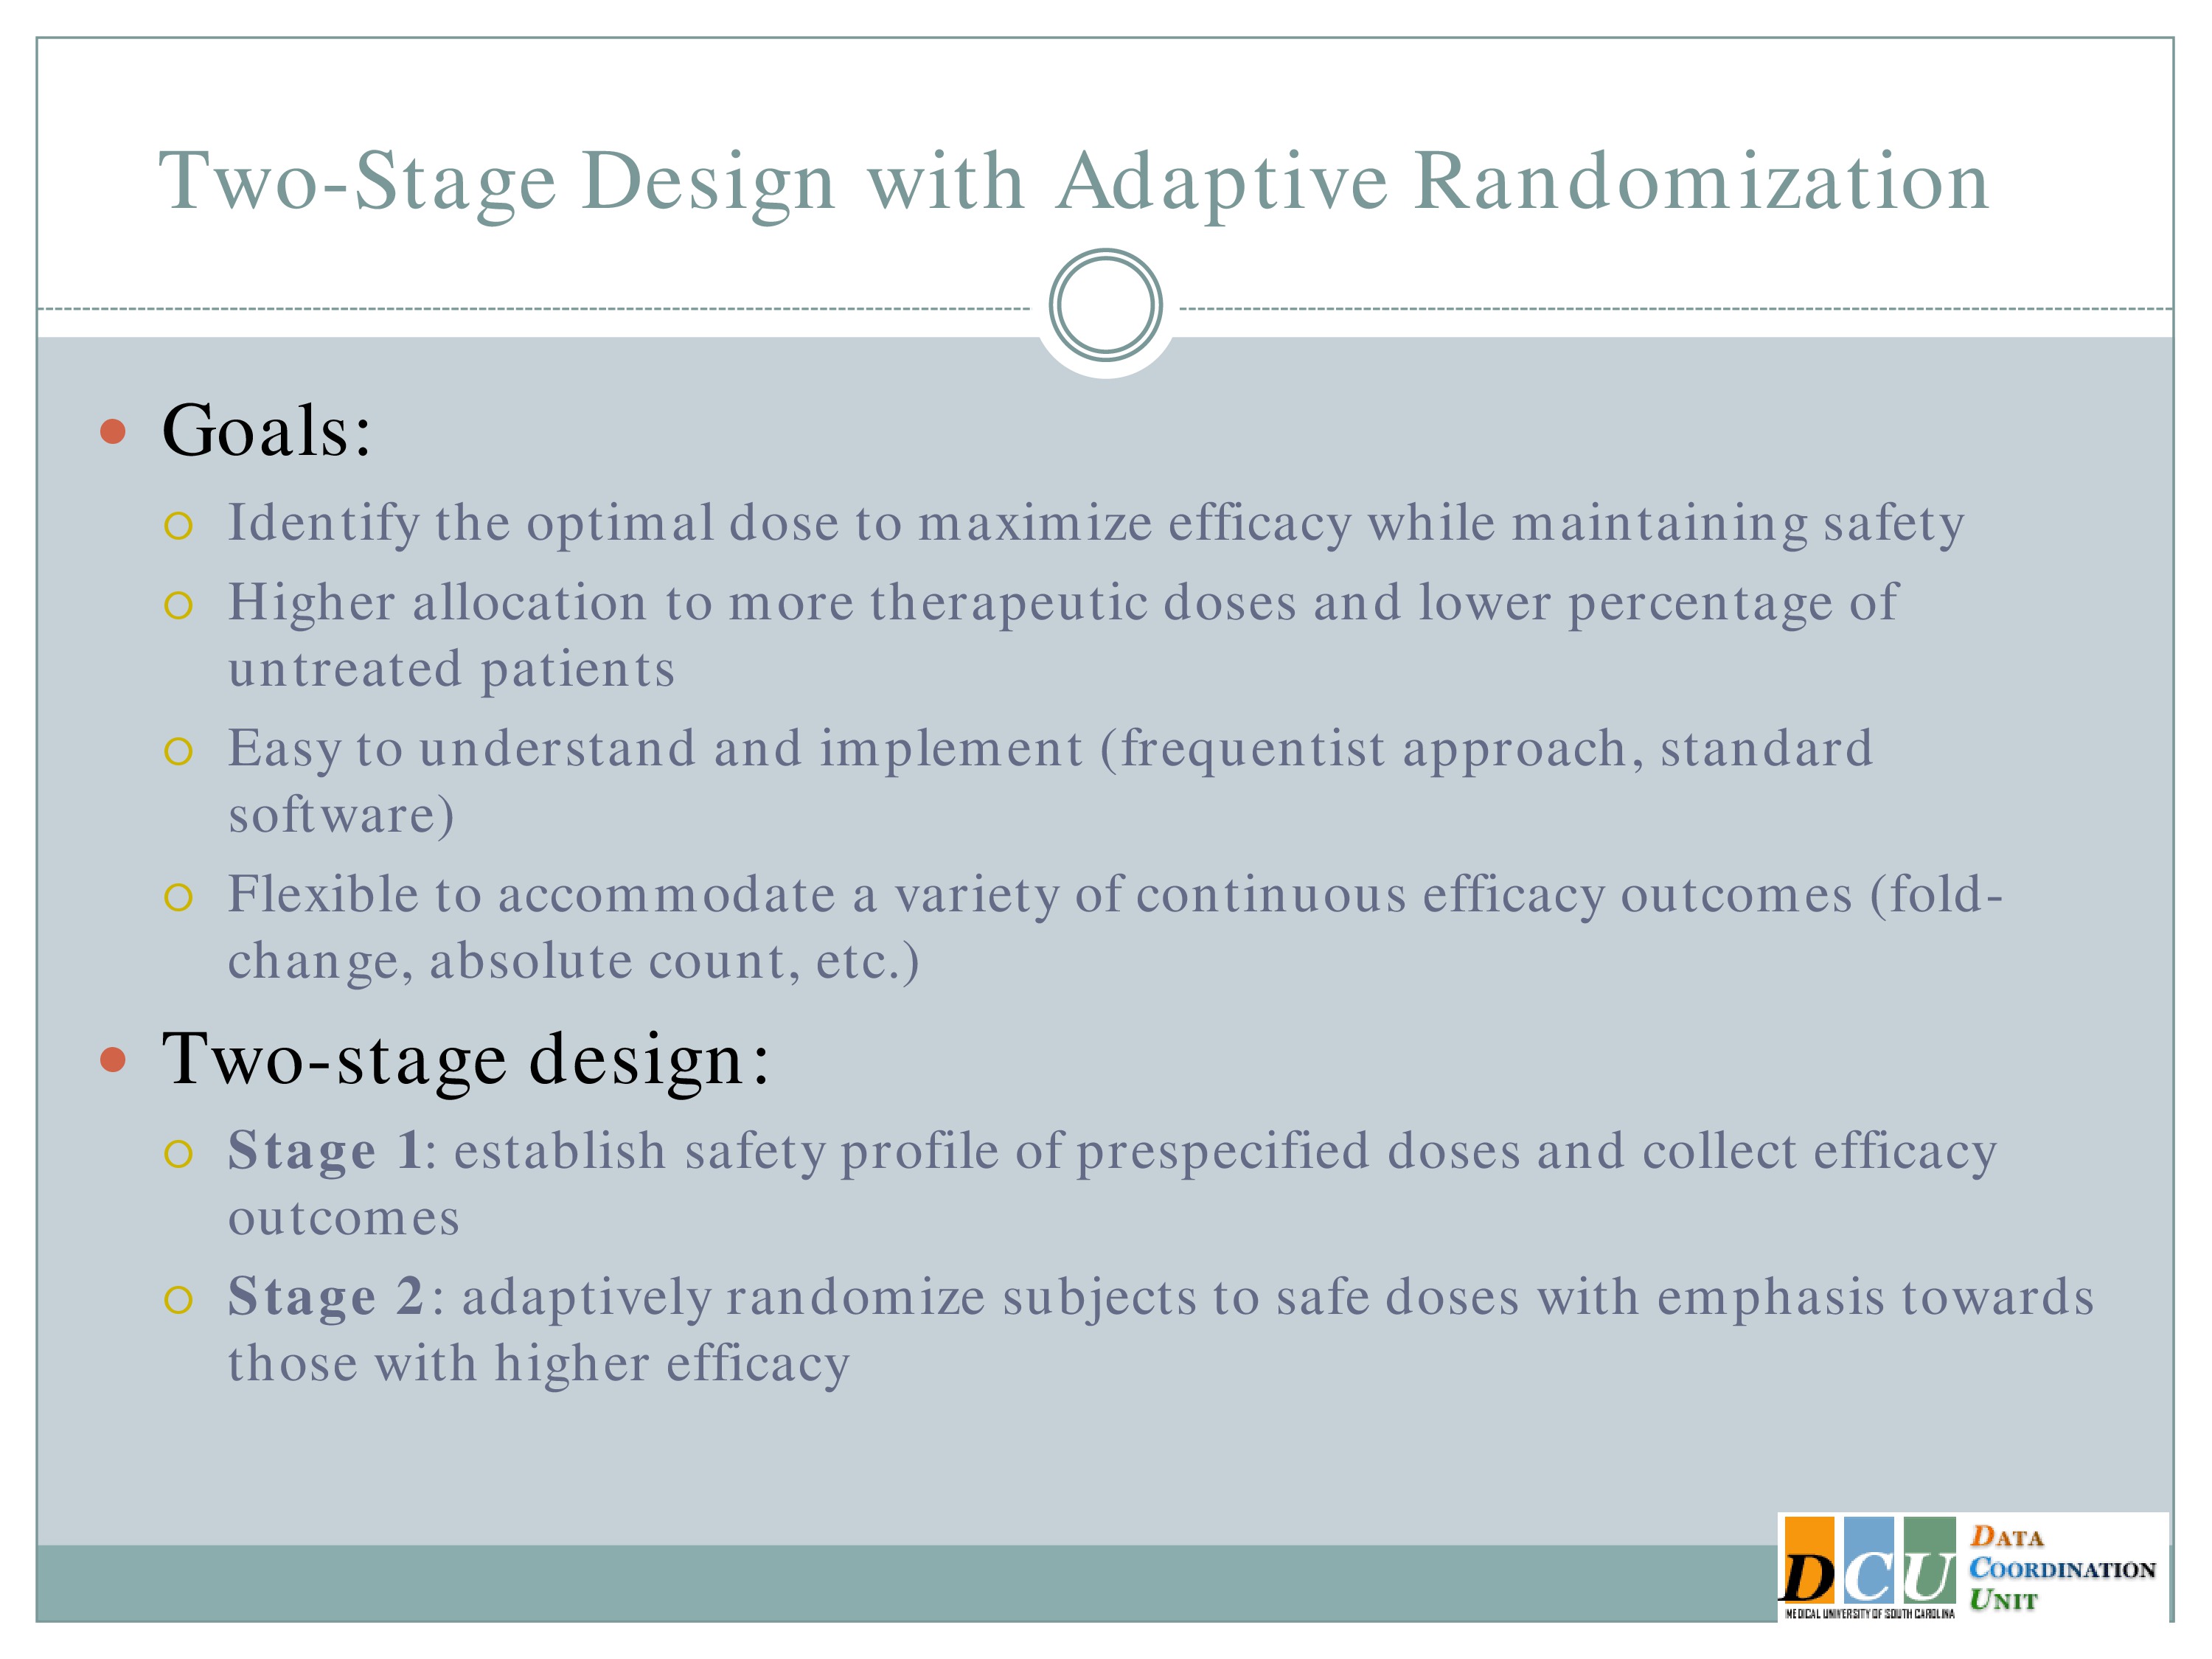
So our goal here is to identify the optimal dose to optimize efficacy and we want there to be a higher allocation to more therapeutic doses. We want a lower percentage of untreated patients, we want a design that’s easy to understand and easy to implement, and we want it to be flexible enough to accommodate a variety of outcomes.
The work here has been done for continuous efficacy outcomes; it could easily be modified to alter other forms of outcome as well.
And the design has two stages. In Stage 1 we’re going to establish the safety profile of the prespecified doses and collect efficacy outcomes. And this may look like a 3+3 design or it may look like a comparison of a number of interventions which are already being used, and just making sure that what you’re observing is not unacceptable.
And then in Stage 2, we’re going to adaptively randomize subjects to safe doses, which an emphasis towards those with higher efficacy.
What in the world does that mean? In a randomized control trial, in most cases, what we’re trying to achieve is an equal allocation of subjects on both treatment arms.
In this case, I’m saying I don’t want equal allocation. I may have five or six different treatment arms, I don’t want them to be equal. I want more subjects assigned to the arms that look like they’re doing something.
So that probability, when you’re randomizing a subject, is not going to be a half, it’s going to adapt to the efficacy outcome as it accumulates.
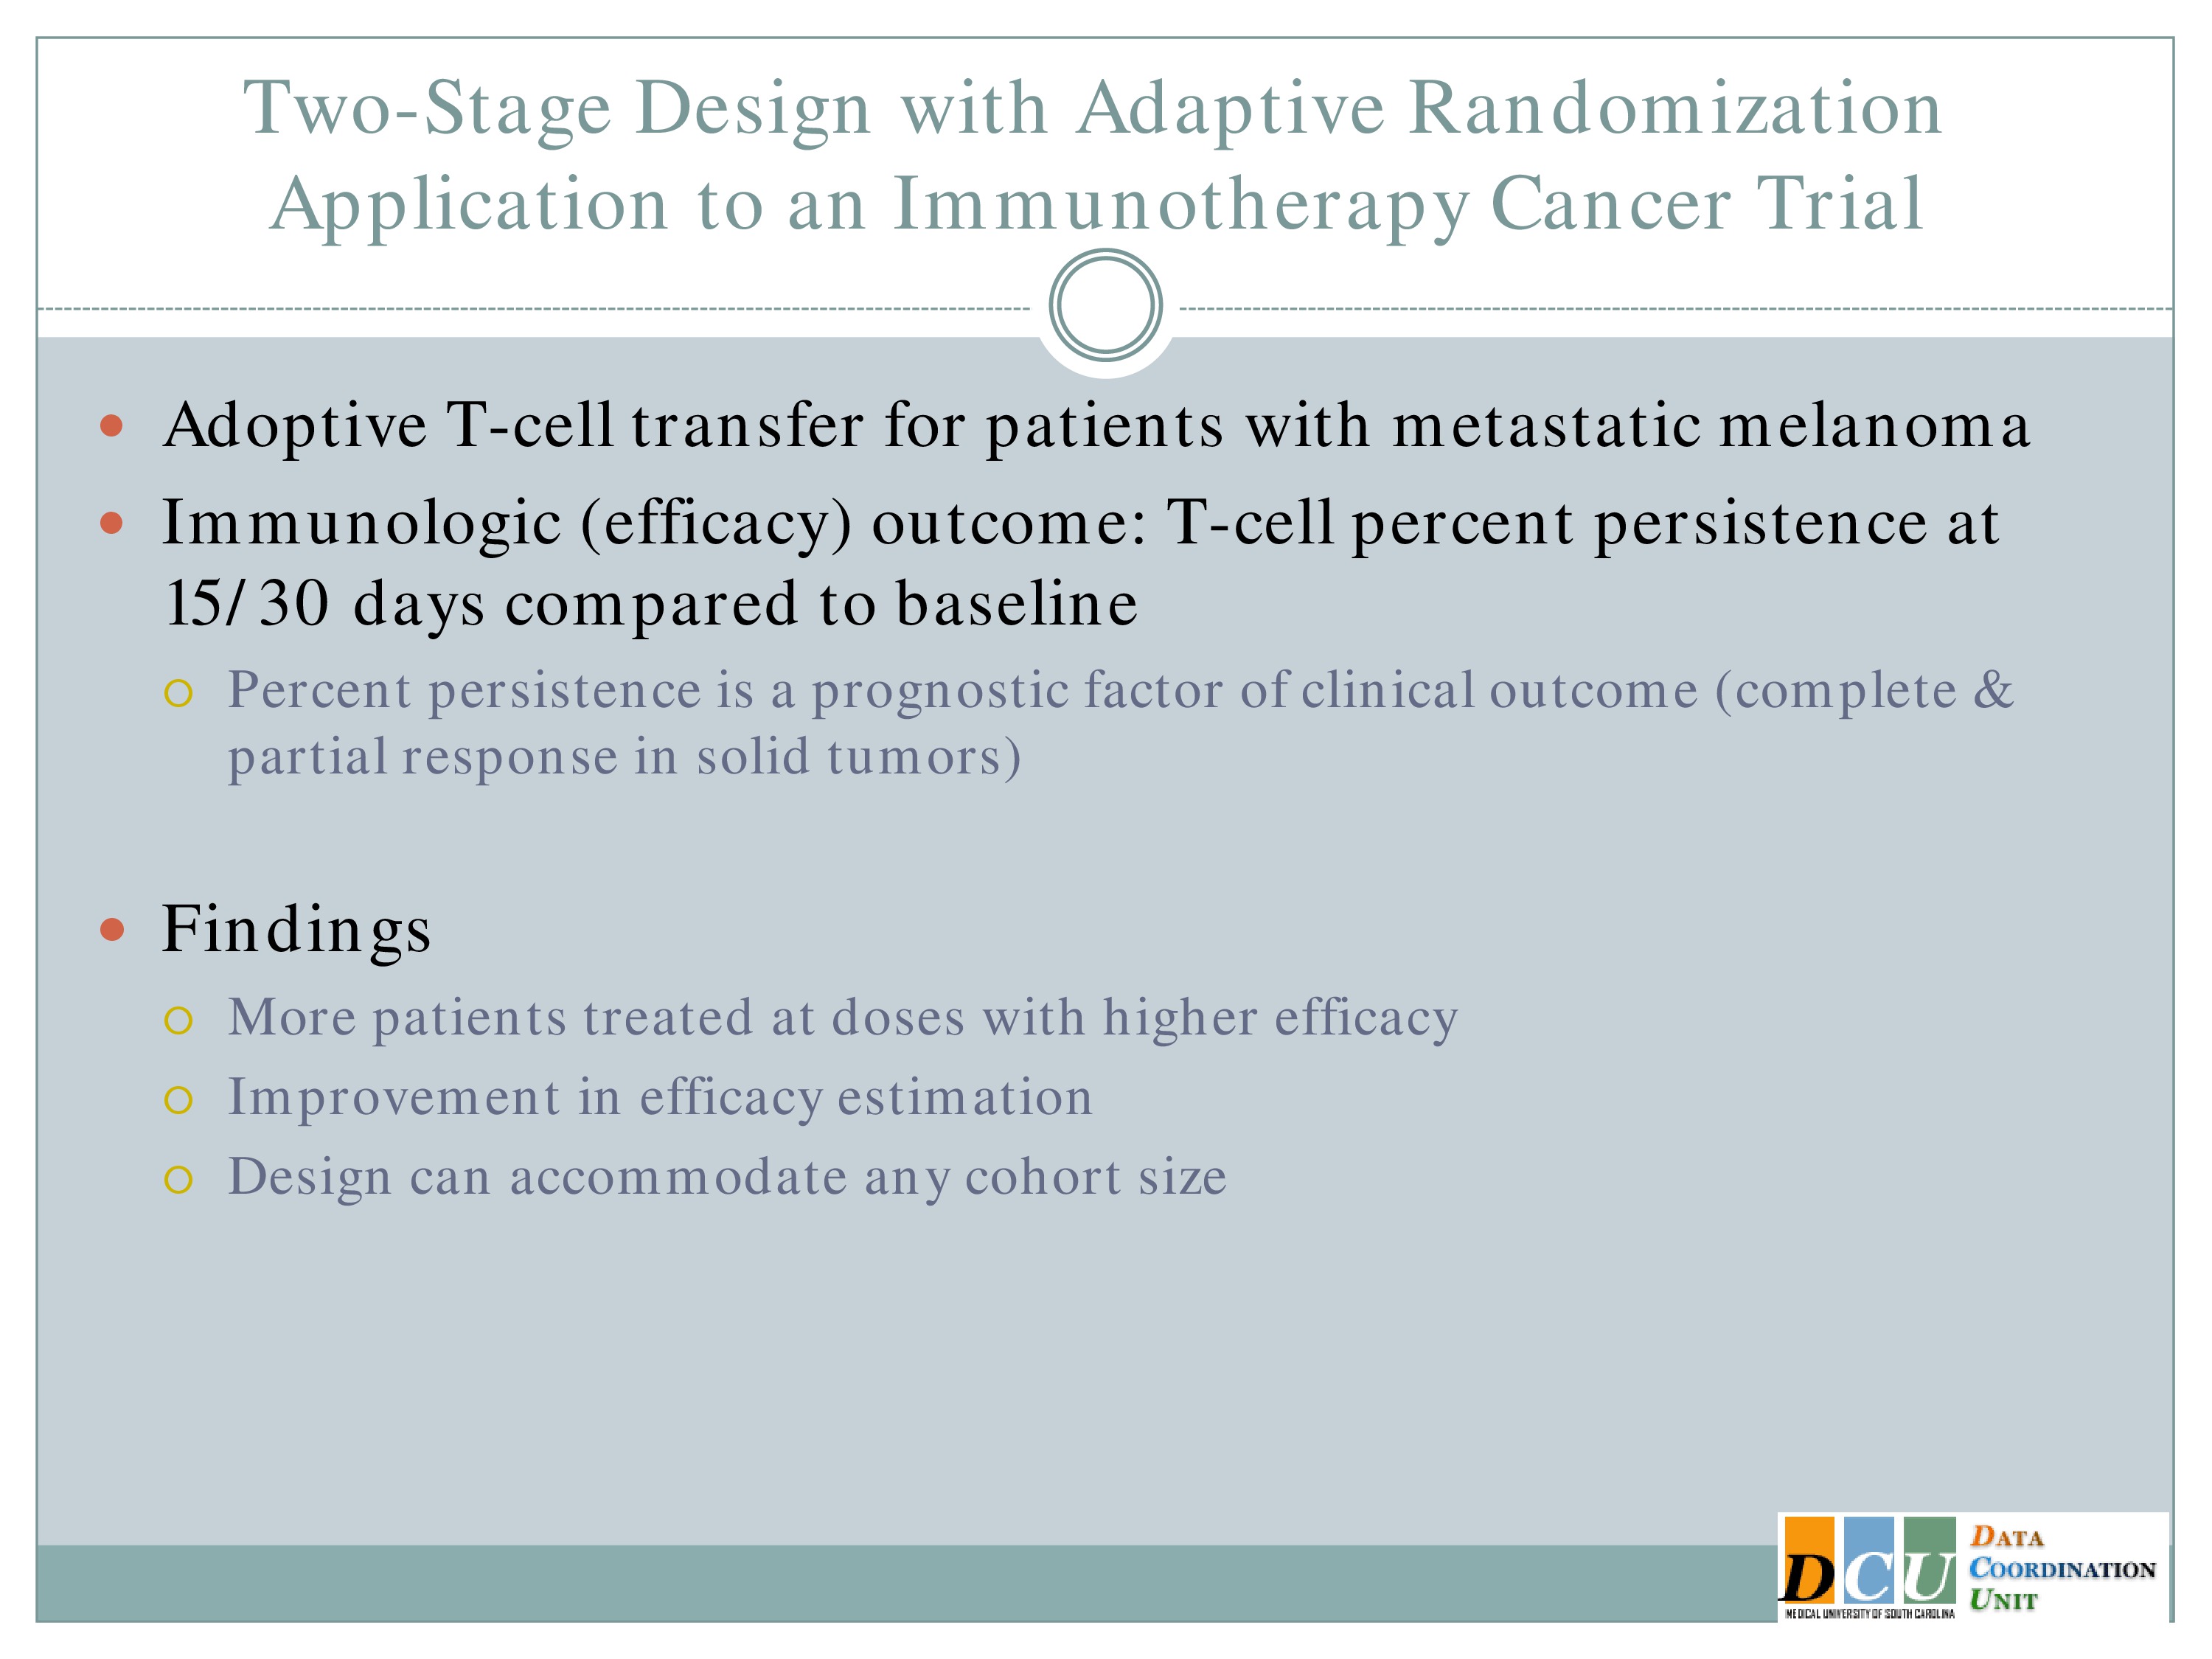
I haven’t shown you the formula. If anybody’s interested, I’m happy to talk about it, but this study was designed for — this design was intended for patients with metastatic melanoma, and the intervention here is an adoptive T cell transfer. So you’re taking the patient’s own cells, modifying them a little bit and then re-administering them, so we don’t anticipate there to be a huge problem with toxicity in this patient population.
And what we really want is to figure out how many of these T cells do we need to adjust in order to have the best persistence outcome that we can manage.
And what we found in simulations is that, as you would expect, because we’re modifying the randomization probability, more patients are treated at the doses with higher efficacy than with the ones at lower efficacy.
There’s actually an improvement in efficacy estimation that goes along with this, and the design can accommodate any cohort size, so if you don’t like treating three subjects initially in Stage 1, you can treat 5, you can treat 10, you can treat however many you want to.
And of course, the Stage 2 sample size will depend on how many subjects are randomized to each of those doses.
Closing Thoughts
Exploratory Phases Take Time
Adaptive designs, exploratory phases take time by themselves, and we have seen in many disease areas what happens when we skip that time. We wind up wasting time in a randomized control trial with an intervention that really never had a chance.
The adaptive designs that I’ve talked about here, I wish I could say that they’re going to save you time. In many areas we argue that they will.
They may in the actual conduct of the study, but you have to take into account the planning time that goes along with this. Those CRMs, as I said, the simulated trials that I presented, those simulations take time to set up, to run, to understand the output, to digest how many subjects does this really mean that we need and that sort of information. So there is a lot more upfront planning for these adaptive designs than for some of your more traditional designs.
But that time can provide valuable information. If it can help us find the optimal dose, it may take us a little longer to get there, but at least we’ve gotten to an answer, because we’re testing a dose that we know has the best chance of working.
It’s going to give you information in the safety assessment, it’s going to provide preliminary evidence of efficacy, and it can’t be underscored how important it is to get some practice with the logistics of your interventions when you’re administering them, how to handle the blinding if it’s possible, how to handle the randomization, what sort of training do your assessors need.
All of this information can be achieved during these exploratory phases, and so we need to train ourselves not to think about these explorations wasting time, but about what we can gain from doing them appropriately.

