

The following is a transcript of the presentation video, edited for clarity.
I’m going to begin just by placing PROs in the context of clinical outcome measures, measurement for aphasia in general, and then I’ll spend a little bit of time discussing limitations of existing measures for aphasia with a focus on the issue of construct dimensionality. After that, we’ll present the results of the initial field trial of the ACOM, as well as the results of the computer adaptive test simulation of the item bank, and then wrap it up with a discussion of the future direction of our work within the context of the challenges facing our profession to demonstrate the value of our services.
Increased Interest in Patient-Reported Outcomes
So the concept of PROs grew out of the literature on health related quality of life. For well over a decade now patient-reported outcomes have been an active topic of discussion among government regulatory agencies, the pharmaceutical industry, and medical outcomes researchers.
In 2003 a working group of representatives from industry, academia and government defined patient-reported outcomes as the patient’s assessment of a health condition and its treatment. It defined health related quality of life, more narrowly as the patient’s evaluation of the impact of a health condition and its treatment on daily life. Patient-reported outcomes are complementary to other kinds of outcomes which may be classified according to the source of the information that they represent.
So by 2006 the FDA had issued guidance to pharmaceutical and medical product developers regarding the use of PROs to support labeling claims, and CMS had invested in the health outcome survey, which is a patient-reported measure that managed care organizations participating in Medicare Part C are required to use. And further evidence of the increasing importance being placed on patient-reported outcomes is exemplified by the development of the Continuity Assessment Record Evaluation or CARE instruments that are part of the CMS sponsored project to develop alternative outpatient therapy payment models based upon the needs of beneficiaries and the effectiveness of services rendered as measured to a large extent by patient-reported outcomes.
Among the factors driving the move toward the use of patient-reported outcomes in clinical trials and in other context are increasing patient empowerment driven in part by increased access to information via the Internet, an increasing awareness and appreciation of the value of the patient’s perspective in both diagnosis and in treatment, an acknowledgement that physiological and clinical measures frequently fail to capture important aspects of health outcomes, and perhaps most importantly, as we heard I think on several occasions earlier today, policy-driven changes in healthcare payment models.
Limitations of Patient-Reported Communication Outcomes
So at the time we began our work on the ACOM, back I think 2003, patient-reported measures of communicative functioning were limited to brief subscales of lengthy multi-component health status assessments, such as Duncan’s stroke impact scale, Williams’ stroke survivor or stroke specific quality of life scale, and the BOSS, the burden of stroke scale. And these instruments were developed to measure a broad range of functional outcomes in stroke survivors and so their individual subscales necessarily contained a limited number of items, making them prone to ceiling and floor effects and limiting their precision for assessing any given functional domain, such as communication.
Now also available at the time was the activity measure for post-acute care applied cognition scale, which contains content related to communication, as well as aspects of cognition. And the impact applied cognition scale represented a real step forward at the time in that it was developed using modern scaling methods based in item response theory. It contained a relatively large number of items targeting a single construct, and it was available in computer adaptive test format, potentially lessening a response burden of the instrument. However, because the AM-PAC applied cognition scale conflates the assessment of communicative functioning with other aspects of cognition we had concerns about its use in stroke survivors with aphasia.
So the 10-item short form of the AM-PAC applied cognition scale asks about activities requiring a range of abilities, including auditory verbal communication, reading and writing, money management, and other executive and problem solving abilities. And a central question is whether it’s valid to model these items as responding to a single undifferentiated construct or whether they’re determined by distinct, though perhaps correlated factors. And this really is an important question because the IRT models, as we have heard many times today, the IRT models that underlie much of the recent progress in patient-reported outcome measurement makes strong assumptions about the dimensionality of the items in a given scale.
Now when we examined the literature describing the development of the impact we believe that it had limitations that could have practical consequences for measuring outcomes in persons with aphasia. Specifically, the initial factor analytic work reported by Haley and colleagues resulted in an item pool that was comprised almost entirely of communication items alone, but in subsequent work Coster and colleagues included memory, problem solving, and other cognition items without re-evaluating the factor structure.
Another limitation pertained to how differential item functioning or DIF was assessed. Differential item functioning analysis asks whether items have in various locations on the trait level scale in different subgroups with the same total score. And when a putatively unidimensional test reflects an additional dimension that is substantively related to membership in a given subgroup and DIF is found for that subgroup, that’s an indicator of multidimensionality. An example of subgroups like this would be left hemisphere stroke survivors, who one might expect to have difficulty or be differentially impaired with respect to cognition, versus left hemisphere stroke survivors who one might expect to be differentially impaired with respect to communication.
So when we examined the differential item functioning analyses reported for the impact applied cognition items we found that they were based upon heterogeneous samples of three broadly classified groups, including patients with neurological conditions, musculoskeletal conditions, and complex medical conditions. When you consider that the neurological group alone included patients with stroke, Parkinson’s Disease, multiple sclerosis, TBI, spinal cord injury, and neuropathy, many of these groups not having communication disorders at all, we hypothesized that had the differential item functioning contrasts been evaluated in more homogeneous subgroups, for example, left hemisphere versus right hemisphere stroke survivors, that different results might have been obtained.
Patient-Reported Cognitive and Communication Functioning: One Construct or Two?
These considerations led us to conduct a study asking specifically whether patient-reported cognitive and communicative functioning can be validly measured as a single construct using a single unidimensional scale, or if there were two distinct constructs requiring separate scales or an explicitly multidimensional measurement model.
To address this question we conducted a secondary analysis of data originally collected during the development of the burden of stroke scale. In the next several slides I’ll present selected results from a 2010 report that’s published in the Archives of PM&R that address this question.
Cognition Domain ScaleHere we show the burden of stroke scale, cognition and communication domain scales, which you will note have substantial overlap in item content with the AM-PAC applied cognition scale.
We analyzed the responses to these items in 176 unilateral left hemisphere stroke survivors and 140 unilateral right hemisphere stroke survivors. And as part of this study we fit the data to a Rasch partial credit model and 11 of the 12 items showed adequate fit according to the same criteria used to evaluate the impact applied cognition scale. And one item, the item write a letter, showed significant misfit and so that item was excluded from further analyses.
Going forward now I’m going to focus on the results of our differential item functioning analysis, as well as some additional tests that we conducted to assess the practical impact of the differential item functioning and the multidimensionality that we found.
Measurement Models
For the purposes of presenting the differential item functioning results it’s important to understand that Rasch and IRT measurement models place both items and persons on a single latent trait scale where persons could have more or less of the trait in question and items require more or less of that trait to achieve a certain score.
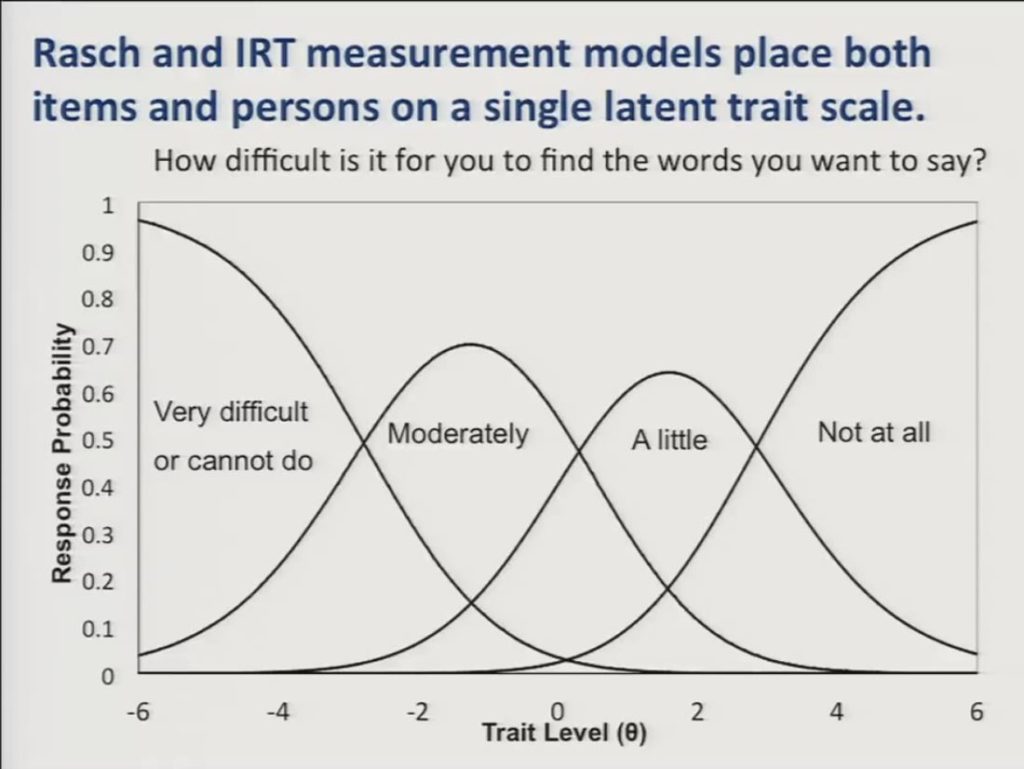
So here we show a graph or I should say we show Rasch partial credit model category response curves for a single item. How difficult is it for you to find the words you want to say? And trait level is represented along the horizontal axis and the probability of responding in a given category is displayed on the vertical axis. And you can see that as patients move up the trait level scale they’ll be less likely to respond to this activity as being very difficult, and correspondingly more likely to respond that it’s moderately a little or not at all difficult.
Again, it’s important to note that each response category of the item is also represented with a location on the trait level scale, so that these locations will be higher on the scale for items that ask about difficult activities, and lower on the scale for items that described easier activities.
In the context of this measurement model differential item functioning analysis asks whether items have the same locations on the latent trait scale in different subgroups of patients after differences in the overall trait level between the subgroups has been accounted for.
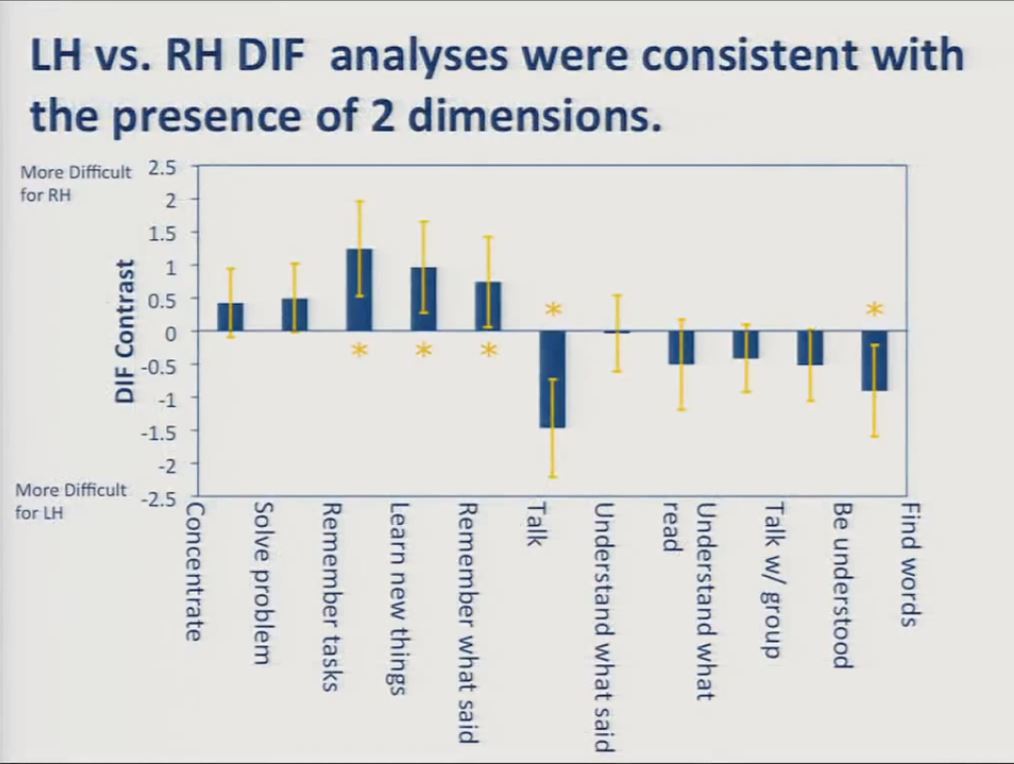
Let’s look at the results of our initial differential item functioning analysis on the combined 11-item cognition and communication scale. The item content you see is here on the x axis, and the DIF contrast is here on the y axis. The DIF contrast, again, the difference in item location between the two subgroups. Shown here on the vertical axis.
Values on the top indicate item content that was more difficult for the right hemisphere group and values on the bottom indicate content that was more difficult for the left hemisphere group. You can see that almost half the items represented with these asterisks showed significant differential item functioning in the expected direction, with the cognition items obtaining location estimates indicating that they were relatively more difficult for the right hemisphere stroke survivors, and the communication items obtaining location estimates indicating that they were more difficult for the left hemisphere stroke survivors.
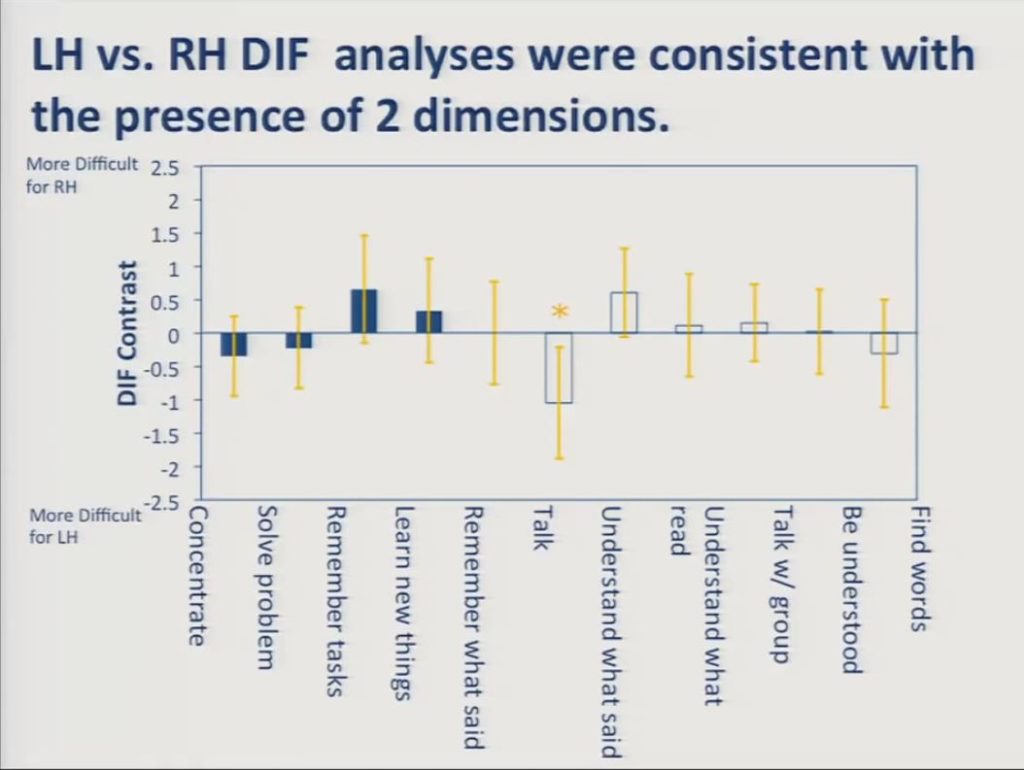
In contrast, when we fit the cognition and communication scales to separate Rasch models, the DIF goes away for all but this one item.
This is because DIF analysis asks whether a given item location is the same for individuals in two different groups who have the same total score. When that total score is restricted to cognition items on the one hand, or communication items on the other hand, the items function invariantly across the groups. It is this measurement invariance that’s required for valid application of these sorts of measurement models.
As I indicated earlier, we also conducted two further sets of analyses to assess the practical impact of the multidimensionality revealed in the preceding DIF analyses.
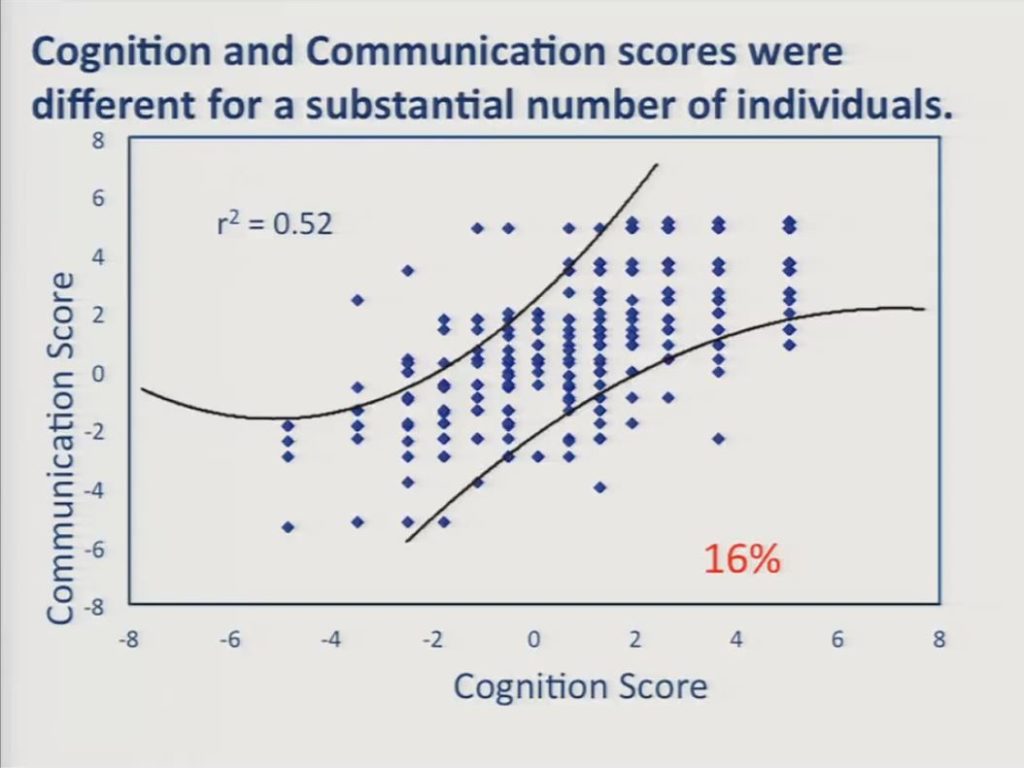
First, we estimated a cognition score and a communication score separately for each participant and cross-plotted him. These curved lines represent approximate 95% confidence intervals about the assumption that scores on the two scales were equal. And despite the relatively high correlation between the two scales, a substantial number of individuals, 16%, obtained significantly different scores on the two scales. Specifically, we had 30 patients down here in the lower right who had worse communication scores than cognition scores, and 28 of those 30 patients were left hemisphere stroke survivors. And we had 22 patients in the upper left here who had worse cognition scores than communication scores, and 15 of those were right hemisphere stroke survivors.
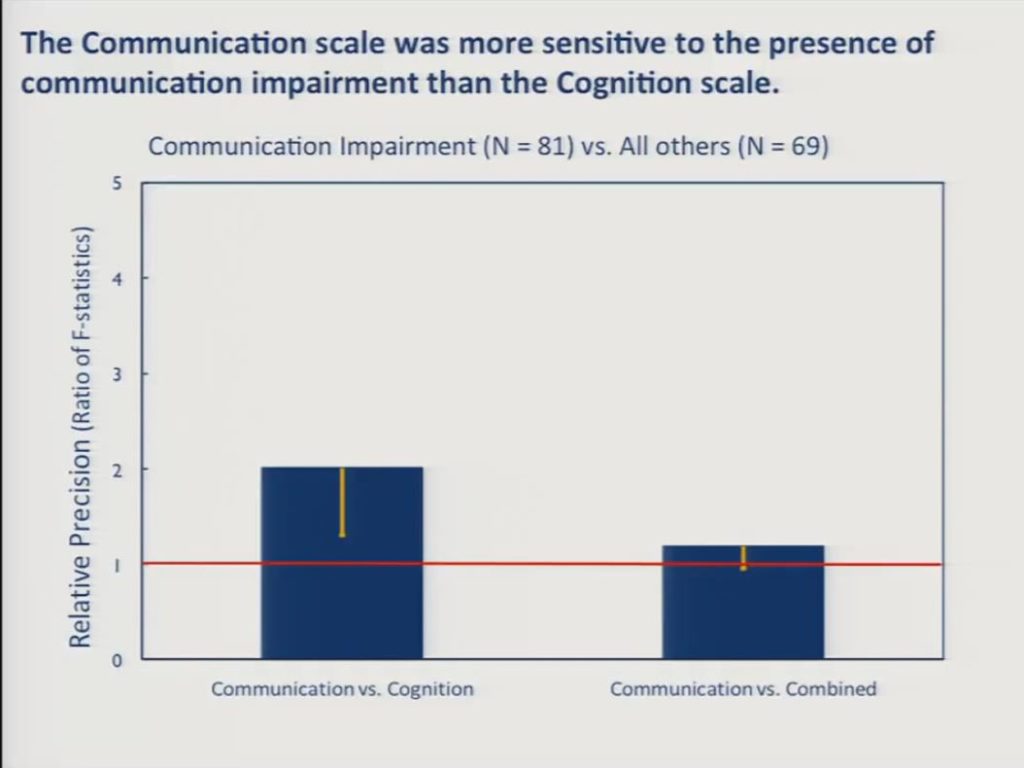
Finally, we asked whether the separate scales were more sensitive than the combined scale to between group differences in the presence versus the absence of cognitive impairment on the one hand and communication impairment on the other. We had 81 patients in the sample who were diagnosed as having aphasia, apraxia or dysarthria, and an additional 69 who were free of any communication disorders. And in this slide we can see that the communication scale was significantly more sensitive than the cognition scale to this between group difference and the communication scale approached significance over the combined scale, but this is not a statistically reliable difference here between the communication scale and the combined scale.
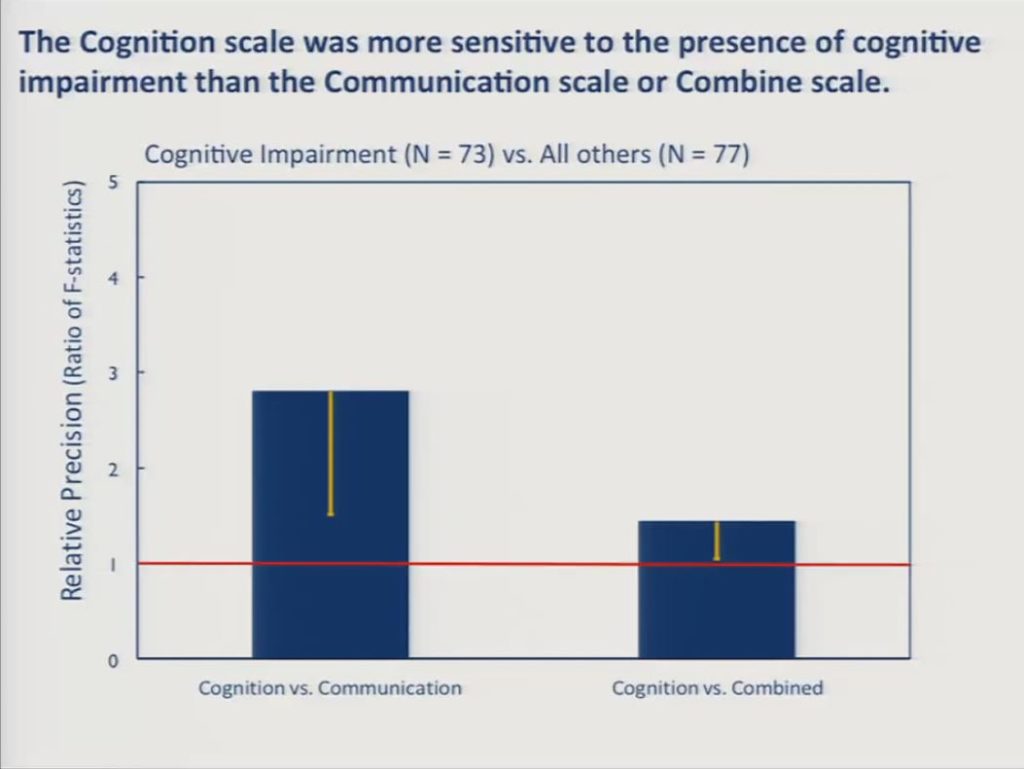
Likewise, a subsample of 73 patients were diagnosed as having cognitive impairment other than aphasia and 77 were diagnosed as being free of cognitive impairments, and here the cognition scale, the BOSS cognition scale was significantly more sensitive to the communication scale and significantly more sensitive than the combined scale.
Aphasia Communication Outcome Measure (ACOM)
These findings led us to conclude that to capture patient-reported communicative functioning in stroke survivors with aphasia that there was a need for an assessment focused on communication to the exclusion of other cognitive functions. And so it was within this context that we set out to develop an IRT calibrated item bank that could be used to support computerized adaptive or static paper and pencil assessment of patient-reported communicative functioning.
We began by developing a large pool of assessment items describing everyday listening, speaking, reading and writing activities. The item development process is described in a 2008 Aphasiology manuscript, but let me just briefly mention that prior to Kathryn’s talk a few moments ago I had in here that we followed best practice in developing our items. But after listening to Kathryn’s talk, I think she demonstrated best practice, although we did many of these things in our item development process, including to ensure the content relevance and representativeness of the items including patients with aphasia, their caregivers, clinical providers and an expert panel of aphasiologists throughout the whole item development process.
I’m not going to spend any more time on that particular aspect of our development. Those procedures are in the literature. I’m just going to note that we designed our items to be answered by the person with aphasia or a surrogate who knows them well and that all items are responsive to this same four-point scale.
Trained research staff collected responses to candidate items from 329 community dwelling persons with aphasia and their surrogates using an interviewer assisted administration format. So each item was displayed to participants on a computer screen. Participants were permitted to give their responses verbally by pointing to the screen or both. And in instances where there was any uncertainty about the intended response we had a standardized procedure by which the examiner confirmed the response by repeating the item content again and the participant’s response back to the participant while pointing out the response category on the screen just to verify the response.
Self vs. Surrogate-Reported Communicative Functioning
Before I discuss the patient-reported data I just want to take a moment to discuss the extent to which patient and surrogate ratings agreed with one another. This came up just a few moments ago, and it remains an issue in patient-reported outcome measurement in stroke survivors and in other clinical populations for whom the reliability of self-reports is questioned.
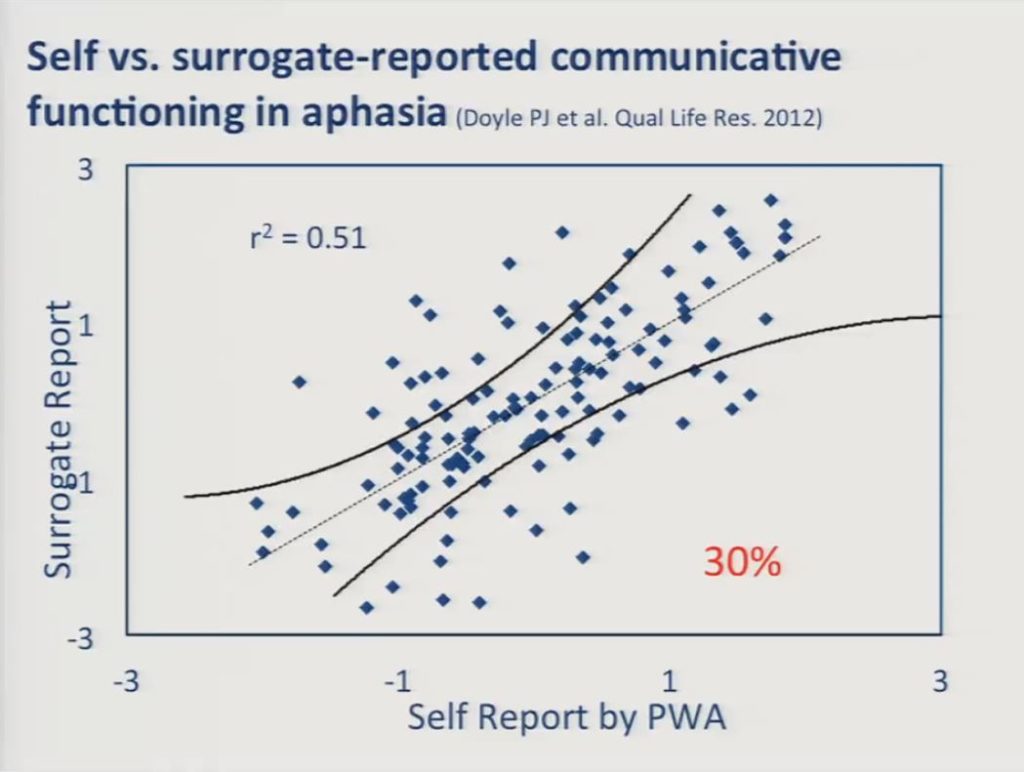
The scatter plot here reveals moderate agreement, we have an r2 of 0.51 between the self-reports of persons with aphasia and surrogate reports, but there was a significant number of discrepancies, that is 30% of the individuals there were significant discrepancies between the reports of the person with aphasia and the surrogate.
We conducted additional analyses, independent analyses of these, to see if the patient responses and the surrogate responses could be directly compared and measured using a common scale. This is analogous to the DIF issue that we raised earlier with respect to measuring cognitive and communication items on the same scale. What we found was that patient and surrogates could, in fact, be measured along the same scale, but that the costs in terms of validity and reliability were not acceptable, that is in order for us to construct scales that function invariantly, functioned invariantly for both the patient and the surrogates we had to exclude so many items that it negatively affected the resulting scale properties. So we concluded that while surrogate reports certainly represent a valid perspective on communication outcomes as measured by the ACOM, we believe that they should not be substituted for or used interchangeably with self-reports in persons with aphasia.
For those of you that are interested in more of the details of this work it’s published in a recent 2012 Quality of Life research report.
Factor Analysis and Item Reduction for Patient-Reported Data
For the remainder of our presentation I’m going to focus on the patient-reported data. I’m going to present a series of factor analysis results, again, focusing on the dimensionality issue and describe how we’ve established a working version of the ACOM item bank and then I’ll follow up with a presentation of the results of our simulation study before discussing the future directions of our work.
As noted earlier, IRT models that underlie computer adapted testing in other recent improvements in patient-reported outcome measurement makes strong assumptions about the dimensionality of its construct being measured.
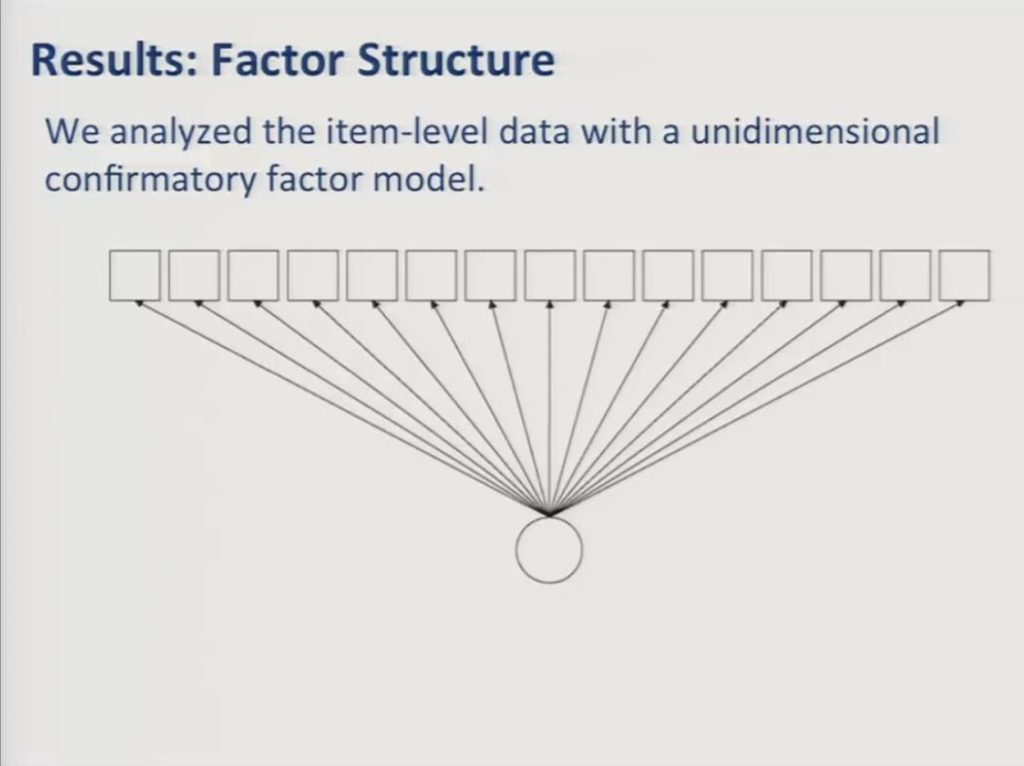
The simplest and the most commonly used IRT models assume that all items respond to a single unidimensional construct. So in this diagram the squares represent the observed item variables and the circle represents the underlying factor that they reflect. In this case patient-reported communicative in functioning. In our earlier presentation communication participation, it’s the underlying construct. The path arrows are similar to regression coefficients and they represent the strength of the association between the underlying factor and the item responses.
It’s the case – except that we saw a few cases here this afternoon that would argue against this – but it’s the case that frequently patient -reported item sets constructed to assess usefully broad domains of functioning with enough items to offer the possibility of reliable measurement fail to show adequate fit to a unidimensional model. And that was, indeed, the case with our data when we attempted to fit a unidimensional confirmatory factor model. The initial ACOM item pool obtained a root mean square value above 0.1 where less than 0.06 is a generally accepted criterion for adequate fit.
So, we followed up with an exploratory analysis and we used parallel analysis with simulated random datasets to determine how many factors to extract from the data.
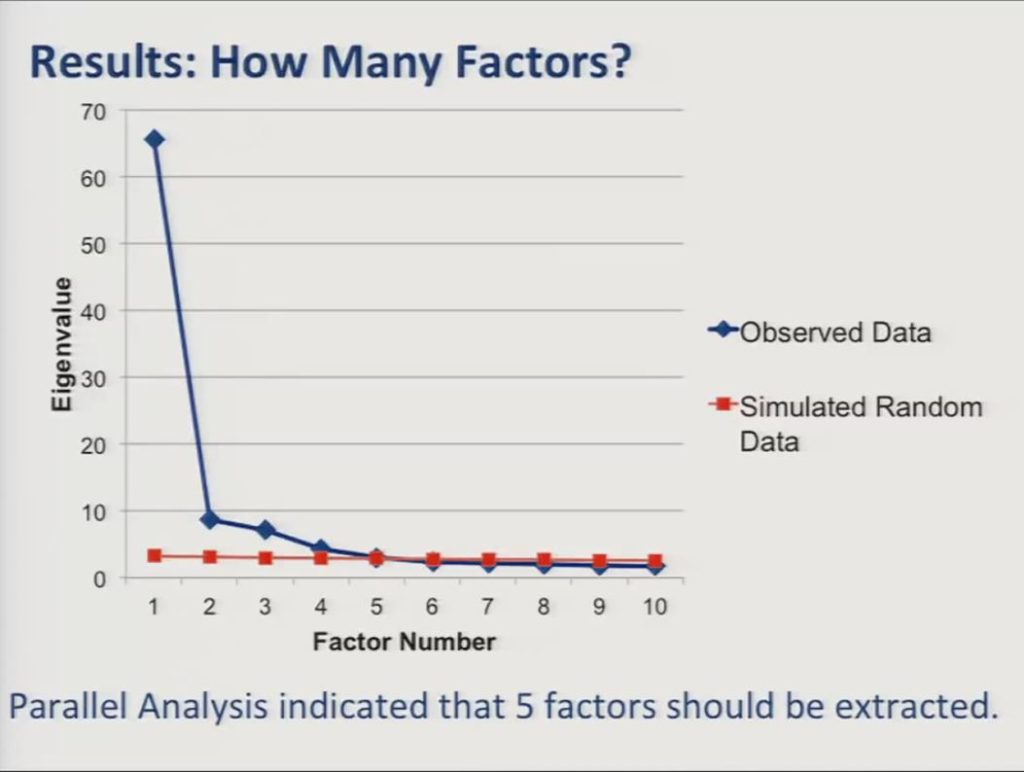
As you see in the screen plot here the parallel analyses indicated that we needed to extract five factors from the data.
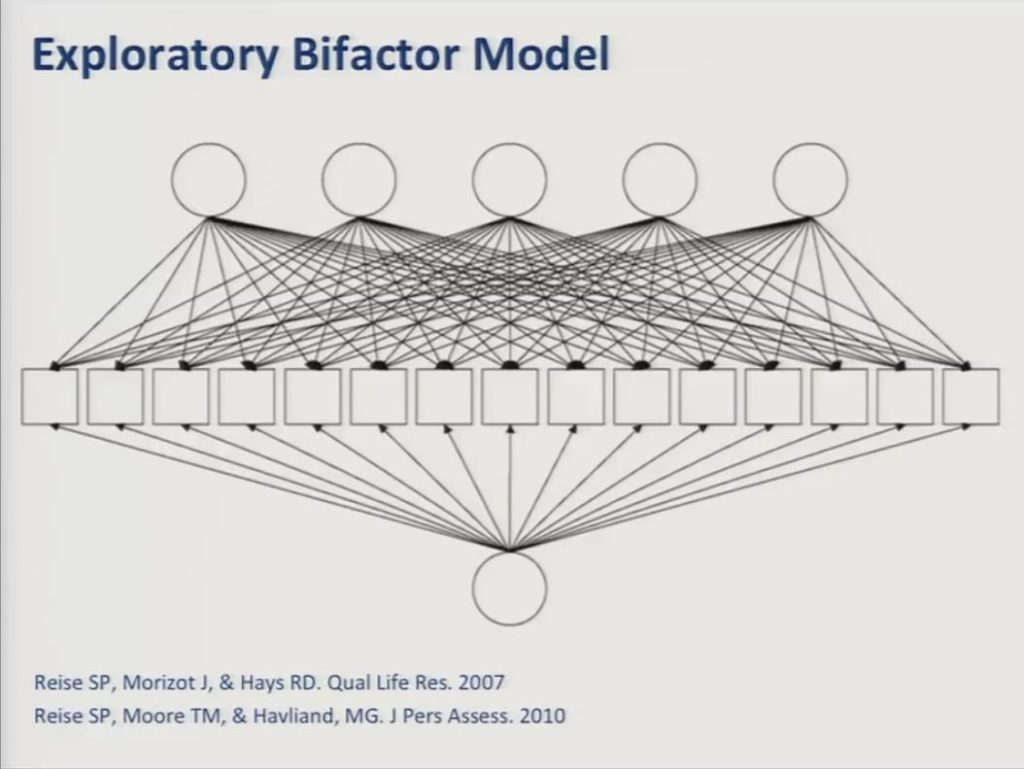
In fitting a five-factor model now to the data we selected a bifactor model, which is an approach that is increasingly being used in developing these sorts of patient-reported outcome measures.
An exploratory bifactor model proposes that each item responds to a general factor in one or more specific — or what are referred to as local factors — that account for variance shared among subgroups of items. And importantly the factors are all constrained to be uncorrelated with one another so essentially forcing the common variance that’s shared by all of the items into the general factor. So in practice these local factors are often defined by similarities in item content. For example, items having to do with writing as opposed to conversing, as opposed to naming.
One of the advantages of the bifactor model is that it can provide the desired single overall score which is useful for outcome evaluation, while controlling for additional sources of variance. And, further, to the extent that there is enough specific variance remaining to support reliable measurement of the local factors, then one may be able to estimate subscale scores, as well.
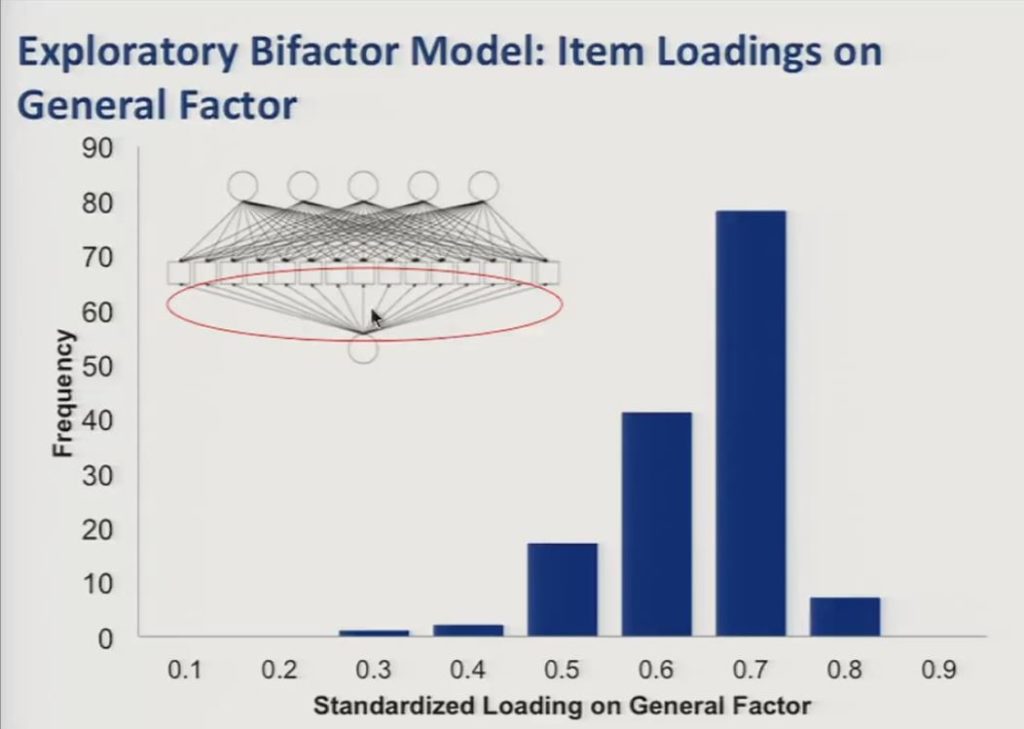
So in this slide we show the item loadings on the general factor represented here in the path diagram, and you can see in the histogram that they were generally high with the large majority of items loading at 0.5 or higher.
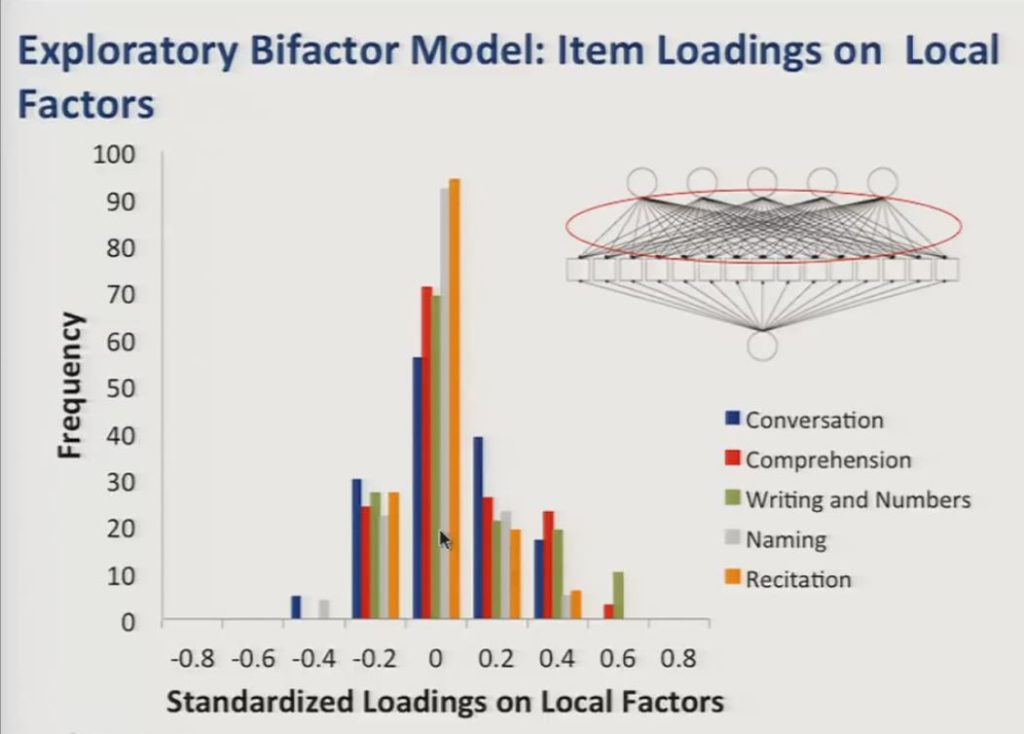
And the loadings on the local factors, again represented here in the path diagram, were on average smaller and centered close to zero, however, there were a number of significant positive loadings that you see here on the local factors, and these corresponded with meaningful distinctions in item content.
So based on item content associated with the local factors they appear to correspond with the following potential subdomains of communicative functioning: Writing and number use, auditory comprehension, naming, conversation and recitation of sequences.
And we use the output of the exploratory factor analysis to reduce the item set down to 56 items by eliminating items that either loaded less than 0.4 on the general factor, or that had positive salient loadings on multiple specific factors, or that had large correlated residuals after fitting a confirmatory bifactor model.
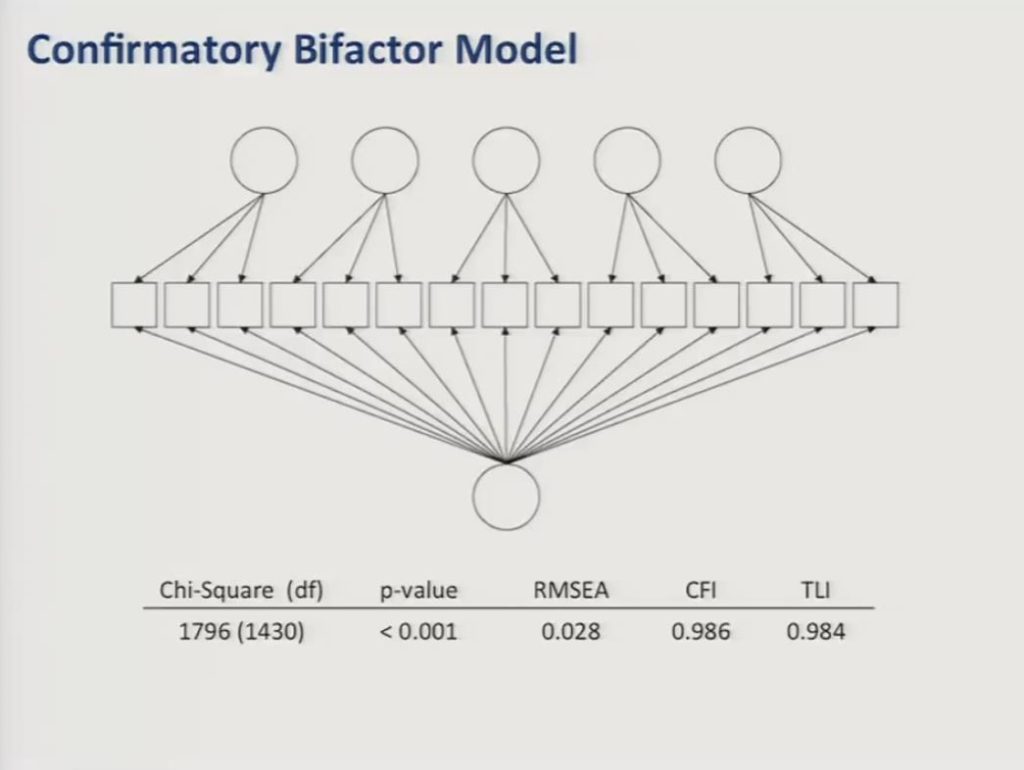
Finally, we fit a confirmatory bifactor model to the reduced item set of 56 items and as you can see here the data showed adequate fit to this model with comparative fit and Tucker Lewis’ indices both above 0.95 and a root mean square error of approximation less than 0.05.
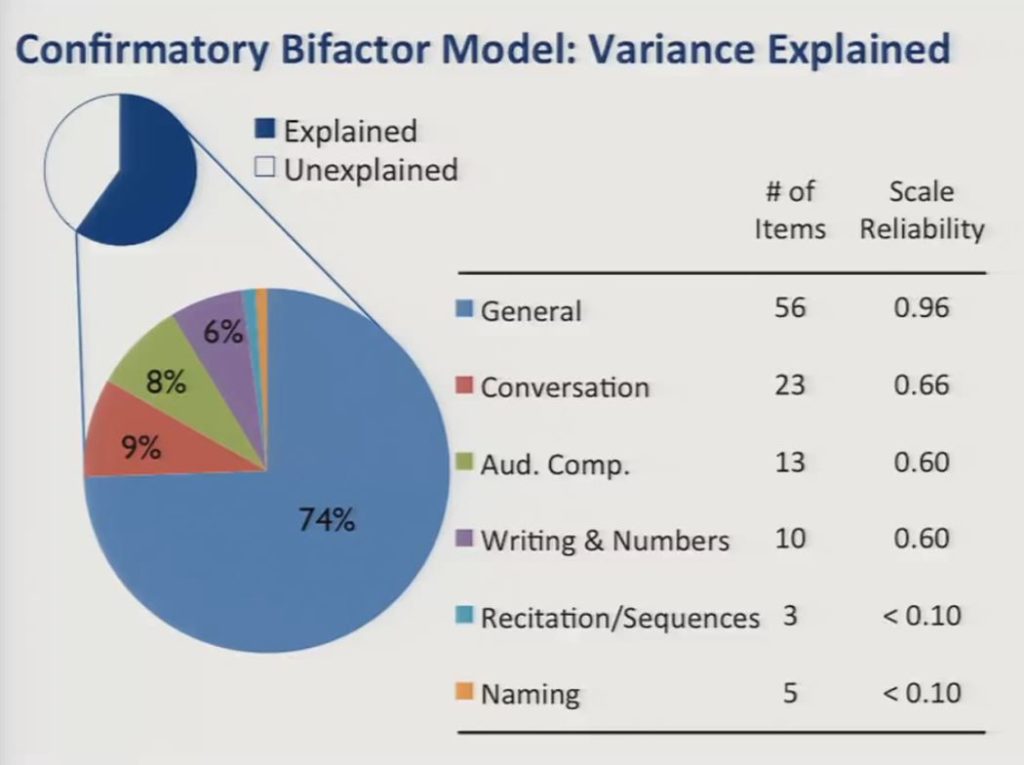
The confirmatory bifactor model explained 60% of the total variance, with the general factor accounting for nearly three-quarters of the explained variance, and the specific factors accounting for less than 10% each.
What we show here are the number of items associated with each factor and the scale reliabilities in our current sample. The low reliability quotients associated with the specific factors suggest that it would not be productive to try to measure them in the presence of the large general factor.
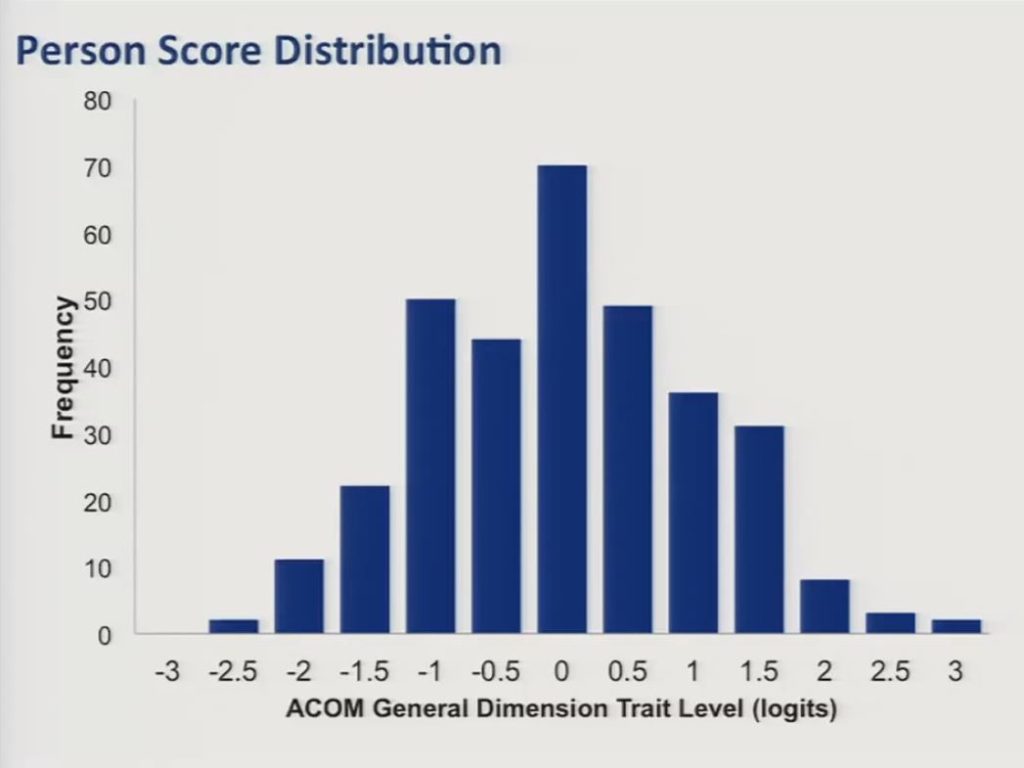
So we then proceeded to fit a bifactor graded response IRT model to the data and estimated person distribution scores for our sample along that general dimension. And trait level estimates were scaled to have a mean of zero, a standard deviation of approximately one. And, as you can see in this slide, they were fairly well normally distributed.
Computerized Adaptive Testing
So with these results in hand, we proceeded to examine the feasibility and the potential value of a shortened computerized adaptive test version of the ACOM.
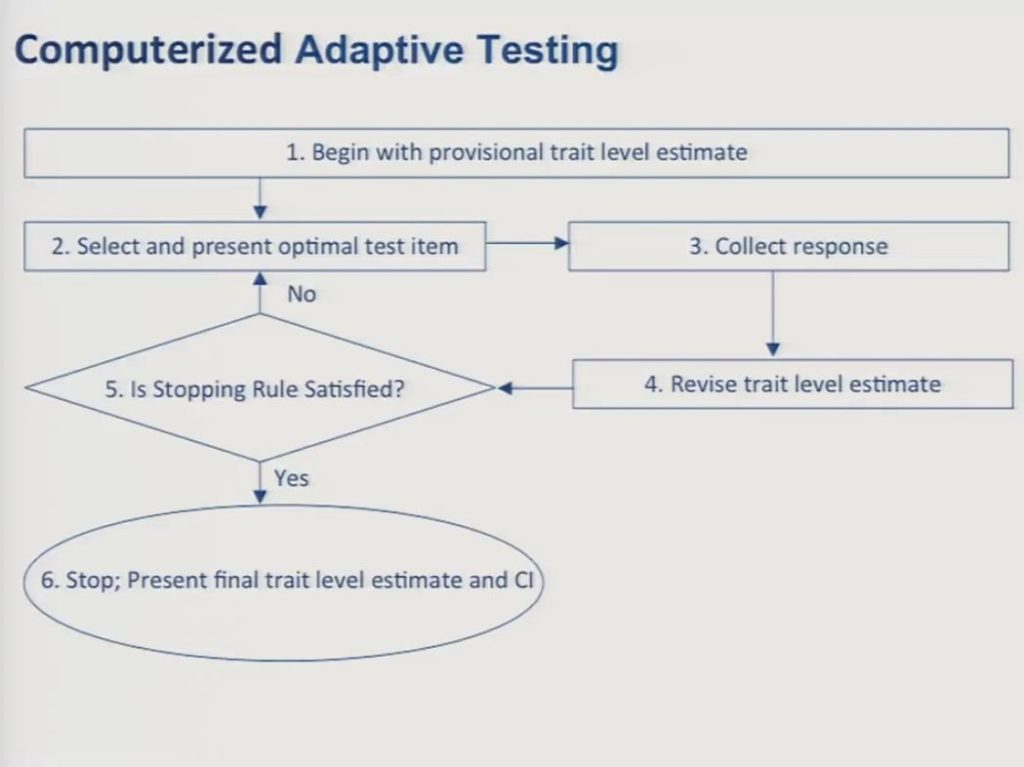
In the way of review since we’ve been through this a couple times today, I think most of you by now are familiar with the logic and the procedures behind CAT, so just very briefly and quickly you begin with a provisional estimate of the patient’s trait level. In the absence of any other information you can simply assume that the individual is at the mean of the calibration sample. You select an item that provides the most information about a patient at that particular trait level, and this is usually going to be an item whose item location on the test matches the trait level estimate of the patient.
Next, you collect a response from the patient, and then you revise your trait level estimate. And then you collect the response, based upon that response you revise the trait level estimate and then you examine whether or not your stopping rule is satisfied. And stopping rules can be determined on the basis of a set number of items, or on a level of precision for the score estimate, or on a combination of those. In the data that I’m going to show you I should say we set our stopping rule at administration of 15 items.
So you repeat steps two through five until your stopping rule is satisfied and then you stop the test and you calculate the final trait level estimate and its competence interval.
So we used the data from the full 56-item bank to conduct real data simulations of a 15-item static short form and a 15-item computerized adaptive test and compared the resulting score and precision estimates.
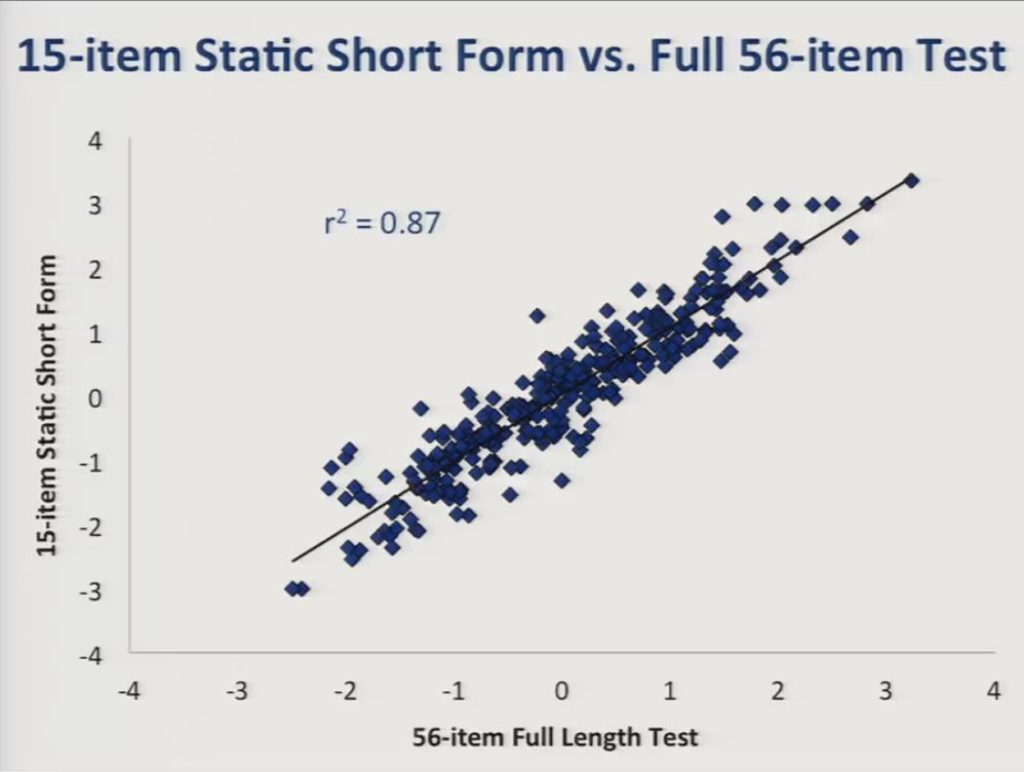
So this slide presents a comparison between scores obtained from the 15-item static short form and the full 56-item bank, and the r2 value was reasonably high at 0.87.
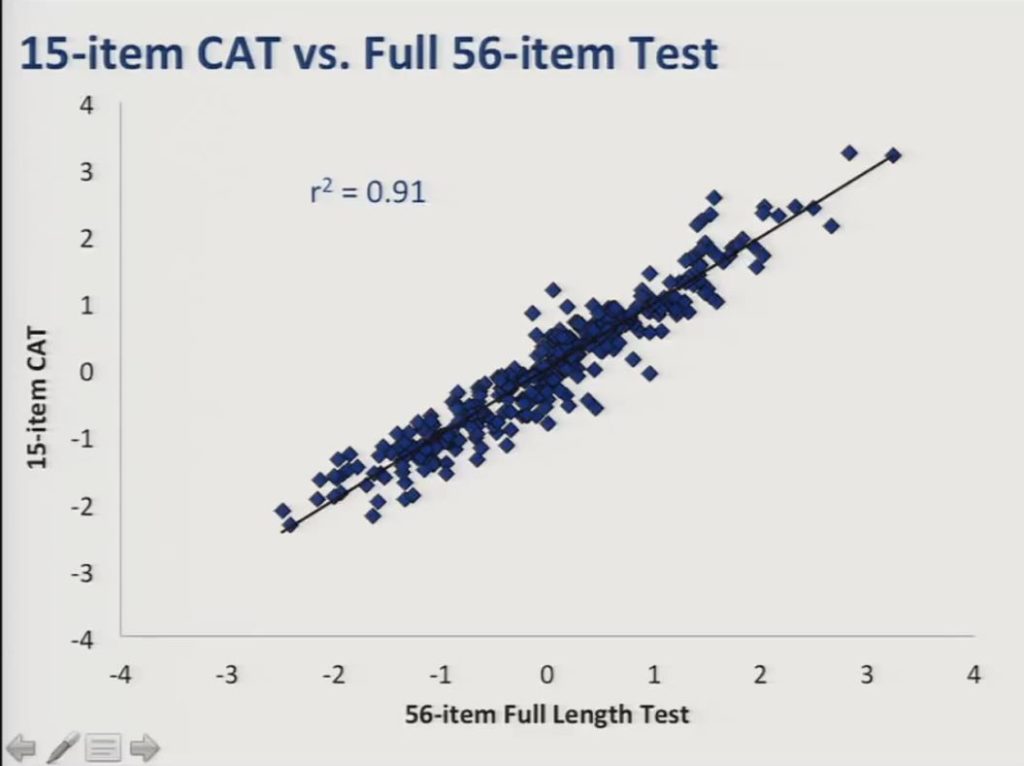
And here’s the comparison between the 15 item CAT and the full item bank and you can see here the r2 was even higher at 0.91.
&nb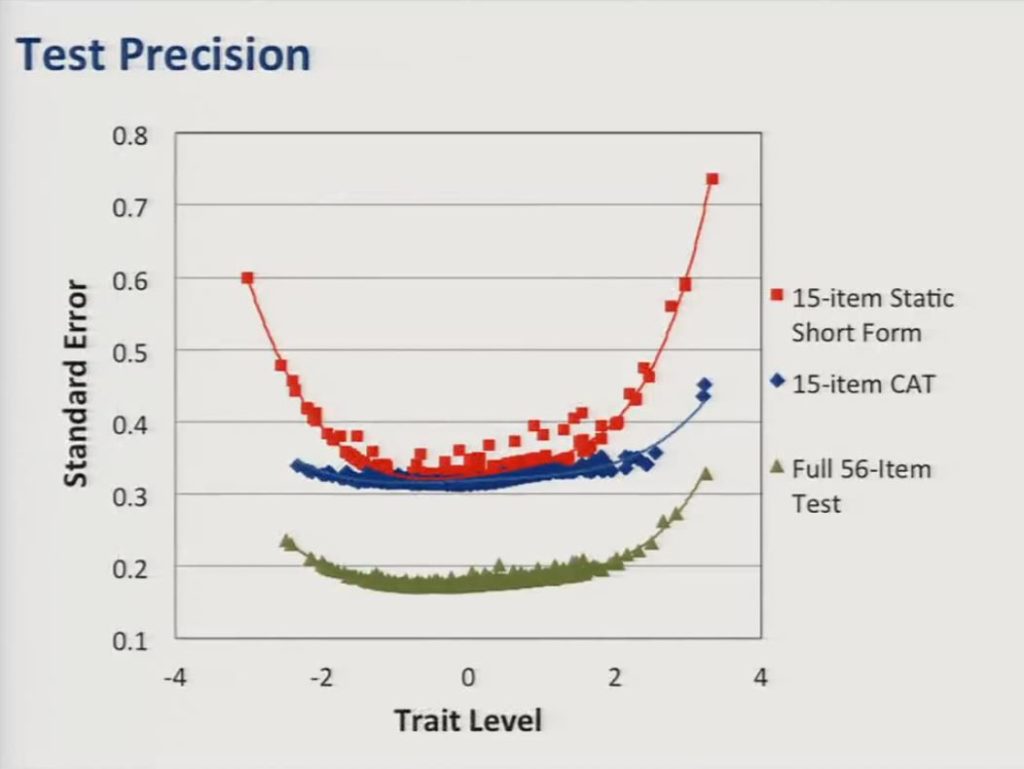
But the advantage of the CAT over the static short form can most clearly be seen on this graph, which shows test precision as a function of trait level estimates, so the standard error of the trait level estimates is represented along the vertical axis. And what you can see is although the static short form represented here in red approaches the precision of the CAT in the middle of the score distribution, the CAT provides much more precise estimates at the edges or at the range at either end of the distribution. For reference, in the current sample a standard error of 0.3 corresponds to a reliability coefficient of about 0.91.
Future Directions
So while we have much work to do, including establishing the convergent and divergent validity of the ACOM in evaluating its sensitivity to change, determining minimal clinically important differences, we believe that the results regarding the basic structure of the ACOM are promising.
We should note that we have a prospective field trial comparing the ACOM-CAT to a static short form version and the full item bank that’s currently underway in an independent sample of stroke survivors with aphasia in an attempt to replicate the simulated data that we just presented.
And in developing the ACOM we are attempting to be responsive to the growing need for patient centered outcomes that may be easily communicated to the public, to policymakers and to payers. And as our profession responds to these issues we believe that it will be essential to balance the need for simplicity and efficiency with the need to be as rigorous as possible in our approach to measurement.
So an important issue that we have not yet begun to address and, again, which has been discussed several times here today, is the extent to which the ACOM could be applied to other clinical populations with communication disorders.
We believe that it’s unlikely that a scale developed to provide optimal reliability and validity for persons with aphasia will provide satisfactory outcome measurement for other populations, but the beautiful thing is that we have a colleague that will have the opportunity to do that here soon.
But it may be possible to identify a core set of items that approximate key measurement model assumptions, including the assumption of item invariance across communicatively impaired populations. And such a scale may not be particularly useful for outcome measurement in individual cases, but it very well could be useful in the context of institutional, regional or national databases.
So I want to acknowledge our collaborators on this project: Shannon Austermann Hula, Clement Stone, Julie Wambaugh, Katherine Ross, Jim Schumacher, Ann Roehrig, and leave you with this final thought from Bond & Fox, that the quality of a discipline’s measures determine the value of its treatment and policy decisions. Thank you.
Questions and Discussion
Question: Can you talk a little bit more about how the CAT deals with the five local factors – conversation, writing and number use, auditory comprehension, naming and recitation of sequences – in only 15 items? From a clinical perspective, I’m wondering the extent that you truly can treat all factors. This is intriguing, but when you do it in real patients perhaps it’ll be that you need more items?
William Hula:
So in the simulation we presented, all the items were drawn from across those five factors that comprised 56 items, that’s correct. Content balancing is an important issue. So as we’re moving ahead, we’re including in the CAT algorithm a mechanism for ensuring that the overall makeup of the CAT reflects the makeup of the original item pool, if you get what I’m saying. Items are selected from the pool in roughly the same proportion in which they’re represented in the item bank because otherwise you can get some distortion there.
Patrick Doyle:
It’s not that all of those items aren’t represented in the item pool, there are reading and writing and auditory comprehension items that are represented in the item pool, but all of the common variants is forced into this general factor, and it allows you then to compute this single score that you can use for outcome measurement. And as you saw in the data there wasn’t sufficient scale reliability to validly try to capture these local factors.
William Hula:
Maybe it’s important to clarify that in using the bifactor model, those local sources of variants are effectively conditioned out. We’re interested in that single general factor that’s useful for outcome measurement, and we’re specifically developing a score that captures that type general factor, the variance in that general factor, and we’re specifically leaving out these local factors that are accounting for much less of the variants.
We’re using the bifactor model to get to a single measure that we’re going to treat like a unit measure, but like a unidimensional score because it comes from that one general factor.
In other applications I’ve seen in the field of psychiatry sometimes they end up with a general factor, as well as local factors that are still pulling in a variance that make them usual to measure on their own, which didn’t turn out to be the case in our data.
Patrick Doyle:
These are real data taken from the responses. I mean we simulated them, but they’re real data simulations using real data from real people from the responses of the sample of stroke survivors.
William Hula:
In the interest of full disclosure, you know, we’re estimating the model and looking at and comparing the CAT to the full item bank all in the same set of data, so it’s a little bit cheating, right? Because it’s all the same data, and to that extent the CAT simulations represent may be a best case scenario for what we might find when we actually do this in a new sample.
Question: Can you clarify what you meant when you said something to the effect that this really might not be that useful in an individual level? Did you want to revise that?
Patrick Doyle:
The point that I was making there was with respect to the ACOM being applicable to other populations of communicatively impaired individuals, and this is why I’m really happy that Carolyn got this grant, that she’s going to be able to look at her items in an aphasic population. Because up until now they’ve demonstrated no differential item functioning across groups of patients that primarily have speech production disorders. And I think aphasia is a very different animal.
So I was making a point that I thought and we believe it’s going to be difficult to construct scales that function optimally for measuring communicative functions in people with aphasia and have them also provide satisfactory measurement in other populations. This is another opportunity here to cross-calibrate some items from these different scales, which actually we’ve talked about and actually submitted a R01 to try to do, but that didn’t turn out so well.
But it may be possible to have a core set of items that might function invariantly across those populations, but we’re just not so sure how well such a scale might work at the individual level, but it might work just fine at institutional, regional, organizational levels was that point that we were making there.
William Hula:
Just to maybe try to make that point a little more concrete, I mean the issue is that to get a scale that will function variantly across all these disparate groups, you may end up having to throw out a lot of item content and when you throw out item content you can end up reducing the reliability of your measurement.
And so for measuring individual outcomes you need more reliability. When you have a large dataset the noise can cancel itself out and you don’t need so much, and that’s the point we’re trying to get at there.
Question: With your stop rule do you think that 15 items is sufficient for the purpose of measuring pre-post outcomes, in the sense of at admission and again at discharge?
Patrick Doyle:
We got precision estimates and score estimates that were pretty similar to the full 56-item bank, that’s the empirical answer.
But the other thing I would say, too, is stopping rules are, you know, you can set stopping rules, you can set a stopping rule for 20 items or you could set a stopping rule for a certain level of precision. In our example we set it at 15 items, and it’s just an example. You can set your stopping rule higher for more items, but I think the message is that we got as precise score estimates with 15 items as we did with a 56-item bank, almost. And the full bank, obviously, function better than either the short form or the CAT, but they perform pretty well.
Audience Comment:
If I could follow up, kind of representing Karon Cook, who is not here. But I know in some of their tests of looking at item banks versus CAT administrations, when they set the stopping rules not so much on the number of items, but on precision of measurement that in some of their tests they’ve been able to get nearly as precise a measurement to the full forum, like you’re getting very precise measurements with three or four items. And so the response burden goes down tremendously, and I think as clinicians it’s a little bit tough to get our minds around saying, I’m going to ask three items – and only these three situations might come up, and I have to trust that that’s really tested this person. But with all of this measurement science behind it this group is talking about we have to trust that, yes, when the items are calibrated well, and it’s all working well, yes, those three or four or five items will give you as precise.
Patrick Doyle:
Yes, and I think the other point to be made is that if your purpose for assessment is for another purpose, to develop a treatment plan, for example, you may want more than three items, but if it’s to determine group membership or determine outcome, and you’re just looking for a single score estimate I agree you can frequently get precise score estimates with very few items. You might not want to do that if you’re using that test for planning therapy, you might want more items.
References
Acquadro, C., Berzon, R., Dubois, D., Leidy, N. K., Marquis, P., Revicki, D. & Rothman, M. (2003). Incorporating the patient’s perspective into drug development and communication: An ad hoc task force report of the patient‐reported outcomes (PRO) harmonization group meeting at the Food and Drug Administration, February 16, 2001. Value In Health, 6(5), 522–531 [PubMed]
Coster, W. J., Haley, S. M., Ludlow, L. H., Andres, P. L. & Ni, P. S. (2004). Development of an applied cognition scale to measure rehabilitation outcomes. Archives of Physical Medicine and Rehabilitation, 85(12), 2030–2035 [PubMed]
Doyle, P. J., Hula, W. D., Hula, S. N., Stone, C. A., Wambaugh, J. L., Ross, K. B. & Schumacher, J. G. (2013). Self-and surrogate-reported communication functioning in aphasia. Quality of Life Research, 22(5), 957–967 [PubMed]
Doyle, P. J. McNeil, M. R. Bost, J. E. Ross, K. B. Wambaugh, J. L. Hula, W. D. Mikolic, J. M. (2007). The burden of stroke scale (BOSS) provided valid, reliable, and responsive score estimates of functioning and well-being during the first year of recovery from stroke. Quality of Life Research, 16(8), 1389–1398 [PubMed]
Doyle, P. J., McNeil, M. R., Le, K., Hula, W. D. & Ventura, M. B. (2008). Measuring communicative functioning in community‐dwelling stroke survivors: Conceptual foundation and item development. Aphasiology, 22(7-8), 718–728
Doyle, P. J., McNeil, M. R., Mikolic, J. M., Prieto, L., Hula, W. D., Lustig, A. P., Ross, K., Wambaugh, J. L., Gonzalez-Rothi, L. J. & Elman, R. J. (2004). The burden of stroke scale (BOSS) provides valid and reliable score estimates of functioning and well-being in stroke survivors with and without communication disorders. Journal of Clinical Epidemiology, 57(10), 997–1007 [PubMed]
Duncan, P. W., Wallace, D., Lai, S. M., Johnson, D., Embretson, S. & Laster, L. J. (1999). The stroke impact scale version 2.0 evaluation of reliability, validity, and sensitivity to change. Stroke, 30(10), 2131–2140 [PubMed]
Haley, S. M., Coster, W. J., Andres, P. L., Ludlow, L. H., Ni, P., Bond, T. L., Sinclair, S. J. & Jette, A. M. (2004). Activity outcome measurement for postacute care. Medical Care, 42(1), 1–49 [PubMed]
Hula, W. D., Doyle, P. J. & Hula, S. N. (2010). Patient-reported cognitive and communicative functioning: 1 construct or 2?. Archives of Physical Medicine and Rehabilitation, 91(3), 400–406 [PubMed]
Reise, S. P., Moore, T. M. & Haviland, M. G. (2010). Bifactor models and rotations: exploring the extent to which multidimensional data yield univocal scale scores. Journal of Personality Assessment, 92(6), 544–559 [PubMed]
Reise, S. P., Morizot, J. & Hays, R. D. (2007). The role of the bifactor model in resolving dimensionality issues in health outcomes measures. Quality of Life Research, 16(1), 19–31 [PubMed]
Williams, L. S., Weinberger, M., Harris, L. E. & Biller, J. (1999). Measuring quality of life in a way that is meaningful to stroke patients. Neurology, 53(8), 1839 [PubMed]

